前言
数据蕴藏价值,但数据的价值需要用 IT 技术去发现、探索,可视化可以帮助人更好的去分析数据,信息的质量很大程度上依赖于其呈现方式。在数据分析上,热力图无疑是一种很好的方式。在很多行业中都有着广泛的应用。
最近刚好项目中需要用到 3D 热力图的效果展示。网上搜了相关资料,发现大多数是 2D 效果或者伪 3D 的,而 3D 粒子效果对于性能上的体验不是很好,于是取巧写了个 3D 热力图的效果 。
Demo : http://www.hightopo.com/demo/heatMap3D/
部分效果图:
应用场景

大楼内的人员分布热力图。我们可以通过观察到一个区域的颜色深浅来判断该区域内实时的人员流动情况,知道哪个区域人多,哪个区域人少。该场景可适用于大楼内的警务监控,在发生突发事件时科学高效地制定分流疏导策略提供有力的帮助和支持,减少损失。亦可用于火险预警,监控区域实时温度。
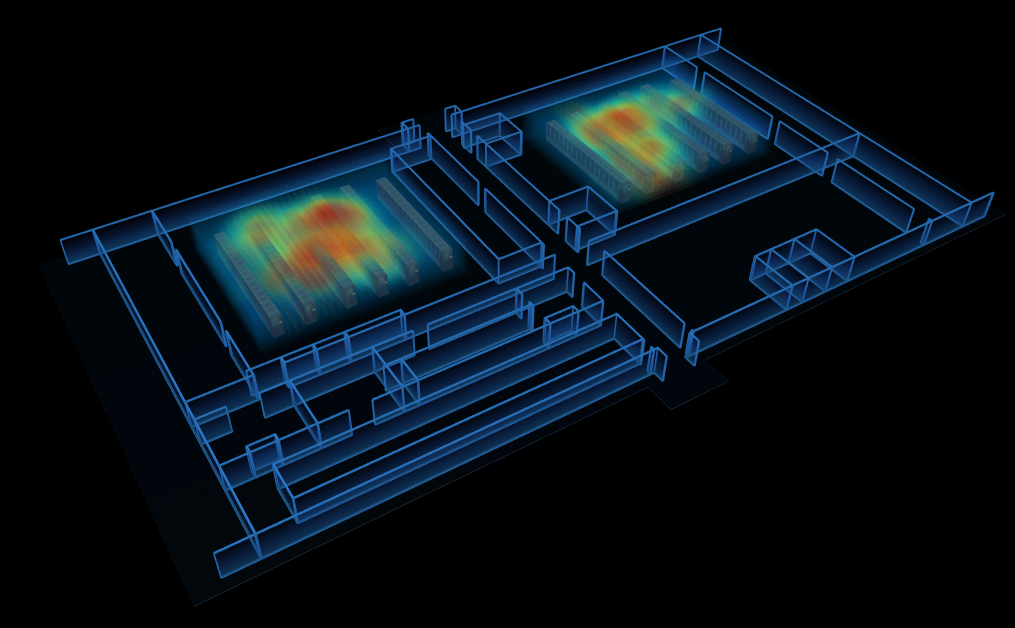
室内设备温度热力图。传统的数据中心汇报方式枯燥单调、真实感不强,互动性差等,借助于 3D 热力图的可视化呈现方式,机房运维管理人员可大大提高工作效率及降低工作失误的可能性。
整体思路
在场景反序列化之后,设置热力图的初始参数,初始化后得到的热力图模型添加进场景中,模拟 3D 热力图效果,最后再添加扫描、换肤、温度提示等功能。
1.数据准备
在场景中画出热力图的区域,如图
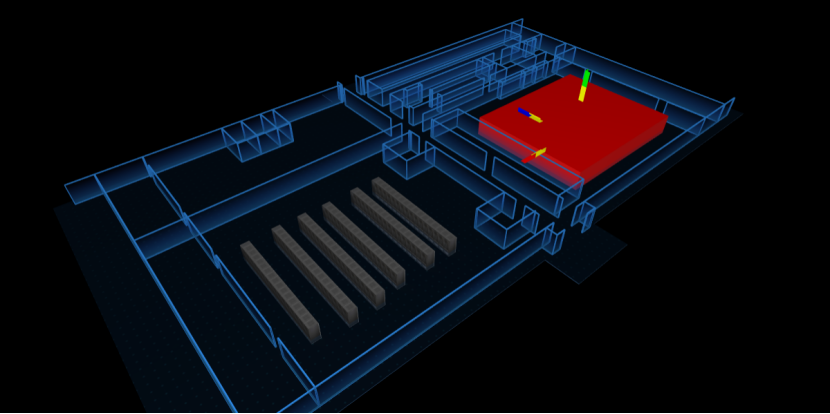
首先确定要生成热力图的区域 areaNode ,然后随机生成 20 个点的信息,包含坐标 position (坐标是相对红色长方体的某个顶点) 及热力值 temperature 。
以下是该部分的主要代码:
function getTemplateList(areaNode, hot, num) {
    let heatRect = areaNode.getRect();
    let { width, height } = heatRect;
    let rackTall = areaNode.getTall();
    hot = hot + this.random(20); let templateList = []; for (let i = 0; i < num; i++) { templateList.push({ position: { x: 0.2 * width + this.random(0.6 * width), y: 0.2 * height + this.random(0.6 * height), z: 0.1 * rackTall + this.random(0.8 * rackTall) }, temperature: hot }); } return templateList; } let heatMapArea_1 = dm.getDataByTag('heatMapArea_1'); let templateList_1 = this.getTemplateList( heatMapArea_1, 70, 20 );
2.初始化
使用 ht-thermodynamic.js 插件来生成热力图。
发热点的数据准备好后,接着配置热力图的参数,参数说明如下。
// 默认配置
let config = {
    hot: 45,
    min: 20,
    max: 55, size: 50, pointNum: 20, radius: 150, opacity: 0.05, colorConfig: { 0: 'rgba(0,162,255,0.14)', 0.2: 'rgba(48,255,183,0.60)', 0.4: 'rgba(255,245,48,0.70)', 0.6: 'rgba(255,73,18,0.90)', 0.8: 'rgba(217,22,0,0.95)', 1: 'rgb(179,0,0)' }, colorStopFn: function (v, step) { return v * step * step }, }; // 获取区域数据 let rackTall = areaNode.getTall(); let heatRect = areaNode.getRect(); let { width, height } = heatRect; if (width === 0 || height === 0) return; // 热力图初始化 let thd = this.thd = new ht.thermodynamic.Thermodynamic3d(g3d, { // 热力图所占用的空间 box: new ht.Math.Vector3(width, height, rackTall), // 配置温度的最小值和最大值  min: config.min, max: config.max, // 每一片的渲染间隔 interval: 40, // 为false时,温度区域交集时值不累加,取最高温度 remainMax: false, // 每一片的透明度  opacity: config.opacity, // 颜色步进  colorStopFn: config.colorStopFn, // 颜色范围  gradient: config.colorConfig });
3.加载热力图
将第一步生成的发热点,设置 thd 的数据对象,调用 thd.createThermodynamicNode() 来生成热力图的 3D 图元。设置其相关信息,将该图元添加进 3D 场景中。这样一个简单的 3D 热力图就算完成了。
// 加载热力图
function loadThermodynamic(thd, areaNode, templateList, config) {
    thd.setData(templateList);
    // x,y,z面数 let node = this.heatNode = thd.createThermodynamicNode(config.size, config.size, config.size); let p3 = areaNode.p3(); node.setAnchorElevation(0); node.p3(p3); node.s({ 'interactive': true, 'preventDefaultWhenInteractive': false, '3d.movable': false, "wf.visible": false }); g3d.dm().add(node); }
主体介绍完了,现在开始讲讲该 demo 的几个功能。
4.温度提示

因为在 3D 场景中,我不好判断当前鼠标坐标(x,y,z),所以我将 tip 面板放在了 2D 图纸上,将 2D 图纸嵌在 3D 场景的上层。通过监听 3D 场景中的 onMove 事件来控制 tip 面板的显隐及值的变化。
tip 显隐控制:当鼠标移入进热力图区域时,tip 显示,反之则隐藏。在这我遇到了个问题,因为我把除了热力图区块以外的设置成不可交互的,当鼠标移出区域后,无法监听到 onMove 事件,导致 bug,tip 面板始终存在着。我使用了 setTimeout 来解决这问题,延时1s后自动隐藏,但后来发现完全没必要滥用 setTimeout ,只要监听 onLeave 时隐藏 tip 就行了。
tip 值控制:调用 ht-thermodynamic.js 的方法可以获取到当前鼠标相对热力图区域的温度值 thd.getHeatMapValue(e.event,'middle'),实时改变 tip 面板的 value 属性 。
代码如下:
// 交互效果
g3d.mi(e => {
    if (e.kind === 'onMove') {
        let { clientX, clientY } = e.event; if (this.templateTip) { let value1 = this.thd1.getHeatMapValue(e.event, 'middle'); let value2 = this.thd2.getHeatMapValue(e.event, 'middle'); if (value1 || value1 === 0 || value2 || value2 === 0) { let position = g2d.getLogicalPoint({ x: clientX, y: clientY }) this.templateTip.a('value', value1 || value2 || 0) let { width, height } = this.templateTip.getRect() this.templateTip.setPosition({ x: position.x + width / 2, y: position.y - height / 2 }) } } } else if (kind === 'onLeave') { let tag = data.getTag() if (tag && tag.hasOwnProperty('hoverBlock') > -1) { this.g2d.getView().style.cursor = 'default'; } this.templateTip && this.setVisible(this.templateTip, false) } })
5.扫描

将第三步中的 thd.createThermodynamicNode() 替换。在生成热力图对象时,不直接返回一个模型,而是选择某一个方向进行“切割”,将这一方向的长度均分为 n 份,通过 thd.getHeatMap() 方法来获取每一片的热成像。n 的值理论上可以取任意值,但为了渲染效果更好一点,这里我取的是 50,不至于太多而导致首次渲染时间过长。每切出一个面,我们就在热力区域的相对位置上动态创建一个 ht.Node ,接着使用 ht.Default.setImage() 将切出来的面注册成图片,去设置成该 node 的贴图(只需设置切割方向上的两个面就行)。最后将所有的 node 添加进 dataModel ( ht 中承载 Data 数据的模型)。
扫描功能,有两种方案。第一种是在步骤 3 切割贴片时,不去创建 n 个 node ,而是只创建一个,然后动态去设置该 node 的贴图及坐标,模拟扫描效果;第二种依旧创建 n 个 node,然后全部隐藏,通过不同时刻来控制让其中某一个节点显示,模拟扫描功能。这里我采用了第二种,因为第一种要去频繁的修改多种属性才能达到效果,第二种的话只要控制其 '3d.visible'。
主要代码如下:
let length;
if (dir === 'z') {
    length = rackTall;
}
else if (dir === 'x') { length = width; } else if (dir === 'y') { length = height; } let size = config.size; for (let index = 0; index < size; index++) { // 热力切图间隔 const offset = length / size; let timer = setTimeout(() => { let ctx = thd.getHeatMap(index * offset, dir, colorConfig); let floor = this.getHeatFloor( areaNode, dir, ctx, index, size, config ); this.floors.push(floor); dm.add(floor); }, 0); this.timers.push(timer); } function start() { this.hide(); this.anim = true; this.count = 0; let frames = this.floors.length; let params = { frames, // 动画帧数 interval: 50, // 动画帧间隔毫秒数 easing: t => { return t; }, finishFunc: () => { if (this.anim) { this.start(); } }, action: (v, t) => { this.count++; this.show(this.count); } }; this.scanning = ht.Default.startAnim(params); } function hide(index) { if (index || index === 0) { this.floors.forEach((i, j) => { if (index === j) { i.s('3d.visible', false); } else { i.s('3d.visible', true); } }); } else { this.floors.forEach(i => { i.s('3d.visible', false); }); } } function show(index) { if (index || index === 0) { this.floors.forEach((i, j) => { if (index === j) { i.s('3d.visible', true); } else { i.s('3d.visible', false); } }); } else { this.floors.forEach(i => { i.s('3d.visible', true); }); } }
第一种方式实现主要代码:
getHeatFloor(node, dir, config) {
    let { width, height } = node.getRect();
    let rackTall = node.getTall();
    let s3 = [1, rackTall, height];
    let floor = new ht.Node(); floor.setTag('hotspot'); floor.setAnchor3d({ x: 0.5, y: 0.5, z: 0.5 }); floor.s3(s3); floor.s({ interactive: true, preventDefaultWhenInteractive: false, '3d.selectable': true, '3d.movable': false, 'all.visible': false, [Top + '.visible']: true, [Top + '.opacity']: config.opacity, [Top + '.transparent']: true, [Top + '.reverse.flip']: true, [Top + '.color']: 'rgba(51,255,231,0.10)' }); return floor } getHeatFloorInfo(node, dir, ctx, index, size, config) { let { width, height } = node.getRect(); let rackTall = node.getTall(); let point = node.getPosition3d(); let part = 0; let p3, s3; let Top = 'top'; if (!dir) { dir = 'z'; } // 热力图的yz方向与ht的yz方向相反 dir=z代表的是竖直方向 if (dir === 'x') { Top = 'left'; part = (width / size) * index; p3 = [ point[0] - width / 2 + part, point[1] + rackTall / 2, point[2] ]; // p3 = [point[0] + part, point[1], point[2]]; s3 = [1, rackTall, height]; } else if (dir === 'y') { Top = 'front'; part = (height / size) * index; p3 = [ point[0], point[1] + rackTall / 2, point[2] - height / 2 + part ]; s3 = [width, rackTall, 1]; } else if (dir === 'z') { Top = 'top'; part = (rackTall / size) * index; p3 = [point[0], point[1] + part, point[2]]; s3 = [width, 1, height]; } let heatName = this.generateUUID(); ht.Default.setImage('heatMap' + heatName, ctx); this.heatFloorInfo.push( { img: 'heatMap' + heatName, p3 } ) } show(index){ let info = this.heatFloorInfo[index] this.floor.p3(info.p3) this.floor.s('3d.visible', true); this.floor.s('top.image', info.img); // 手动刷新 this.floor.iv(); }
6.换肤

换肤的实现原理:根据不同的场景值去动态修改 ht.graph3d.Graph3dView 的背景色及墙的颜色等。
代码:
function changeSkin() {
        let backgroundColor = this.g3d.dm().getBackground(),
            dark_bg = this.g3d.dm().getDataByTag('dark_skin'), light_bg = this.g3d.dm().getDataByTag('light_skin'); if (backgroundColor !== 'rgb(255,255,255)') { this.g3d.dm().setBackground('rgb(255,255,255)'); } else { this.g3d.dm().setBackground('rgb(0,0,0)'); } dark_bg.s('2d.visible', !dark_bg.s('2d.visible')); dark_bg.s('3d.visible', !dark_bg.s('3d.visible')); light_bg.s('2d.visible', !light_bg.s('2d.visible')); light_bg.s('3d.visible', !light_bg.s('3d.visible')); }
本篇就介绍到了,目前 ht-thermodynamic.js 还处于测试阶段,待到相对成熟后再更新该 demo ,有兴趣了解更多关于 2D/3D 可视化的构建,可翻阅其他文章的例子,HT 会给你很多不可思议的东西。