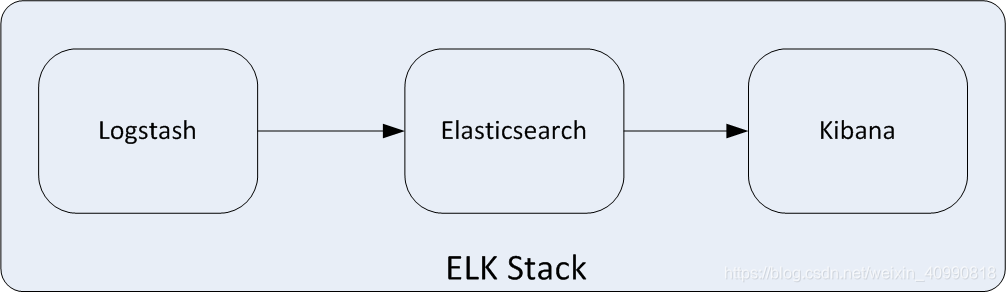
ELK集中式日志
ELK可以管理上百台服务器的日志信息。
- Elasticsearch是一个开源的分布式搜索引擎,提供搜索、分析和存储数据三大功能。它的特点有:分布式、自动发现、索引自动分片、索引副本机制、Restful风格接口、多数据源及自动搜索负载等。(存储日志)
- Logstash是一个开源的用来收集、解析和过滤日志的工具。支持几乎任何类型的日志,包括系统日志、业务日志和安全日志。它可以从许多来源接收日志,这些来源主要包括Syslog、消息传递(如RabbitMQ)和Filebeat;能够以多种方式输出数据,这些方式主要包括电子邮件、WebSockets和Elasticsearch.(收集日志
或者数据库)
- Kibana是一个基于Web的友好图形界面,用于搜索、分析和可视化存储在Elasticsearch中的数据。它利用Elasticsearch的RESTful接口来检索数据,不仅允许用户定制仪表板视图,还允许用户以特殊的方式查询、汇总和过滤修改。(可视化日志管理)
ELK的实现
第一步:安装Elasticsearch(适当降低JVM内存分配 避免工具宕机)
集群环境下的核心配置
https://blog.csdn.net/wang_zhenwei/article/details/50385743(更详细的配置)
cluster.name: aubin-cluster # 集群名称
node.name: els1 # 节点名称,仅仅是描述名称,用于在日志中区分
network.host: 192.168.0.1 # 当前节点的IP地址
http.port: 9200 # 对外提供服务的端口,9300为集群服务的端口
transport.tcp.port:  9300
discovery.zen.ping.unicast.hosts: ["172.18.68.11", "172.18.68.12","172.18.68.13"] # 集群个节点IP地址,也可以使用els、els.shuaiguoxia.com等名称,需要各节点能够解析
discovery.zen.minimum_master_nodes: 2 # 为了避免脑裂,集群节点数最少为 半数+1
这下面是必配项
集群中节点作为负载器、协调器、搜索器节点设置
# 配置文件中给出了三种配置高性能集群拓扑结构的模式,如下:
# 1. 如果你想让节点从不选举为主节点,只用来存储数据,可作为负载器
# node.master: false
# node.data: true
#
# 2. 如果想让节点成为主节点,且不存储任何数据,并保有空闲资源,可作为协调器
# node.master: true
# node.data: false
#
# 3. 如果想让节点既不称为主节点,又不成为数据节点,那么可将他作为搜索器,从节点中获取数据,生成搜索结果等
# node.master: false
# node.data: false
启动es
#普通的  进入bin目录下
./elasticsearch -d
#Docker容器中
systemctl enable elasticsearch.service
systemctl start elasticsearch
查看节点信息
curl -XGET 'http://47.94.101.75:9200/_cat/nodes?pretty'
curl -XGET 'http://192.168.25.100:9200/_cat/nodes?pretty'
第二步:安装Elasticsearch-Head(用于往Elasticsearch中添加索引)
1.安装npm
https://blog.csdn.net/Aaron_Zhang939/article/details/99234999
添加模块
npm install grunt-contrib-jasmine
2.安装Elasticsearch-Head
yum install -y epel git
yum install -y npm
git clone git://github.com/mobz/elasticsearch-head.git
cd elasticsearch-head
npm install
# 后台启动npm run start &
npm run start
检查是否启动成功:
http://192.168.25.100:9100
解决无法添加elasticsearch
需要在elasticsearch的elasticsearch.yml文件里面添加
http.cors.enabled: true
http.cors.allow-origin: "*"
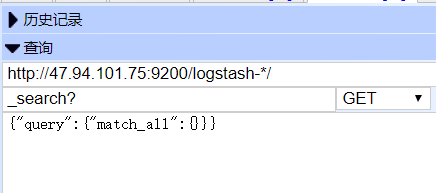
elasticsearch的查询语句
http://IP:9200/indexName?q=123&pretty=true
http://IP:9200/indexName/_search?q=*123*pretty=true #模糊查询
indexName是索引名字,  pretty=true表示格式化输出
?q=123表示搜索123
第三步: 安装Logstash
https://www.cnblogs.com/cjsblog/p/9459781.html
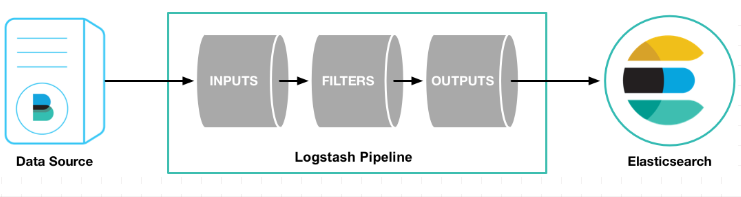
Logstash管道有两个必需的元素,输入和输出,以及一个可选元素过滤器。
输入插件从数据源那里消费数据,过滤器插件根据你的期望修改数据,输出插件将数据写入目的地。
a.下载解压
wget https://artifacts.elastic.co/downloads/logstash/logstash-7.1.1.tar.gz
tar -zxvf logstash-7.1.1.tar.gz -C /usr/local/logstash
b.配置Logstash /usr/local/logstash/bin
vim stdin.conf #编写配置文件
input{
        file {
               path => "/var/log/nginx/access.log_json"  #NGINX日志地址 json格式
               codec => "json"  #json编码
        }
}
filter {
        mutate {
                split => ["upstreamtime", ","]
        }
        mutate {
                convert => ["upstreamtime", "float"]
        }
}
output{
        elasticsearch {
                hosts => ["192.168.25.100:9200"]   #elasticsearch地址
                index => "logstash-%{type}-%{+YYYY.MM.dd}"   #索引
                workers => 1
                template_overwrite => true
        }

}
修改config/jvm.option
-Xms128m
-Xmx128m
启动
./logstash -f stdin.conf & #后台启动
建立软连接便于操作
ln -s /usr/local/logstash/bin/logstash /bin/
测试
logstash -e 'input { stdin { } } output { stdout {} }'
第四步: 配置Nginx (作为logstash的数据来源)
#user  nobody;
worker_processes  1;
#error_log  logs/error.log  notice;
#error_log  logs/error.log  info;
#pid        logs/nginx.pid;
events {
   worker_connections  1024;
}
http {

    upstream kibana4 {  #对Kibana做代理
        server 127.0.0.1:5601 fail_timeout=0;
    }
    include       mime.types;
    default_type  application/octet-stream;
    #log_format  main  '$remote_addr - $remote_user [$time_local] "$request" '
    #                  '$status $body_bytes_sent "$http_referer" '
    #                  '"$http_user_agent" "$http_x_forwarded_for"';

     log_format json '{"@timestamp":"$time_iso8601",'   #配置NGINX的日志格式 json
                        '"host":"$server_addr",'
                        '"clientip":"$remote_addr",'
                        '"size":$body_bytes_sent,'
                        '"responsetime":$request_time,'
                        '"upstreamtime":"$upstream_response_time",'
                        '"upstreamhost":"$upstream_addr",'
                        '"http_host":"$host",'
                        '"url":"$uri",'
                        '"xff":"$http_x_forwarded_for",'
                        '"referer":"$http_referer",'
                        '"agent":"$http_user_agent",'
                        '"status":"$status"}';
     access_log /var/log/nginx/access.log_json json;   #配置日志路径 json格式
     error_log /var/log/nginx/error.log;
    sendfile        on;
    #tcp_nopush     on;
    #keepalive_timeout  0;
    keepalive_timeout  65;
    #gzip  on;

    server {
    listen               *:80;
    server_name          kibana_server;
    location / {
        root   /usr/local/nginx/html/;
        index  index.html  index.htm;
    }

}
}
启动:
/usr/local/nginx/sbin/nginx -c /usr/local/nginx/conf/nginxelk.conf
关闭:
ps -ef |grep nginx   (用户ID 进程ID 父进程ID)
kill -9  进程号
第五步 安装Kibana(可视化日志管理 注意版本要与elasticsearch匹配)
a.下载解压
wget https://artifacts.elastic.co/downloads/kibana/kibana-7.1.1-linux-x86_64.tar.gz
tar xf kibana-7.1.1-linux-x86_64.tar.gz
b.修改配置文件
cd /usr/local/kibana-7.1.1-linux-x86_64/config
vim ./config/kibana.yml
elasticsearch.url: "   只需要修改URL为ElasticSearch的IP地址
server.host: "0.0.0.0" #开启远程访问
i18n.locale: "zh-CN" #汉化
c.启动
./kibana & 后台启动
启动成功以后 会监听 5601端口
netstat -tunlp|grep 5601
kill -9 进程号
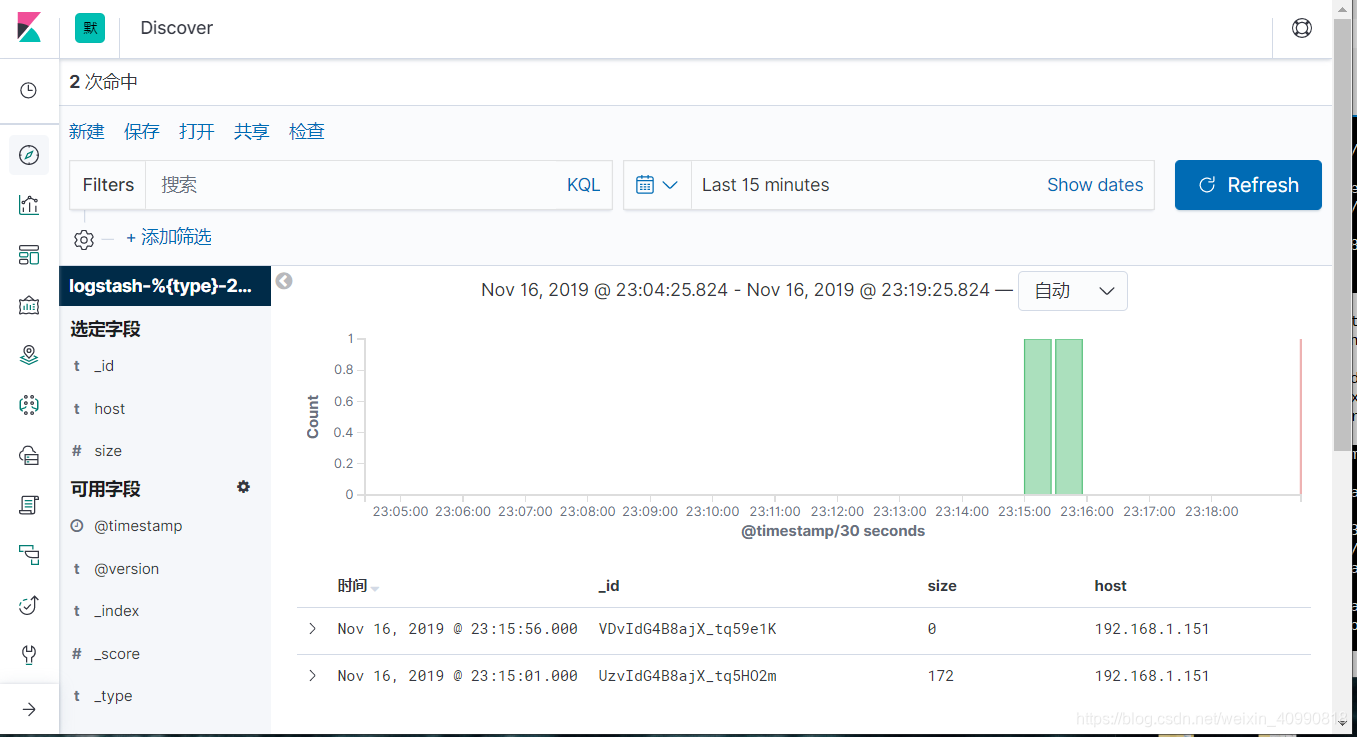
d.测试(设置-创建索引模式)
http://192.168.25.100:5601
设置Kabana的自动刷新
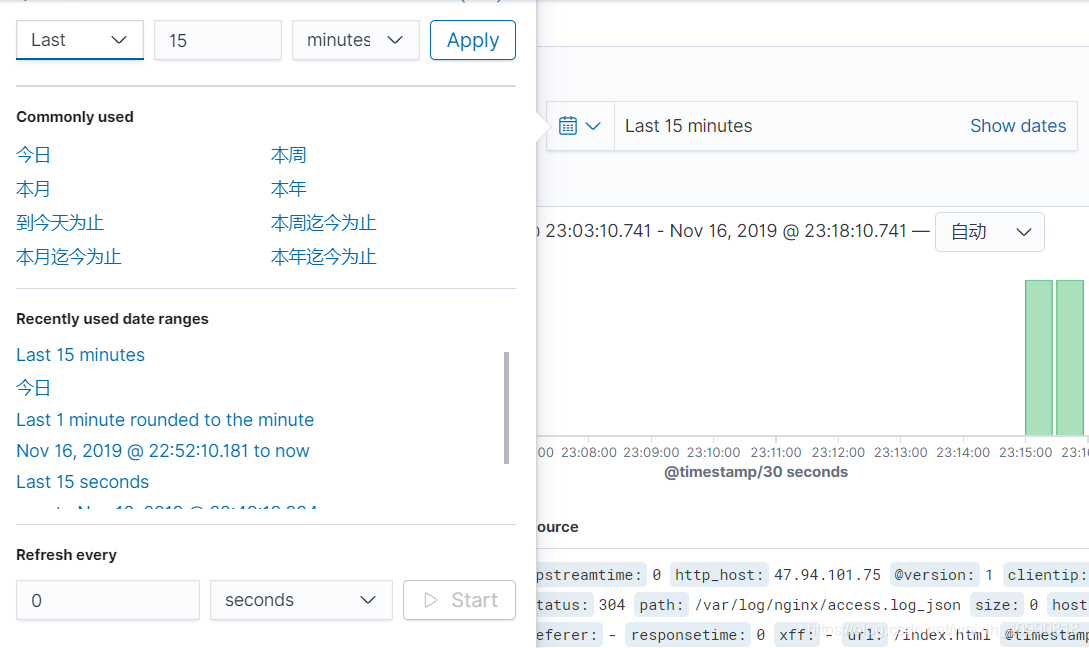
最终演示结果