这里我们用到matplotlib、numpy和Axes3D库
from mpl_toolkits.mplot3d import Axes3D
import matplotlib.pyplot as plt
import numpy as np
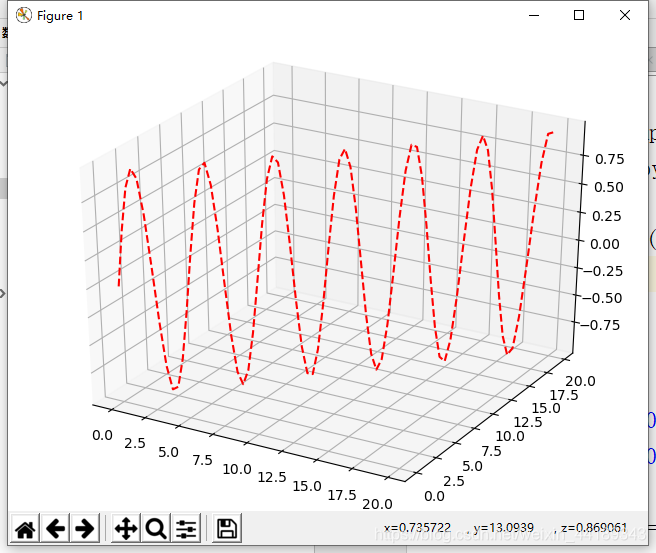
点线图:
print("点线图")
fig = plt.figure()
ax = Axes3D(fig)
X = np.arange(0,20,0.25)
Y = np.arange(0,20,0.25)
Z = np.sin(X+Y)
ax.plot(X,Y,Z,color='red',linestyle="--")
plt.show()
 散点图:
散点图:
print("散点图")
fig = plt.figure()
ax = Axes3D(fig)
for c,m,zlow,zhigh in [("r","o",0,8),("b","^",7,15)]:
    x = np.random.uniform(0,10,100)
    y = np.random.uniform(0,10,100)
    z = np.random.uniform(zlow,zhigh,100)
    ax.scatter(x,y,z,color=c,marker=m)
plt.show()
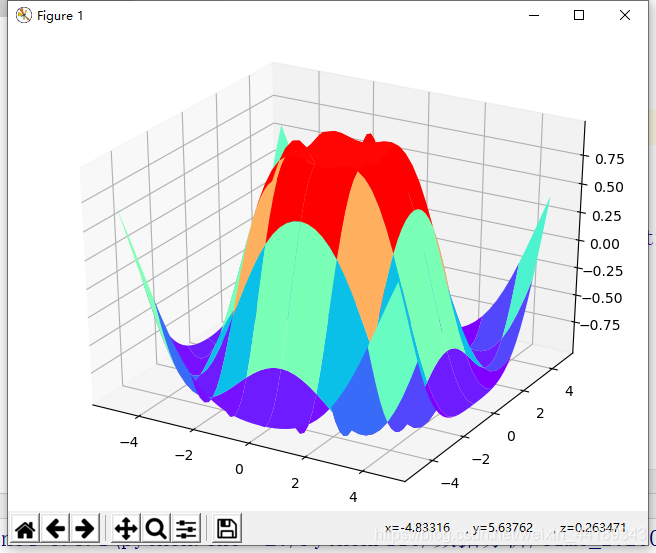
 表面图:
表面图:
print("表面图")
fig = plt.figure()
ax = Axes3D(fig)

arr1 = np.array([1,2,3])
arr2 = np.array([4,5])
np.meshgrid(arr1,arr2)  #(1,5) (2,5) (3,5) (1.4) (2.4) (3,4)
print(np.meshgrid(arr1,arr2))

x = np.arange(-5,5,0.25)
y = np.arange(-5,5,0.25)
x,y = np.meshgrid(x,y)
r = np.sqrt(x**2+y**2)
z = np.sin(r)
ax.plot_surface(x,y,z,rstride=5,cstride=5,cmap="rainbow") #cmap是颜色
plt.show()
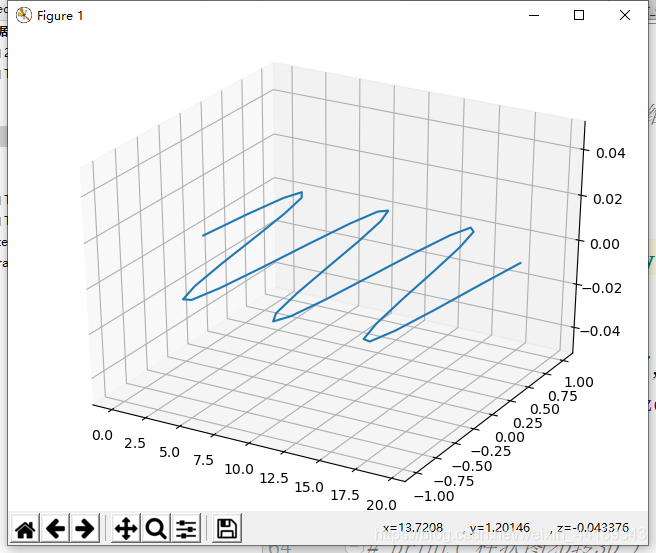
 将一个2D图变成3D:
print("2D图画在3D图上")
fig = plt.figure()
ax = Axes3D(fig)

x = np.arange(0,20,0.5)
y = np.sin(x)
# !!!! plt.画图函数(二维),ax.画图函数(三维)
plt.plot(x,y)
plt.show()

ax.plot(x,y,zs=0,zdir="y",color="orange")  #zdir:把某个轴的值变成z轴
plt.show()

for c,z in zip(["r","y","b","g"],[30,20,10,0]):
    ax.plot(x,y,zs = z,zdir="y" ,color=c)
plt.show()
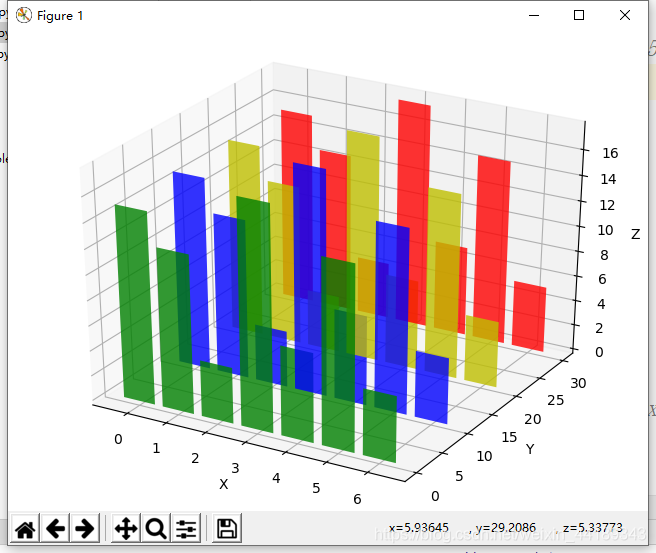
print("柱状图2D转3D")
fig = plt.figure()
ax = Axes3D(fig)
x = np.arange(0,7)
y = np.random.uniform(2,20,7)
for c,z in zip(["r","y","b","g"],[30,20,10,0]):
    ax.bar(x,y,z,zdir="y",color=c,alpha=0.8)
plt.xlabel("X")
plt.ylabel("Y")
ax.set_zlabel("Z")
plt.show()
 用matplotlib画动态图:
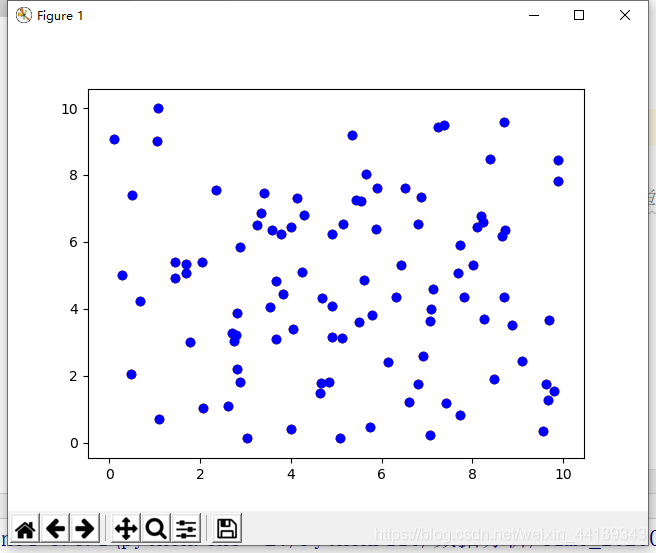
print("用matplotlib画动态图")
plt.ion()
plt.show()
x = np.random.uniform(0,10,100)
y = np.random.uniform(0,10,100)
for c in ["r","y","b","g"]:
    plt.scatter(x,y,color=c)
    plt.pause(1)  #表示时间间隔,单位是秒
plt.ioff()
plt.show()
 友情链接:http://dublogger.cn/
