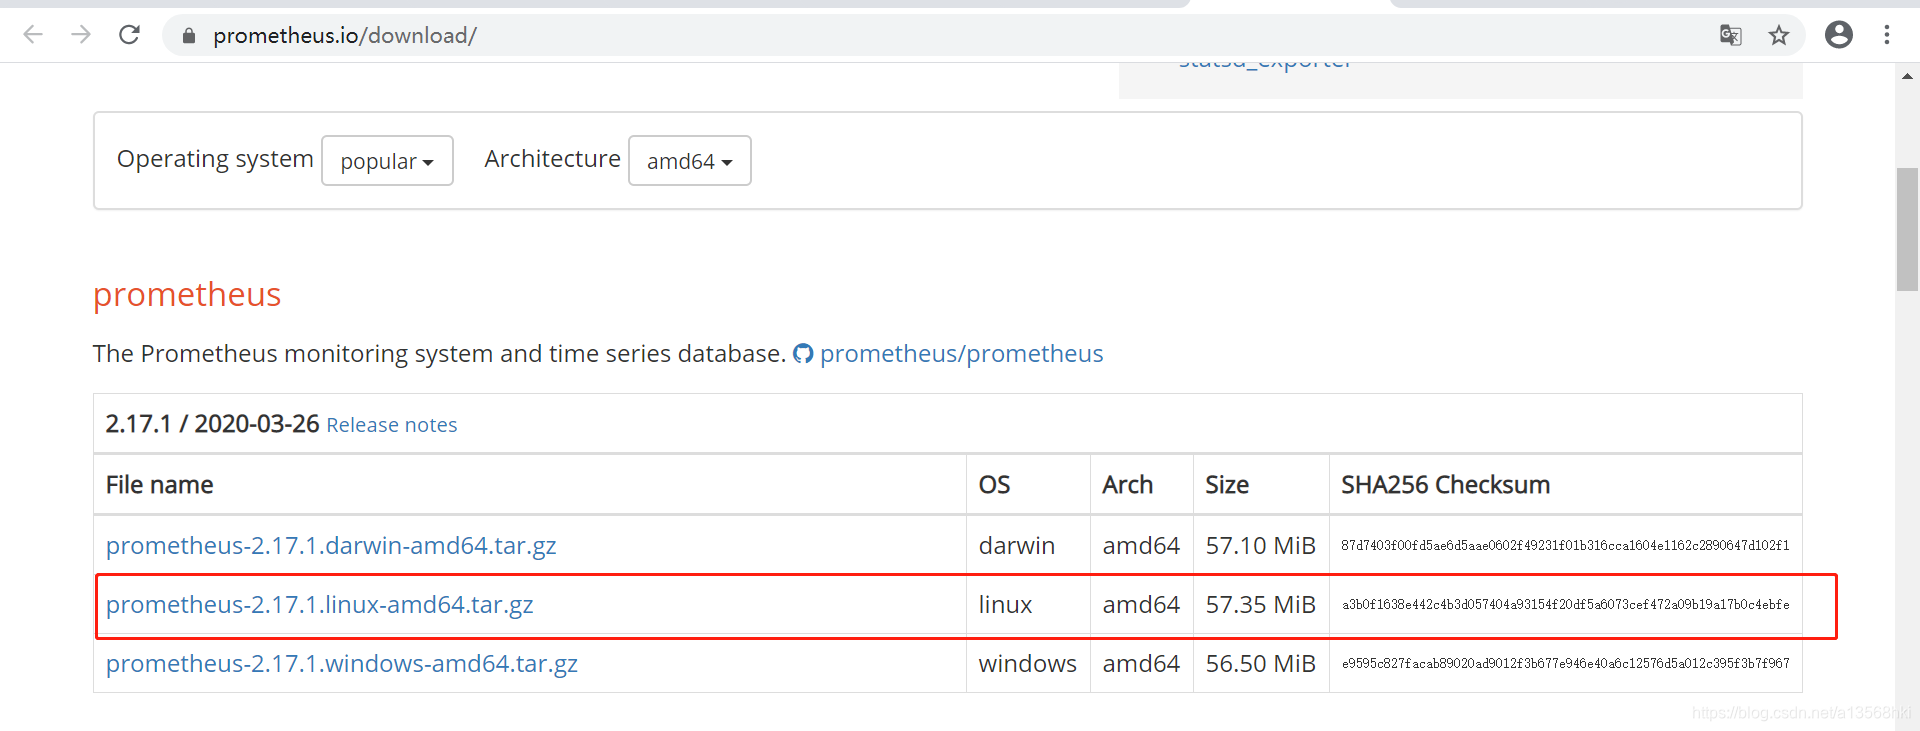
官方下载地址:https://prometheus.io/download/
1、下载Prometheus的tar包
wget https://github.com/prometheus/prometheus/releases/download/v2.17.1/prometheus-2.17.1.linux-amd64.tar.gz
tar -C /usr/local/ -xvf prometheus-2.17.1.linux-amd64.tar.gz  #解压
ln -sv /usr/local/prometheus-2.17.1.linux-amd64/ /usr/local/prometheus   #创造软连接
/usr/local/prometheus/prometheus --config.file=/usr/local/prometheus/prometheus.yml & #启动Prometheus
2、测试
ss -anpt|grep 9090

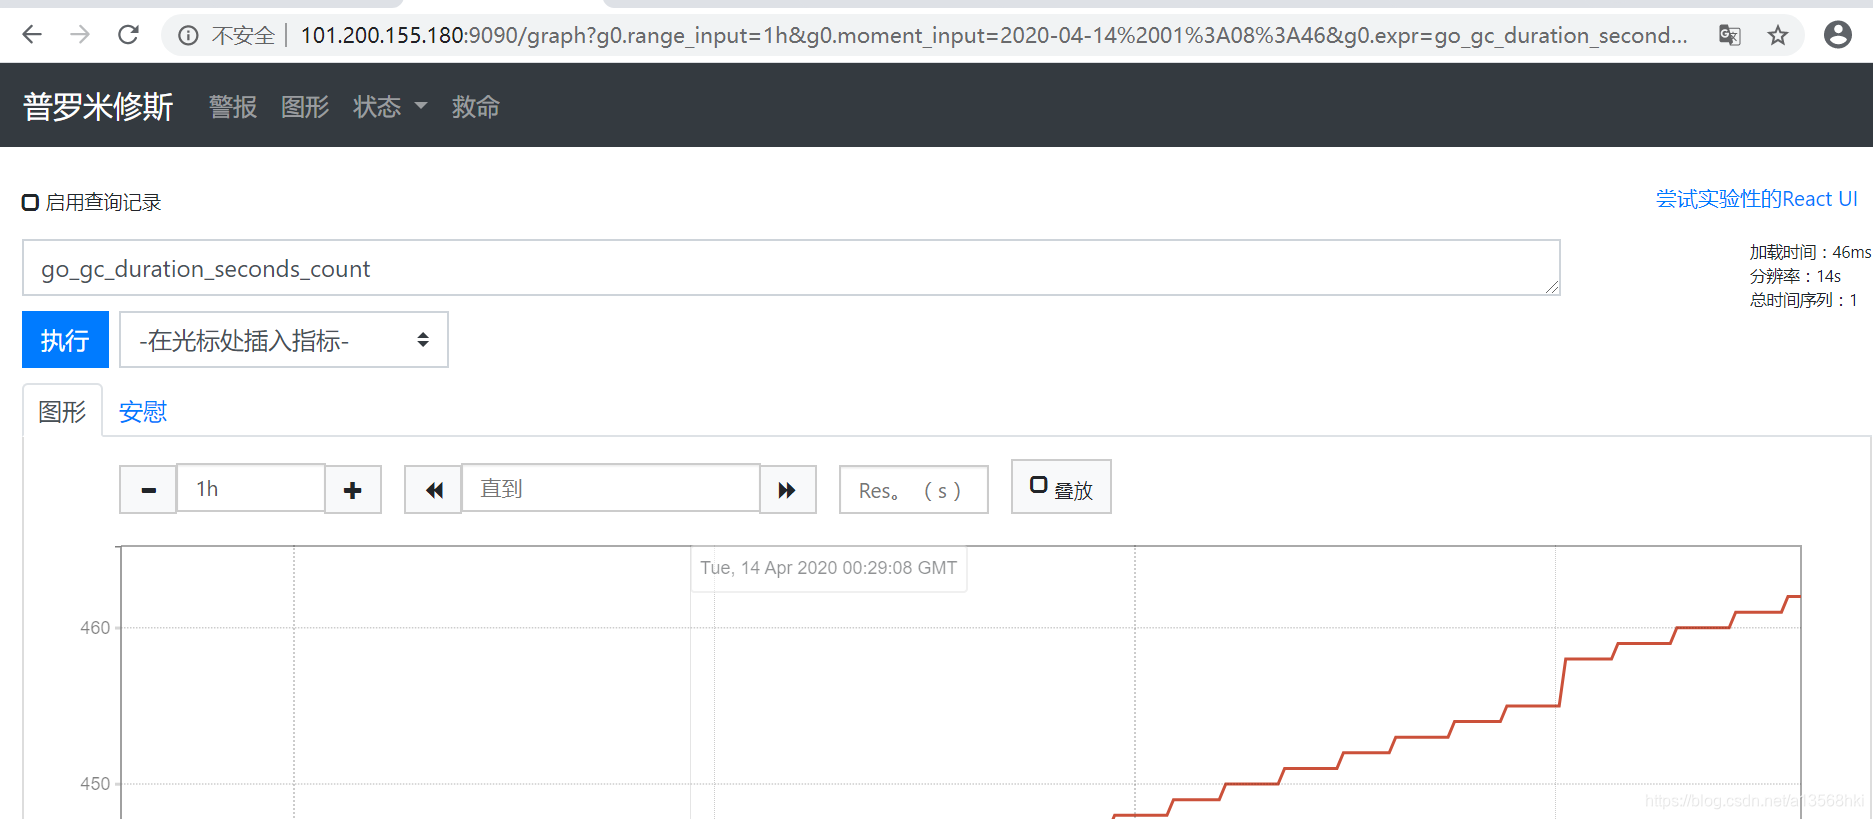
http://服务IP:9090
3、配置prometheus.yml的介绍
# my global config
global:
  scrape_interval:     15s # Set the scrape interval to every 15 seconds. Default is every 1 minute.
  evaluation_interval: 15s # Evaluate rules every 15 seconds. The default is every 1 minute.
  # scrape_timeout is set to the global default (10s).

# Alertmanager configuration
alerting:
  alertmanagers:
  - static_configs:
    - targets:
      # - alertmanager:9093

# Load rules once and periodically evaluate them according to the global 'evaluation_interval'.
rule_files:
  # - "first_rules.yml"
  # - "second_rules.yml"

# A scrape configuration containing exactly one endpoint to scrape:
# Here it's Prometheus itself.
scrape_configs:
  # The job name is added as a label `job=<job_name>` to any timeseries scraped from this config.
 - job_name: 'prometheus'

    # metrics_path defaults to '/metrics'
    # scheme defaults to 'http'.

    static_configs:
    - targets: ['localhost:9090']
-
global:全局配置,其中scrape_interval表示抓取一次数据的间隔时间,
evaluation_interval表示进行告警规则检测的间隔时间; -
alerting:告警管理器(Alertmanager)的配置,目前还没有安装Alertmanager;
-
rule_files:告警规则有哪些;
-
scrape_configs:抓取监控信息的目标。一个job_name就是一个目标,其targets就是采集信息的IP和端口。这里默认监控了Prometheus自己,可以通过修改这里来修改Prometheus的监控端口。Prometheus的每个exporter都会是一个目标,它们可以上报不同的监控信息,比如机器状态,或者mysql性能等等,不同语言sdk也会是一个目标,它们会上报你自定义的业务监控信息。
4、添加机器状态监控
我们尝试添加第一个监控exporter——监控当前机器自身的状态,包括硬盘、CPU、流量等。因为Prometheus已经有了很多现成的常用exporter,所以我们直接用其中的node_exporter。注意了,这里名字虽然叫node_exporter,但跟nodejs没有任何关系,在Prometheus看来,一台机器或者说一个节点就是一个node,所以该exporter是在上报当前节点的状态。
node_exporter本身也是一个http服务,可以供prometheus server调用(pull)来获取监控的信息,安装方法同样是下载安装包后解压直接运行:
#下载最新版本,可以在github的release中对最新版本右键获取下载链接
wget https://github.com/prometheus/node_exporter/releases/download/v1.0.0-rc.0/node_exporter-1.0.0-rc.0.linux-amd64.tar.gz
#解压
tar xvf node_exporter-1.0.0-rc.0.linux-amd64.tar.gz -C /usr/local/
#进入解压出的目录
cd /usr/local/node_exporter-1.0.0-rc.0.linux-amd64/
#运行监控采集服务
nohup ./node_exporter &
运行后可以看到在监听9100端口。这样就可以采集了,现在先访问试试能不能有没有成功运行:
curl http://localhost:9100/metrics

这里也可以看出其实每个exporter本身都是一个http服务,server端会定时来访问获取监控信息。
访问成功的话,我们去prometheus的配置文件(prometheus.yml)中,加上这个target:
scrape_configs:
  - job_name: 'prometheus'
    static_configs:
      - targets: ['localhost:9090']
  - job_name: 'server'   #主要是以下三行
    static_configs:
      - targets: ['localhost:9100']
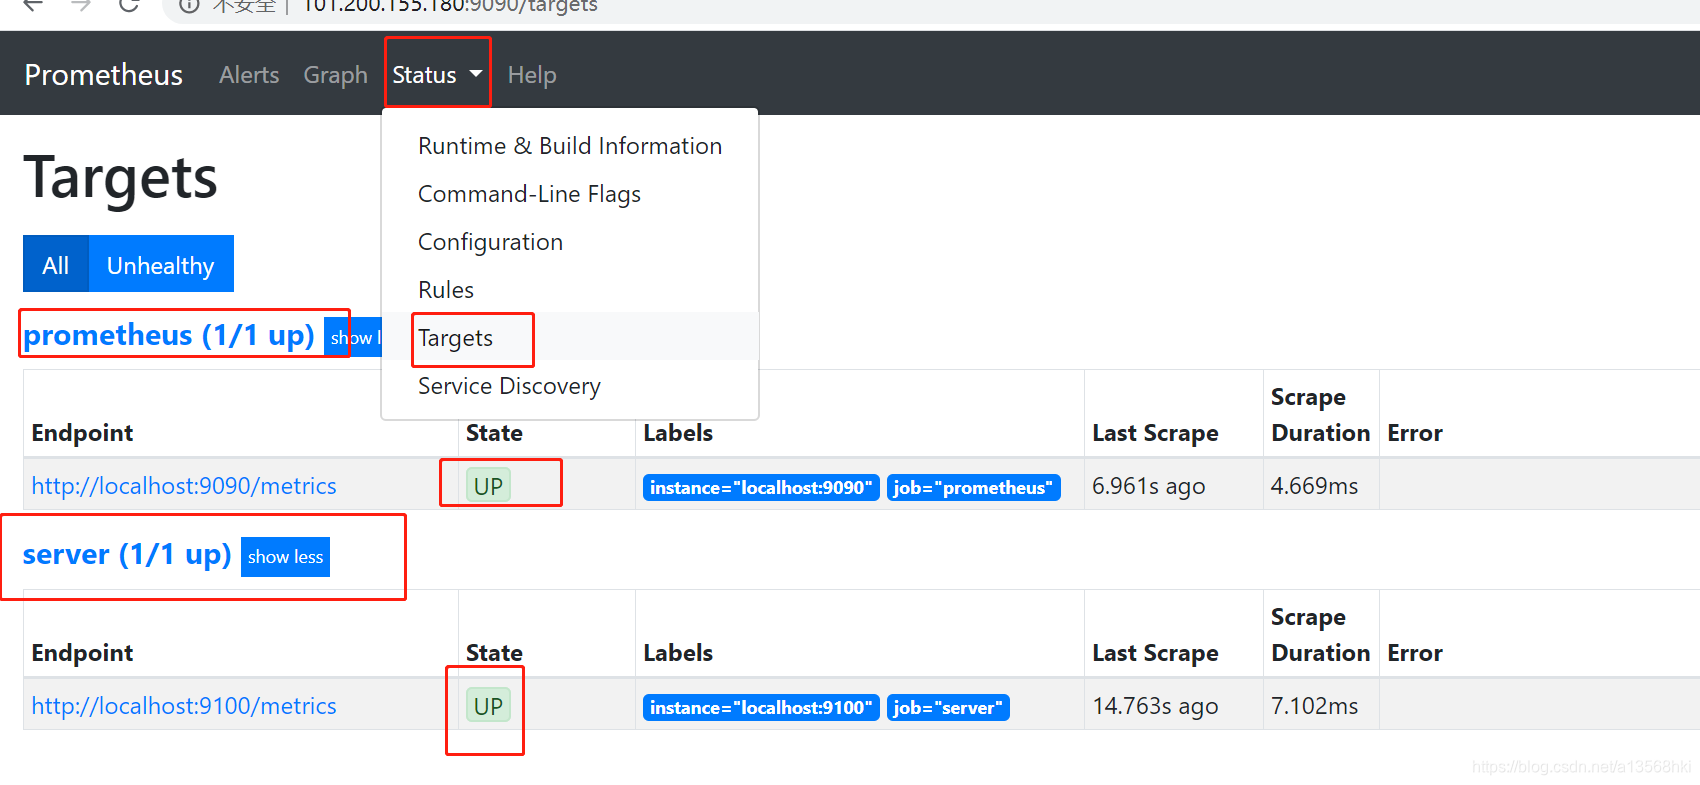
可以看到,就是在scrape_configs模块中加一个job,命好名,配置好监听的IP和端口即可,然后重新运行prometheus,在标签栏的 Status --> Targets 中可以看到多了一个:
5、安装Grafana
Grafana是一个可视化面板(Dashboard),有着非常漂亮的图表和布局展示,功能齐全的度量仪表盘和图形编辑器,支持Graphite、zabbix、InfluxDB、Prometheus等数据源。
5.1 下载并安装
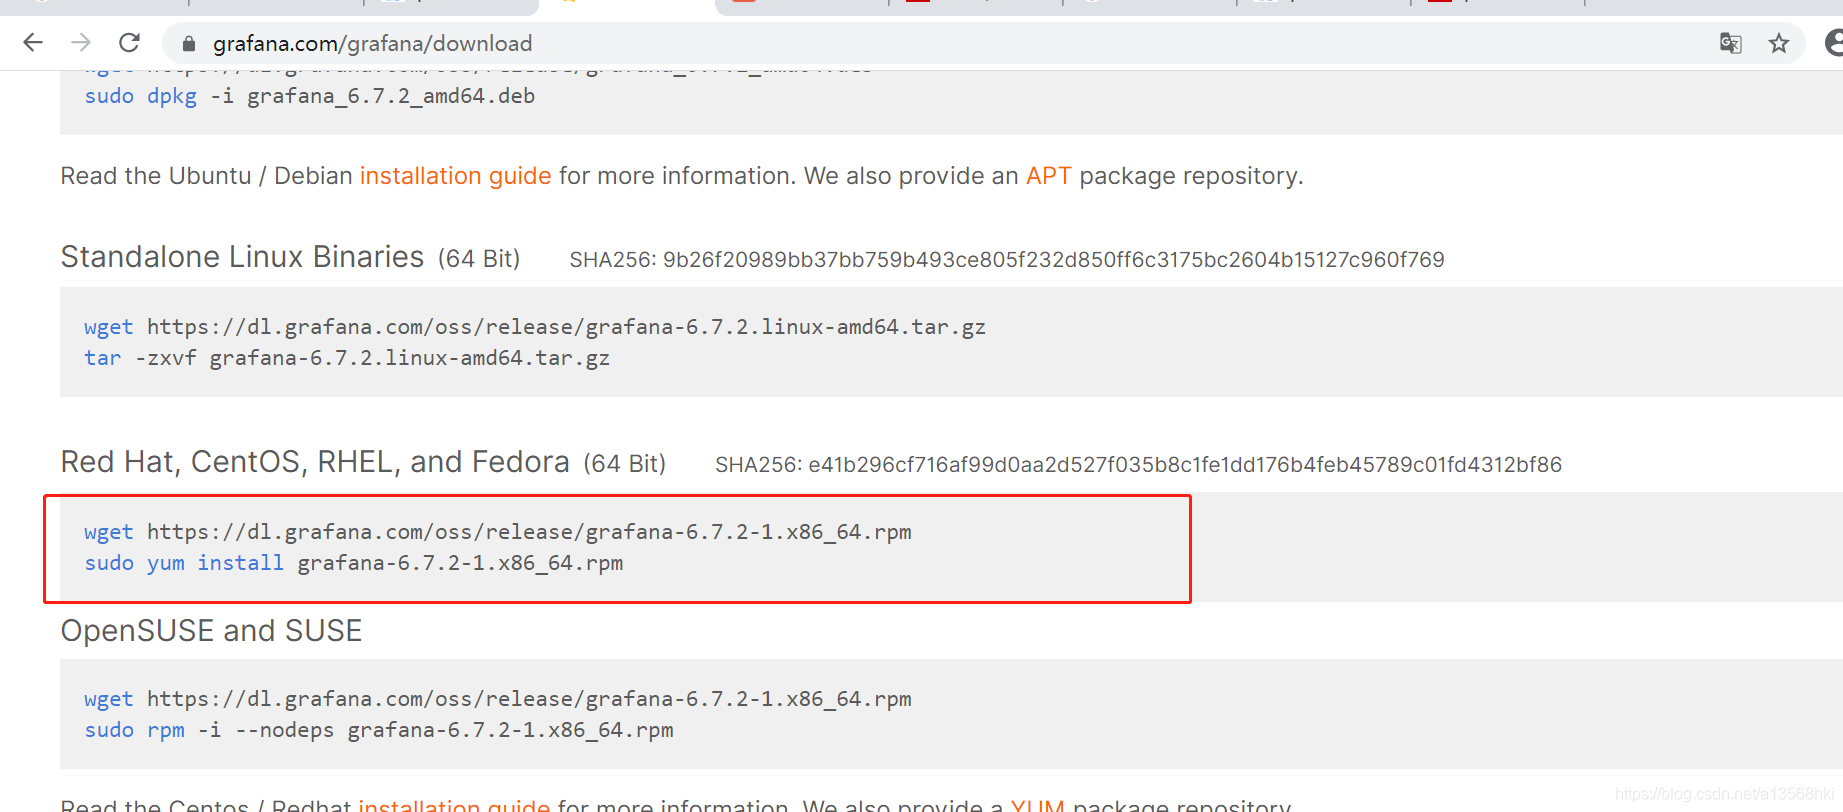
下载地址:https://grafana.com/grafana/download
运行如下脚本
wget https://dl.grafana.com/oss/release/grafana-6.7.2-1.x86_64.rpm
sudo yum install grafana-6.7.2-1.x86_64.rpm
5.2 安装完成后,grafana服务默认已安装,配置文件为/etc/grafana/grafana.ini,如需修改路径及端口,可在该文件中修改

启动grafana
/etc/init.d/grafana-server start
5.3 登录grafana

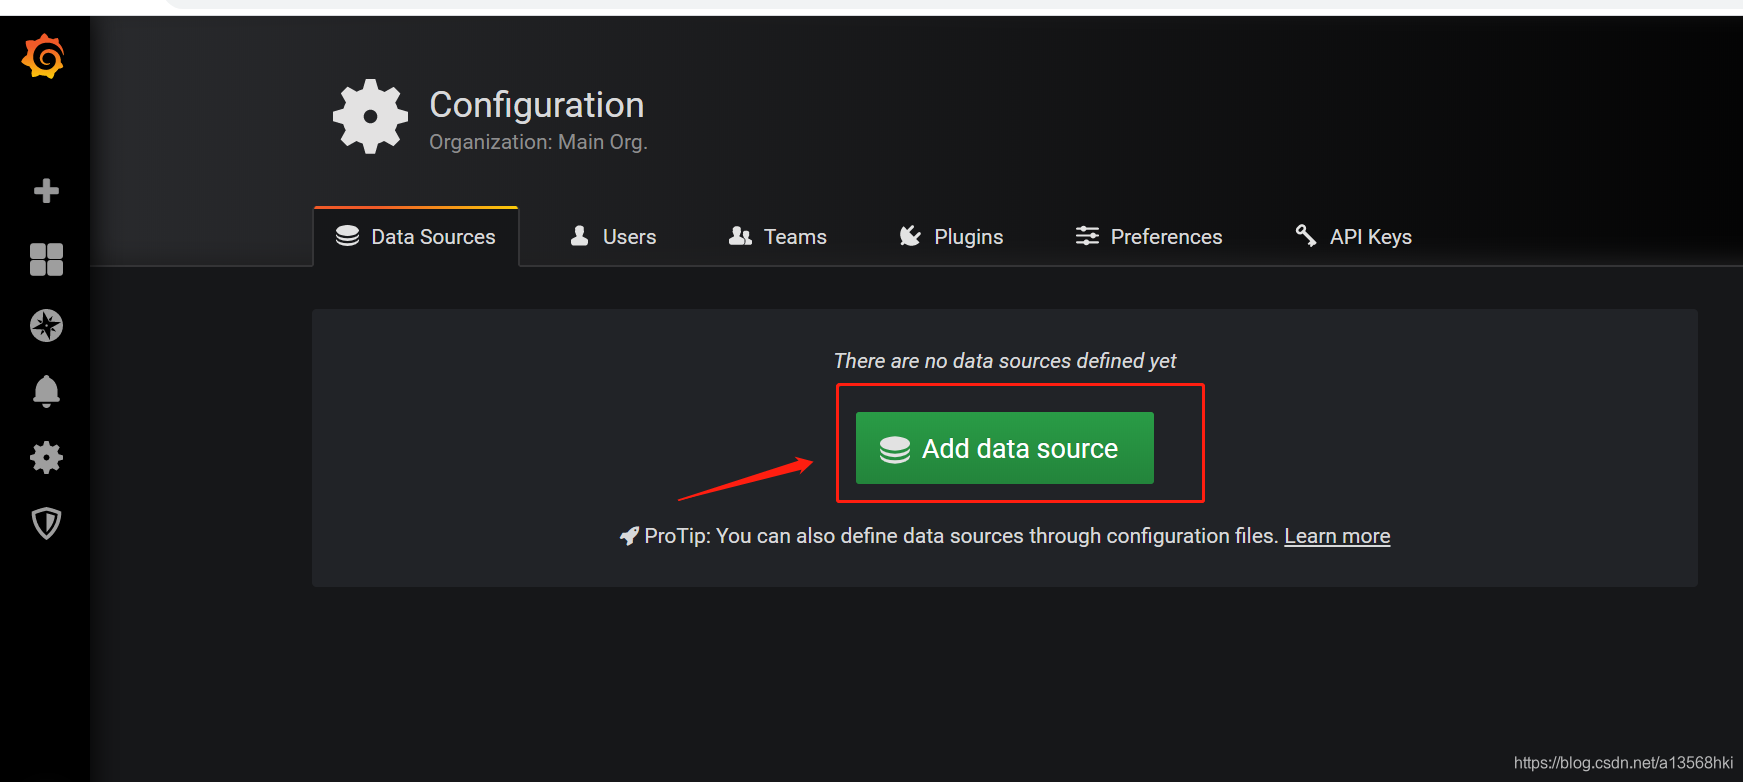
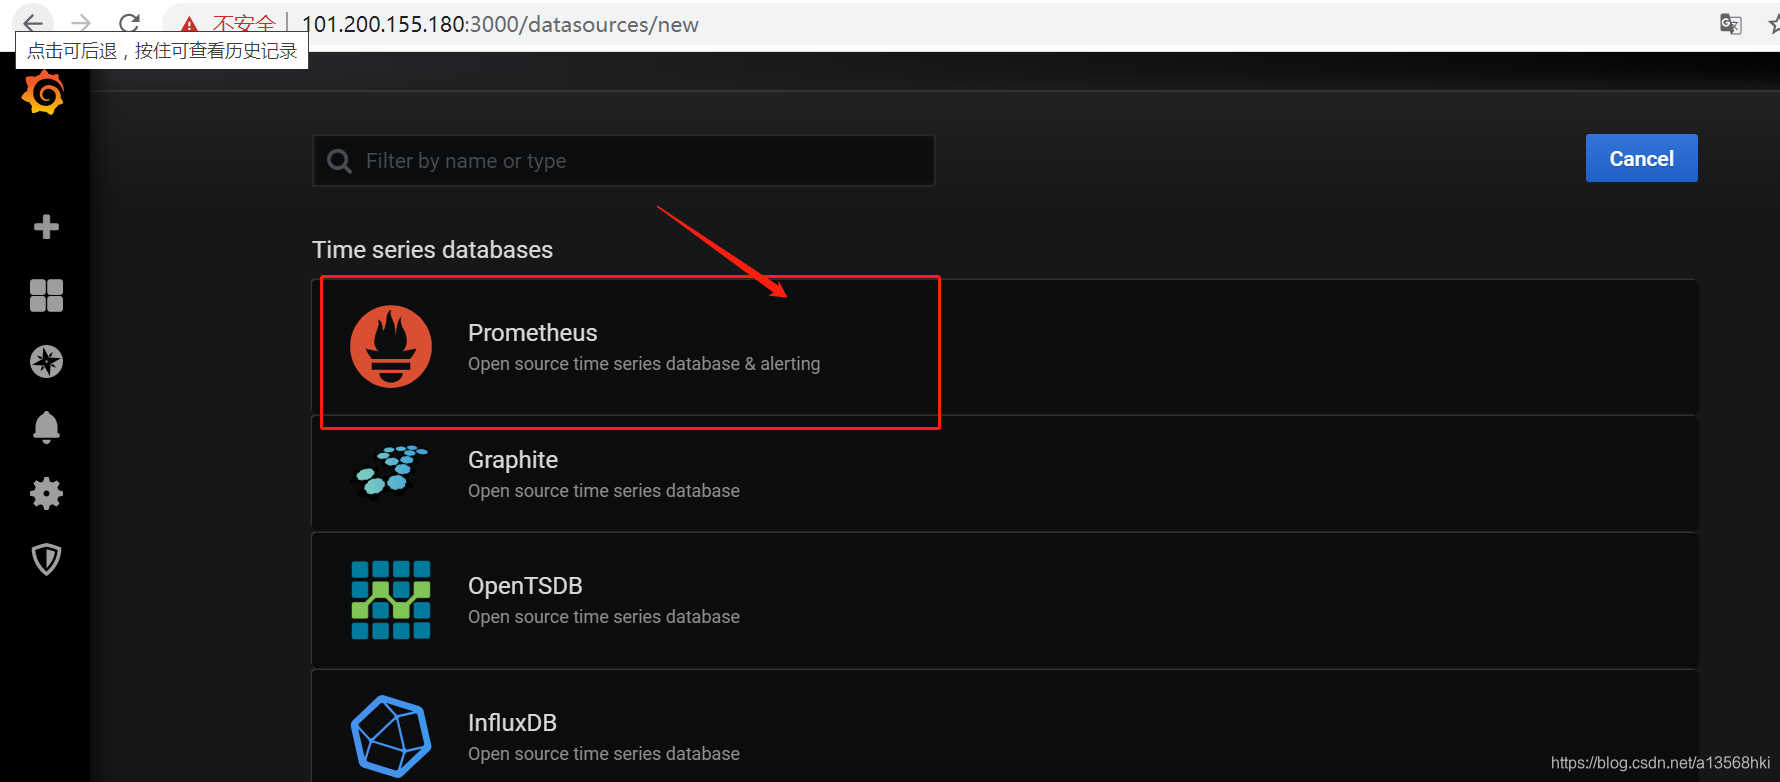
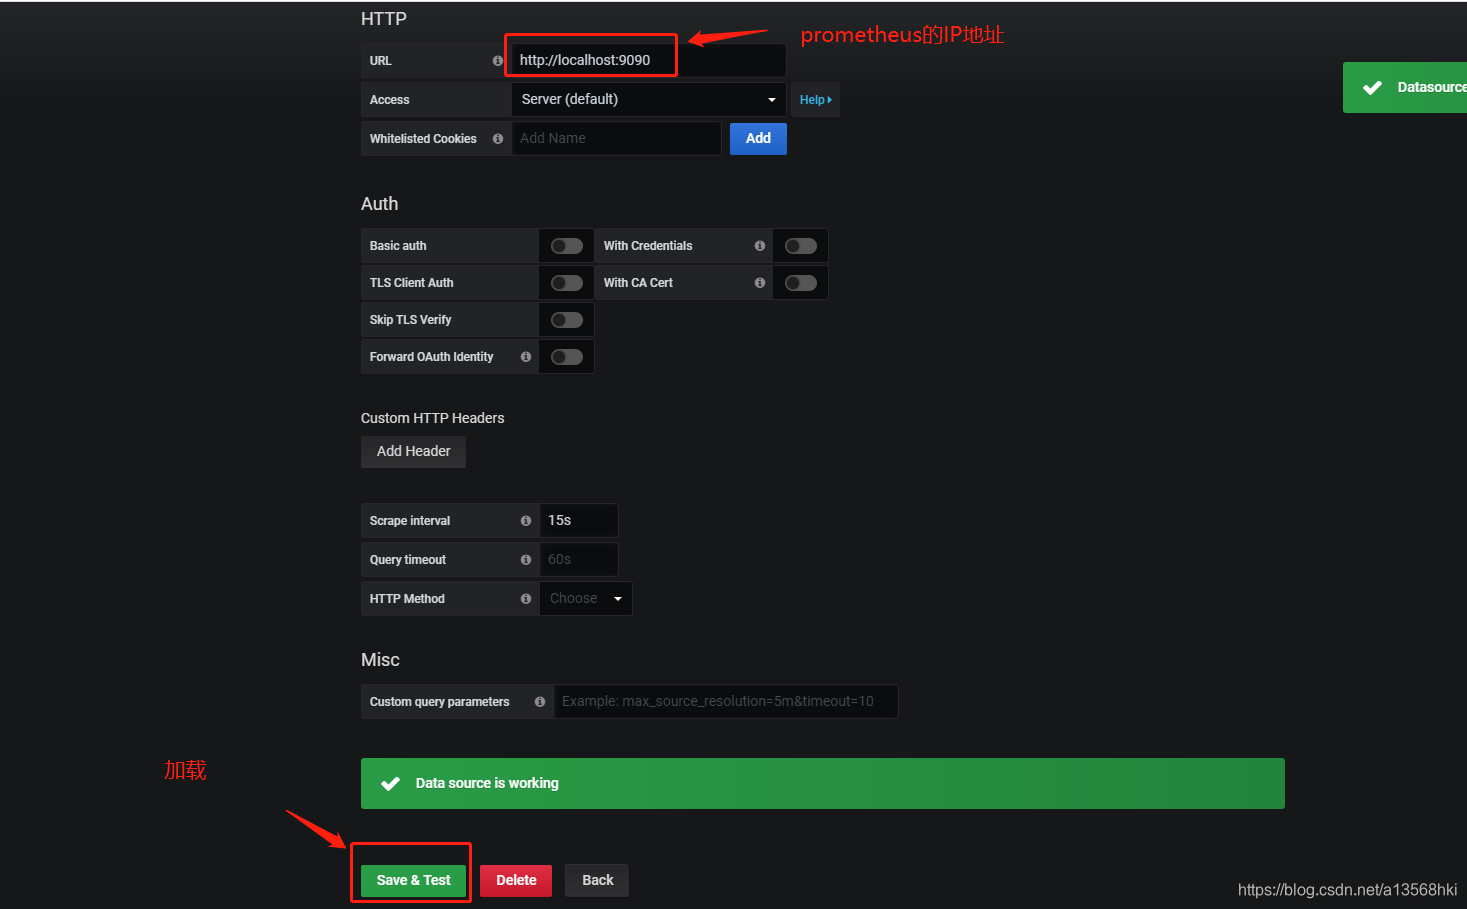
5.4 导入数据源

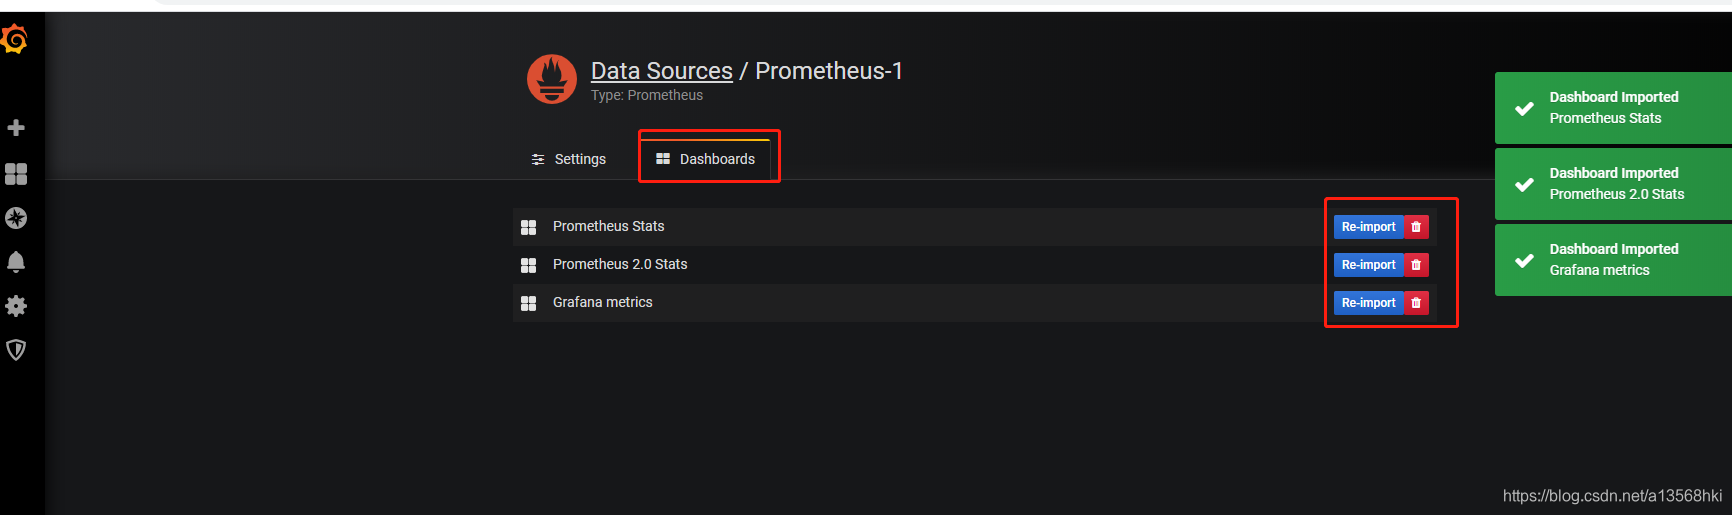
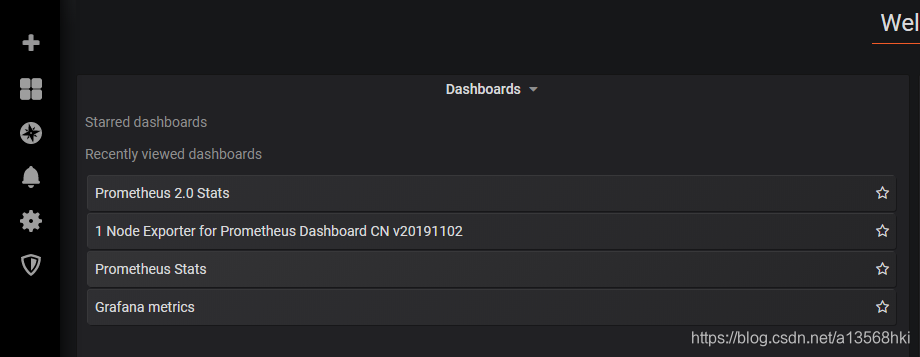
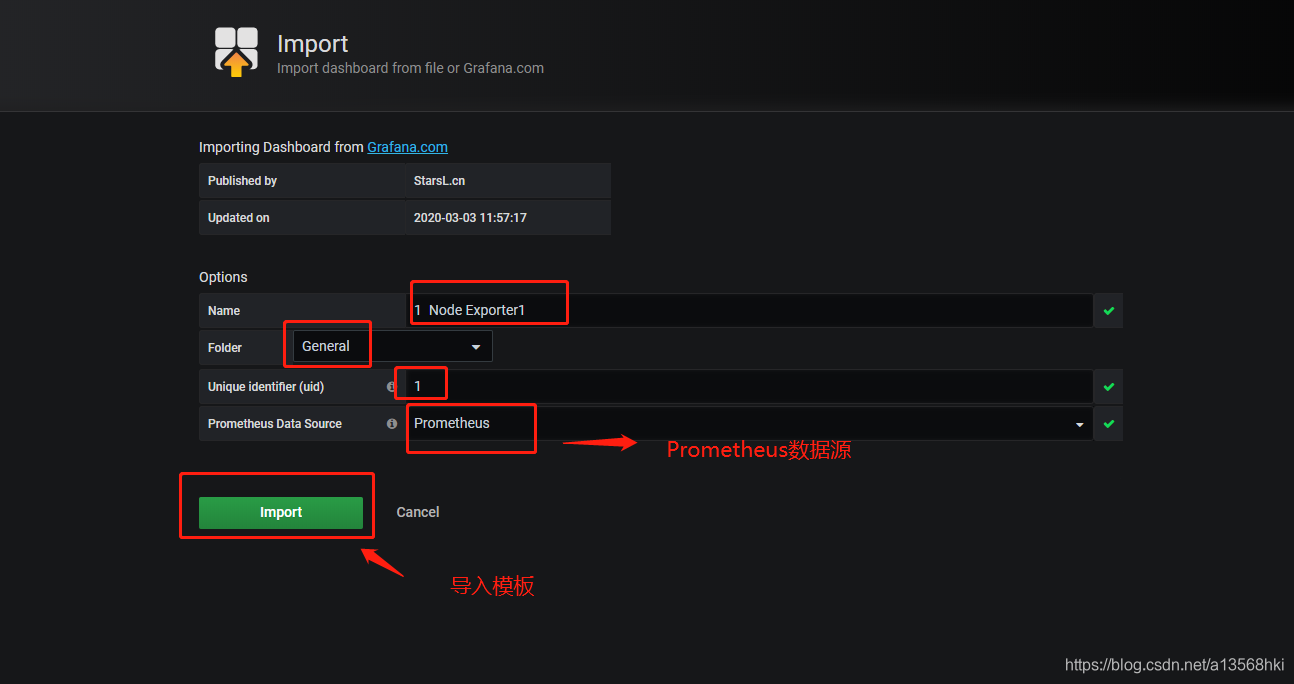
5.5 添加监控模板
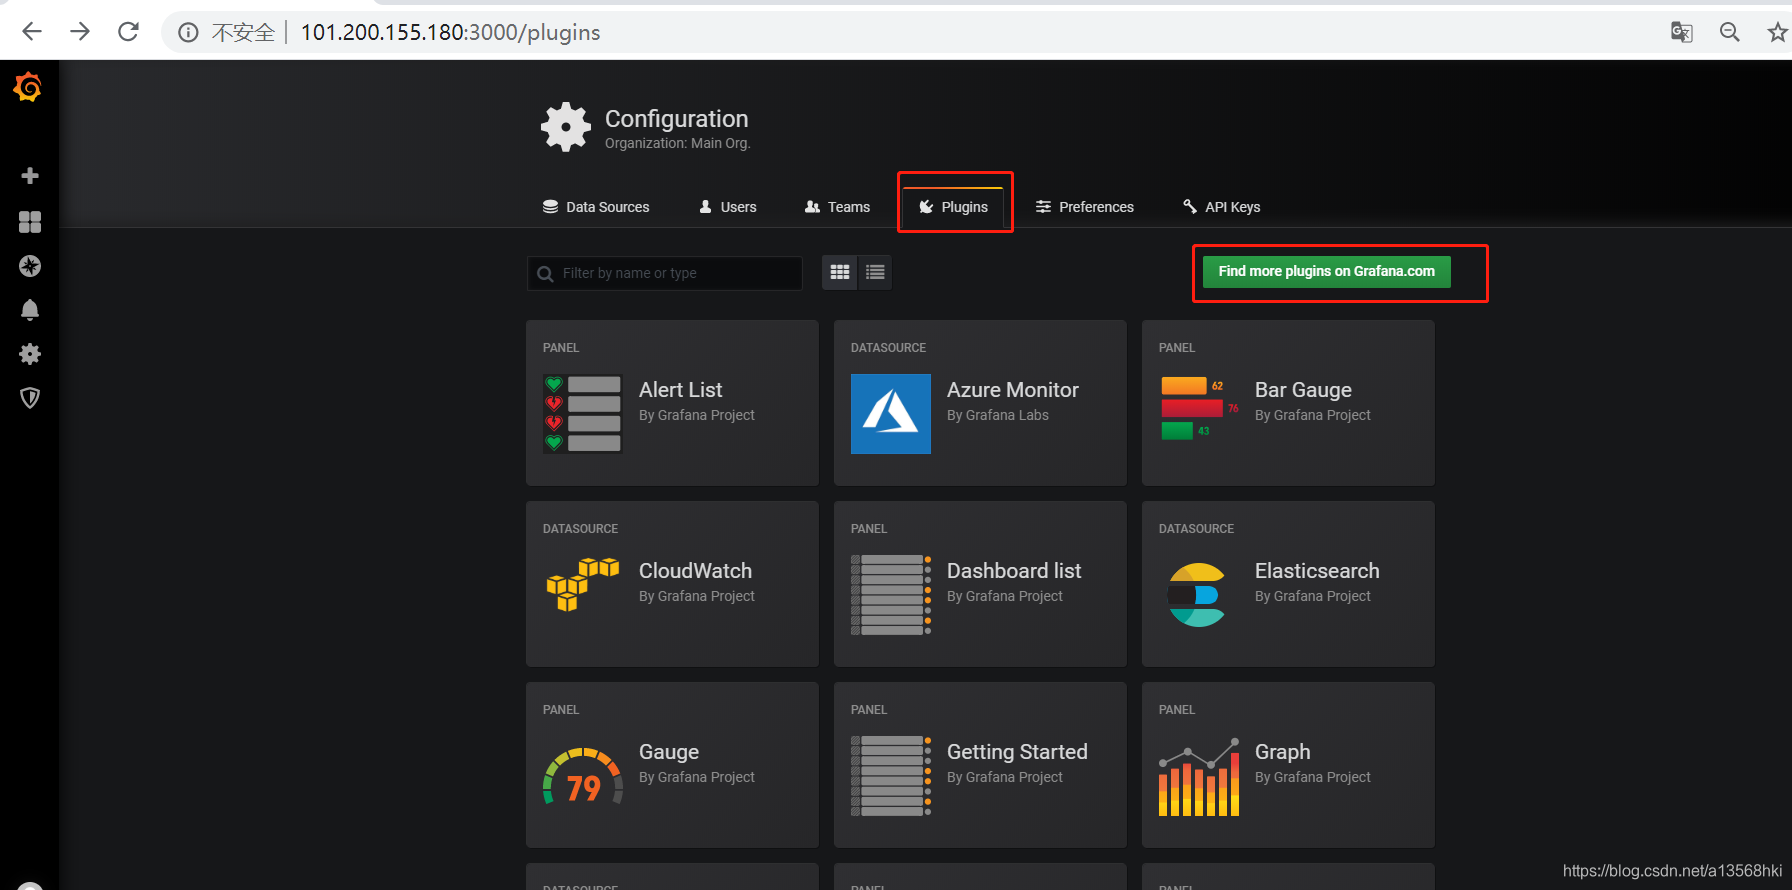
还记得我们上面还运行了一个node exporter吧,现在我们展现一下这个监控信息,左边竖排点击加号图标中的Import,来导入其他别人写好的面板。在Grafana的官方面板页面其实可以看到很多别人配置好的面板,我们找到自己想要的面板,比如这个node exporter的:
官方模板:https://grafana.com/grafana/dashboards?orderBy=name&direction=asc
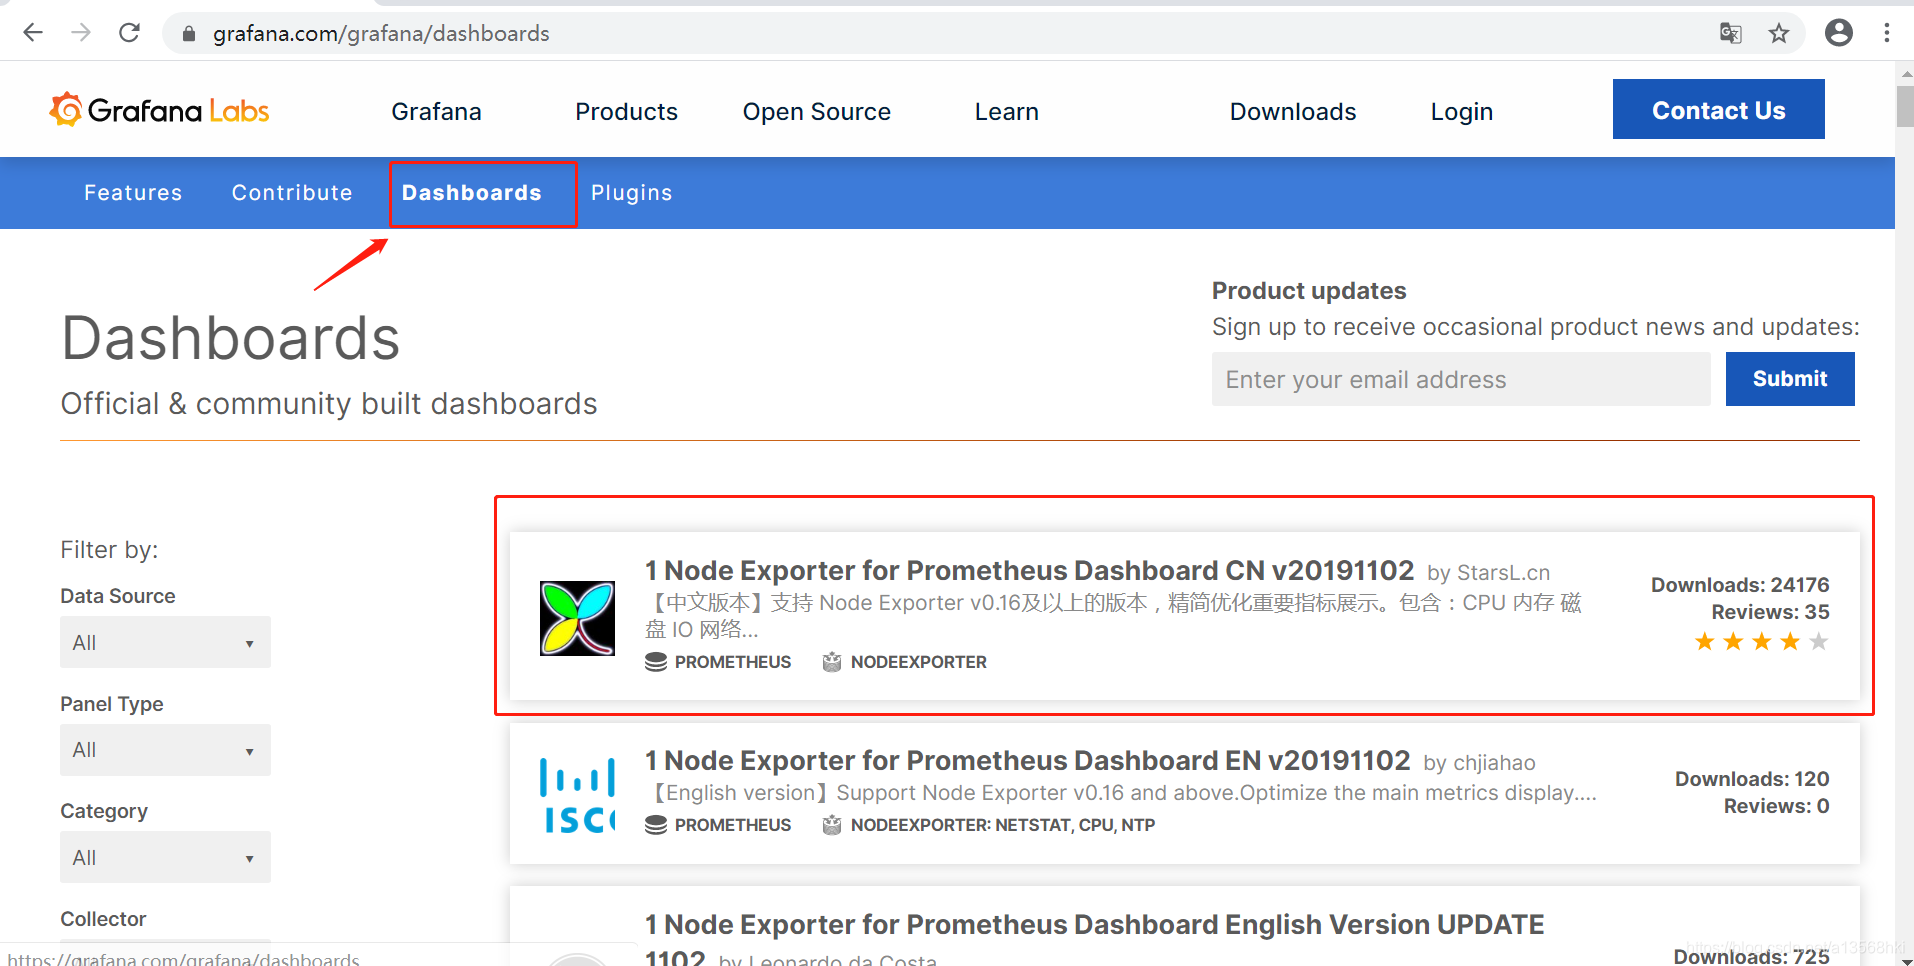
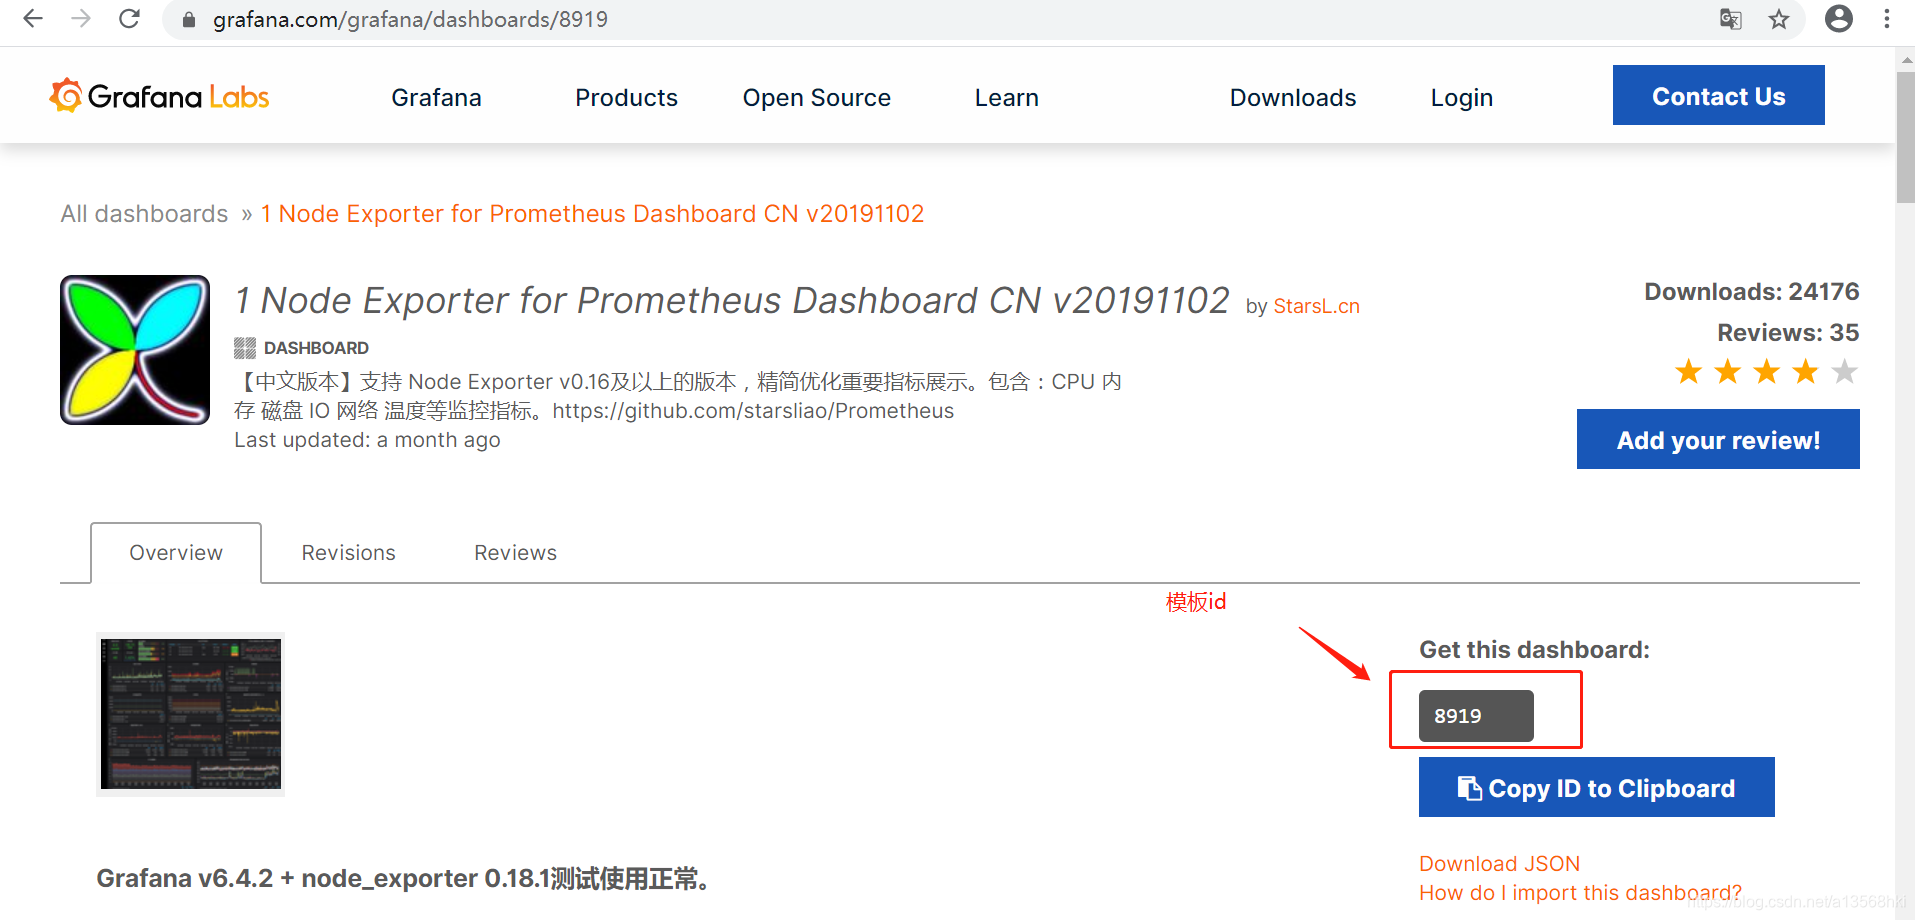
复制右边那个面板ID,然后在Import界面输入ID,Load后配置好数据源为我们的Prometheus,就可以出现我们自己机器的状态监控面板了,很炫酷吧。

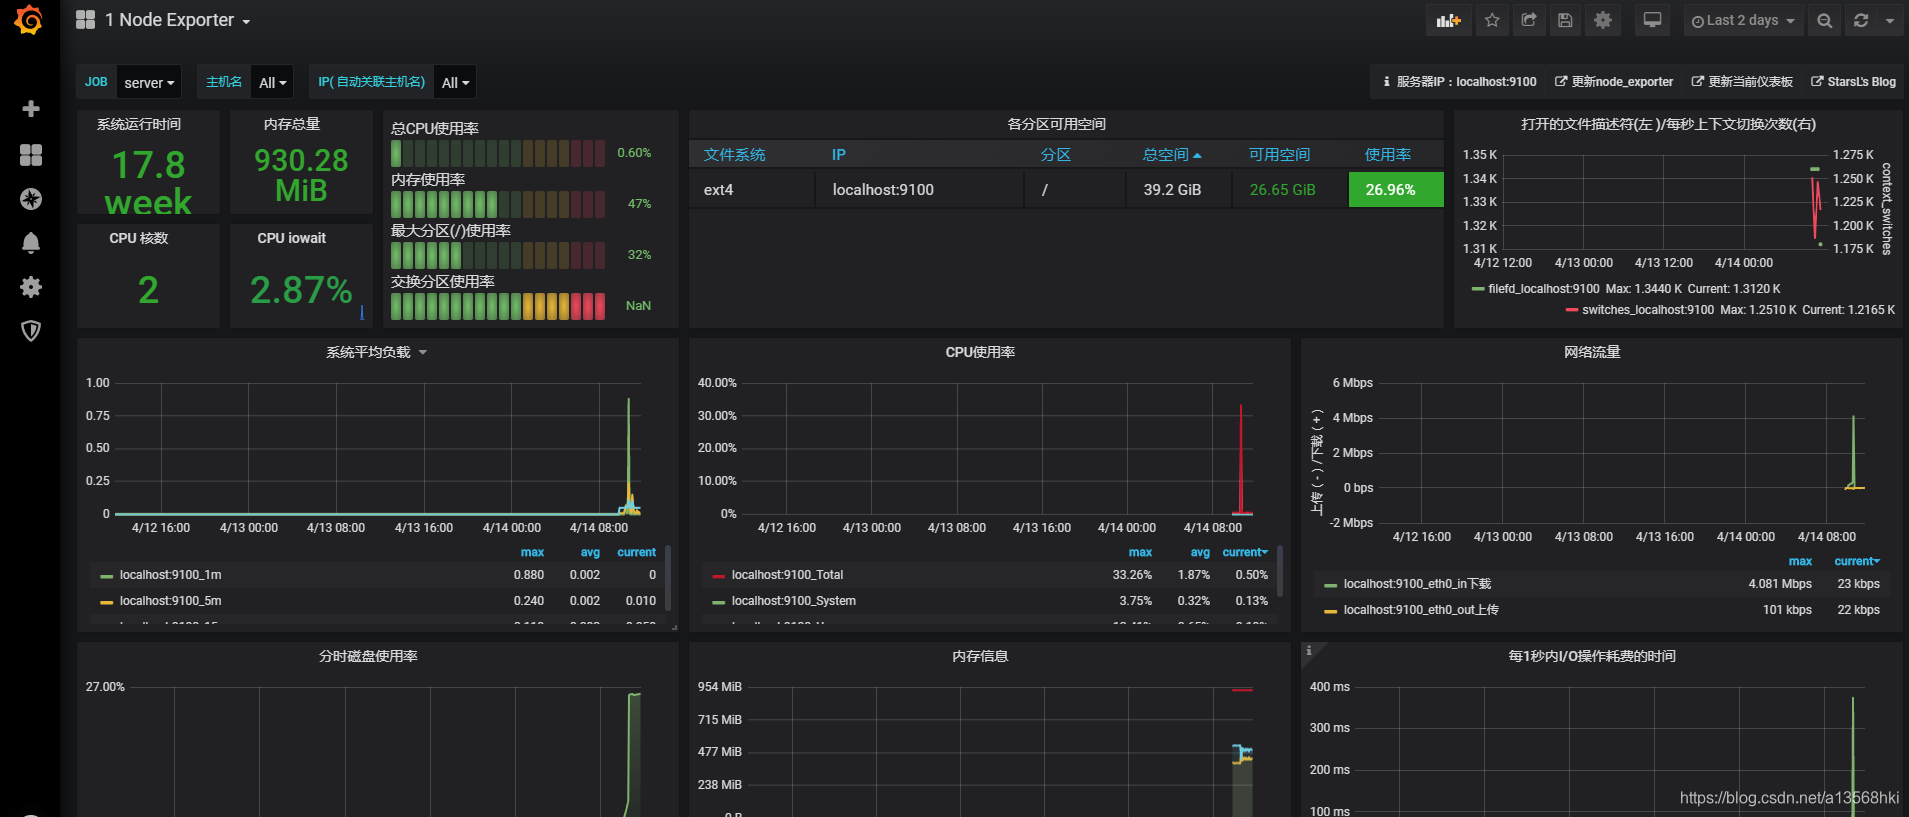
成功
