1. 背景
用prometheus+pushgateway+grafana监控体系对flink的各项metrics进行监控,出现如下图所示状况:
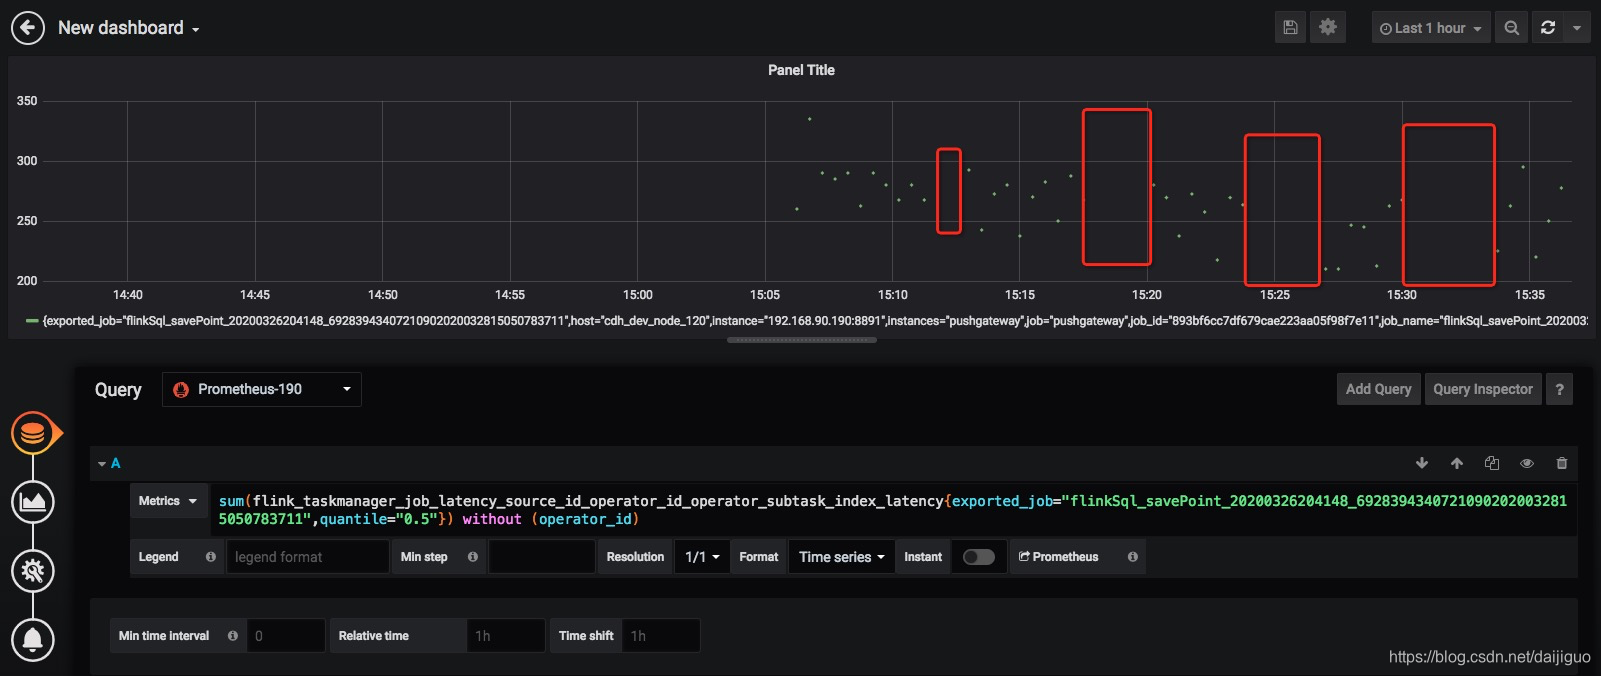
可以发现,指标每过一些时间就会消失,然后又出现。
2. 问题分析
2.1 实验设计
存在三种可能,1:prometheus有bug导致拉不到数据;2:pushgateway有bug导致接收不到flink的数据;3:flink本身有bug,隔一段时间就不发数据。根据猜测,设计了如下排查方法。
第一步,在flink-conf.yaml中配置JMXReporter+PrometheusPushGatewayReporter,如果JMXReporter的数据也会中断,则是flink本身的问题;如果JMXReporter的数据不中断,PrometheusPushGatewayReporter的数据中断,则可能是pushgateway或prometheus的问题;
配置:
metrics.reporters: jmx, prom

metrics.latency.interval: 2000
metrics.reporter.promgateway.class: org.apache.flink.metrics.prometheus.PrometheusPushGatewayReporter
# 这里写PushGateway的主机名与端口号
metrics.reporter.promgateway.host: 192.168.90.88
metrics.reporter.promgateway.port: 8891
# Flink metric在前端展示的标签(前缀)与随机后缀
metrics.reporter.promgateway.randomJobNameSuffix: false
metrics.reporter.promgateway.deleteOnShutdown: false
# 设置PushGateway reporter的消息上报间隔
metrics.reporter.promgateway.interval: 5 SECONDS

metrics.reporter.jmx.class: org.apache.flink.metrics.jmx.JMXReporter
metrics.reporter.jmx.port: 8961
metrics.delimiter: .
env.java.opts: -Dcom.sun.management.jmxremote -Dcom.sun.management.jmxremote.port=9998 -Dcom.sun.management.jmxremote.authenticate=false -Dcom.sun.management.jmxremote.ssl=false
结果:
| JMXReporter | PrometheusPushGatewayReporter |
|---|---|
| 不中断 | 中断 |
第二步:在flink-conf.yaml中配置JMXReporter+PrometheusReporter,如果JMXReporter的数据也会中断,则是flink本身的问题;如果JMXReporter的数据不中断,PrometheusReporter的数据中断,则是prometheus的问题;
配置:
metrics.reporters: jmx, prom
metrics.reporter.jmx.class: org.apache.flink.metrics.jmx.JMXReporter
metrics.reporter.jmx.port: 8961
metrics.delimiter: .
env.java.opts: -Dcom.sun.management.jmxremote -Dcom.sun.management.jmxremote.port=9998 -Dcom.sun.management.jmxremote.authenticate=false -Dcom.sun.management.jmxremote.ssl=false

metrics.reporter.prom.class: org.apache.flink.metrics.prometheus.PrometheusReporter
metrics.reporter.prom.port: 9999
结果:
| JMXReporter | PrometheusReporter |
|---|---|
| 不中断 | 不中断 |
其中,三种reporter的数据分别用prometheus、pushgateway、jconsole去查看。根据两次实验结果,将问题初步锁定到pushgateway。
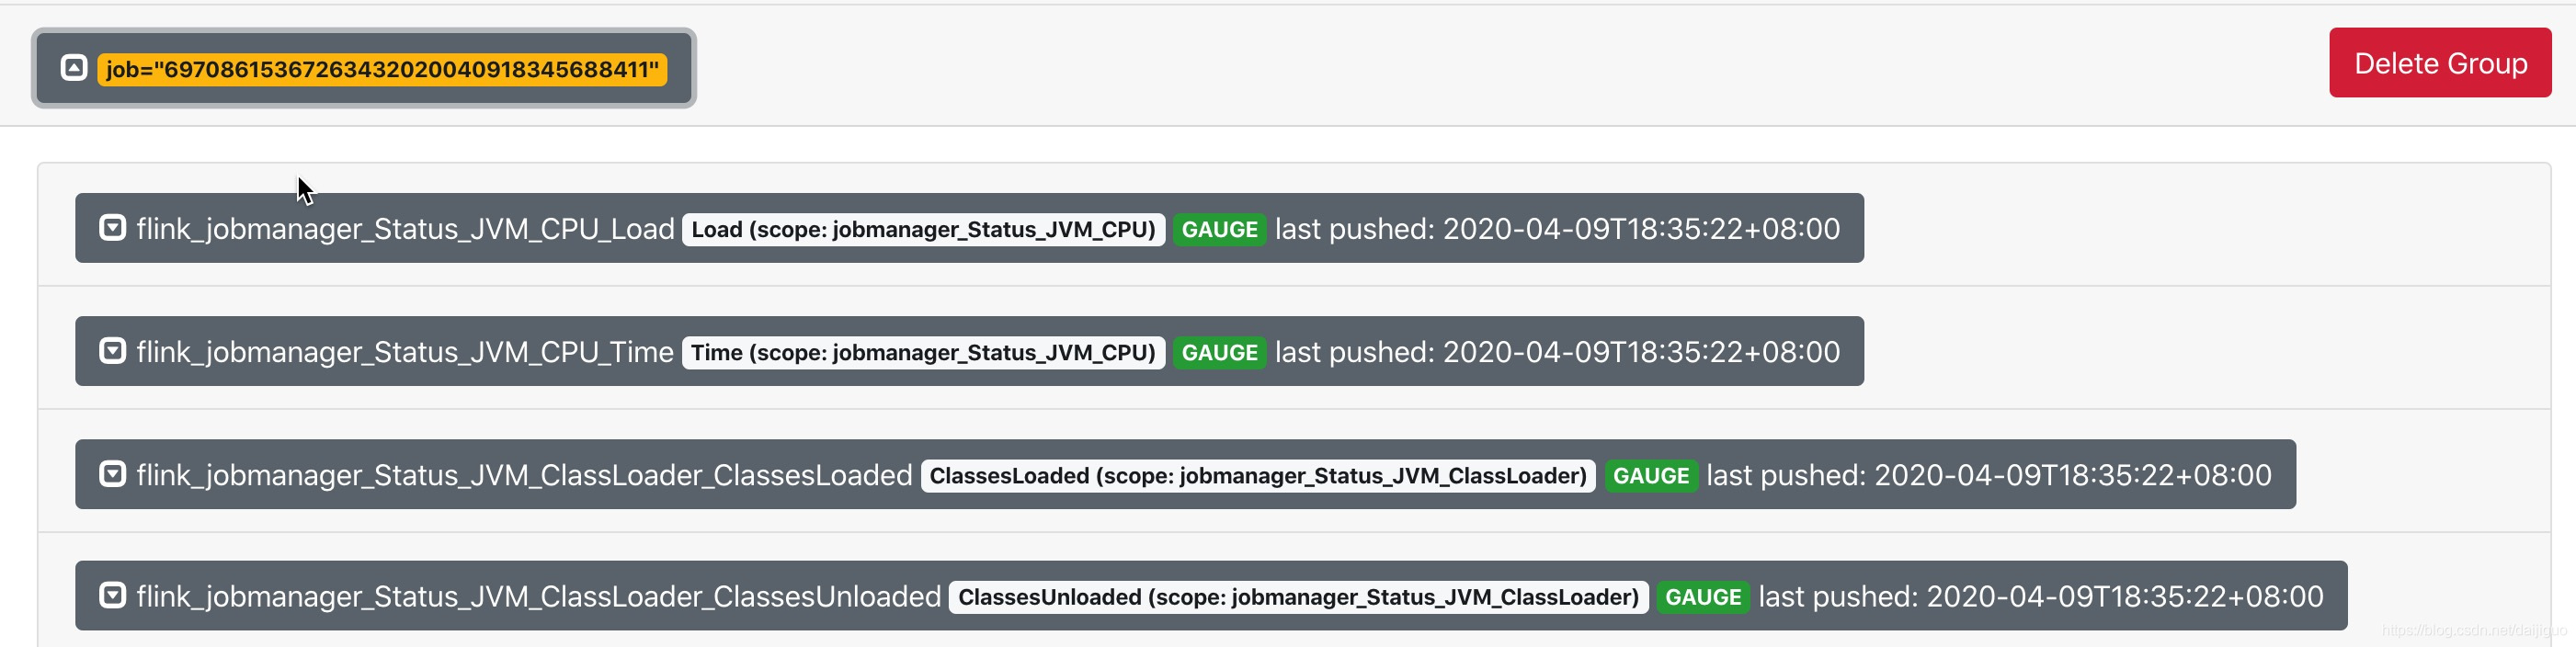
另外,实验中发现了一处奇怪的现象,虽然我们所用到的flink taskmanager metrics指标发生了中断,但是可以看到pushgateway中的flink jobmanager metrics都还在,且taskmanager metrics存在时,无法查到jobmanager metrics,jobmanager metrics存在时,无法查到taskmanager metrics,两者虽然处于同一个group(pushgateway中的概念,与推送URL相关)下,但是貌似无法同时查到。

2.2 源码分析
仔细阅读pushgateway文档,发现其中有一处可疑的描述:
PUT method
PUT is used to push a group of metrics. All metrics with the grouping key specified in the URL are replaced by the metrics pushed with PUT.

POST method
POST works exactly like the PUT method but only metrics with the same name as the newly pushed metrics are replaced (among those with the same grouping key).
意即,如果以 group 为单位使用 PUT 方法往 pushgateway 发数据,新数据会全盘覆盖老数据,不管 metrics name是否相同;如果以 group 为单位使用 POST 方法往 pushgateway 发数据,则同一metrics name的新数据会覆盖老数据。每个 flink per job 任务的 jobmanager 和 taskmanager 两个进程会定期的report各自的指标到pushgateway,它们接收到的 metrics.reporter.promgateway.jobName 配置项(grouping key)是相同的,但是时间肯定是错开的,所以会产生实验中jobmanager metrics和taskmanager metrics交替出现的现象。很合理地猜测,当我们所需要的taskmanager metrics消失时,是因为jobmanager metrics使用了PUT的指标推送方式而将taskmanager metrics全盘覆盖了。
于是,我们进入到flink-metrics源码中,查找发送数据到pushgateway的逻辑:
public class PrometheusPushGatewayReporter extends AbstractPrometheusReporter implements Scheduled {
	// flink往pushgateway推送数据逻辑的入口
	@Override
	public void report() {
		try {
			pushGateway.push(CollectorRegistry.defaultRegistry, jobName, groupingKey);
		} catch (Exception e) {
			log.warn("Failed to push metrics to PushGateway with jobName {}, groupingKey {}.", jobName, groupingKey, e);
		}
	}
}

// pushgateway客户端
public class PushGateway {
	/**
	 * Pushes all metrics in a registry, replacing all those with the same job and grouping key.
	 * <p>
	 * This uses the PUT HTTP method.
	 */
	public void push(CollectorRegistry registry, String job, Map<String, String> groupingKey) throws IOException {
		doRequest(registry, job, groupingKey, "PUT");
	}

	/**
	 * Pushes all metrics in a registry, replacing only previously pushed metrics of the same name and job and no grouping key.
	 * <p>
	 * This uses the POST HTTP method.
	 */
	public void pushAdd(CollectorRegistry registry, String job) throws IOException {
		doRequest(registry, job, null, "POST");
	}
}
可见,PrometheusPushGatewayReporter确实默认使用了PUT方式向pushgateway推送数据,虽然都是向pushgateway同一group下发送metrics,但jobmanager和taskmanager由于分布在不同的机器上,两者发送metrics并非同步发送,会导致jobmanager metrics经常覆盖taskmanager metrics,进而导致prometheus中无法查到taskmanager的各项监控指标。
3. 解决方法
将PrometheusPushGatewayReporter#report方法中的pushgateway客户端方法改成pushAdd,然后重新打包flink-metrics模块。
参考:
https://github.com/prometheus/pushgateway/issues/308
https://github.com/prometheus/pushgateway#about-metric-inconsistencies
