文章目录
企业级日志分析系统
一、Logstash 入门
官网 点我直达
1、安装
这里用的是 logstash-7.10.0
运行最基本的 Logstash 管道来测试 Logstash 安装
[root@ela1 ~]# ls
logstash-7.10.0-linux-x86_64.tar.gz
[root@ela1 ~]# tar xf logstash-7.10.0-linux-x86_64.tar.gz
[root@ela1 ~]# cd logstash-7.10.0
[root@ela1 logstash-7.10.0]# bin/logstash -e 'input { stdin { } } output { stdout {} }'
当显示如下的时候
[2020-12-28T06:51:35,703][INFO ][logstash.agent           ] Successfully started Logstash API endpoint {

    :port=>9600}
尝试输入 hello
输出
hello
{


      "@version" => "1",
    "@timestamp" => 2020-12-28T12:01:42.559Z,
       "message" => "hello",
          "host" => "ela1"
}
安装成功
2、配置输入和输出
1.管道配置文件
创建一个Logstash管道,该管道使用标准输入来获取Apache Web日志作为输入,解析这些日志以从日志中创建特定的命名字段,然后将解析的数据写入Elasticsearch集群。无需在命令行上定义管道配置,而是在配置文件中定义管道。
创建first-pipeline.conf文件,并写入如下内容,作为 Logstash 的管道配置文件
[root@ela1 logstash-7.10.0]# cat first-pipeline.conf
input {


    stdin {

     }
}

output {


    stdout {

    }
}
测试配置文件
bin/logstash -f first-pipeline.conf --config.test_and_exit
启动 Logstatsh
bin/logstash -f first-pipeline.conf --config.reload.automatic
--config.reload.automatic会在你修改管道配置文件后自动加载,而不必重新启动 Logstash
启动后输入
83.149.9.216 - - [04/Jan/2015:05:13:42 +0000] "GET /presentations/logstash-monitorama-2013/imageskibana-search.png HTTP/1.1" 200 203023 "http://semicomplete.com/presentations/logstash-monitorama-2013/" "Mozilla/5.0 (Macintosh; Intel Mac OS X 10_9_1) AppleWebKit/537.36 (KHTML, like Gecko) Chrome/32.0.1700.77 Safari/537.36"
输出
{


    "@timestamp" => 2020-12-28T12:32:09.982Z,
      "@version" => "1",
       "message" => "",
          "host" => "ela1"
}
{


    "@timestamp" => 2020-12-28T12:32:10.035Z,
      "@version" => "1",
       "message" => "83.149.9.216 - - [04/Jan/2015:05:13:42 +0000] \"GET /presentations/logstash-monitorama-2013/imageskibana-search.png HTTP/1.1\" 200 203023 \"http://semicomplete.com/presentations/logstash-monitorama-2013/\" \"Mozilla/5.0 (Macintosh; Intel Mac OS X 10_9_1) AppleWebKit/537.36 (KHTML, like Gecko) Chrome/32.0.1700.77 Safari/537.36\"",
          "host" => "ela1"
}
报错解决
Failed to execute action {

    :action=>LogStash::PipelineAction::Create/pipeline_id:main, :exception=>"LogStash::ConfigurationError", :message=>"Expected one of [ \\t\\r\\n], \"#\", \"input\", \"filter\", \"output\" at line 1, col
一般是 配置的 .conf 文件内容写错了,仔细检查一下
如果真的没错误,就是程序被占用了 杀掉再起一下就好了
2.使用Grok过滤器插件解析Web日志
使用grok过滤器插件解析日志消息以从日志中创建特定的命名字段,将非结构化日志数据解析为结构化和可查询的内容。
grok 过滤插件,会根据你感兴趣的内容分配字段名称,并把这些内容和对应的字段名称进行绑定。
grok 如何知道哪些内容是你感兴趣的呢?它是通过自己预定义的模式来识别感兴趣的字段的。这个可以通过给其配置不同的模式来实现。
这里使用的模式是 %{COMBINEDAPACHELOG}
{COMBINEDAPACHELOG}使用以下模式从Apache日志中构造行:
| 原信息 | 对应新的字段名称 |
|---|---|
| IP 地址 | clientip |
| 用户 ID | ident |
| 用户认证信息 | auth |
| 时间戳 | timestamp |
| HTTP 请求方法 | verb |
| 请求的 URL | request |
| HTTP 版本 | httpversion |
| 响应码 | response |
| 响应体大小 | bytes |
| 跳转来源 | referrer |
| 客户端代理(浏览器) | agent |
关于 grok 更多的用法请参考 grok 参考文档 点我直达
这里要想实现修改配置文件之后自动加载它,不能配置 input 为 stdin。
所以, 这里我们使用了 file
添加 日志文件方便导入
[root@ela1 logstash-7.10.0]# cat /usr/local/logstash-7.10.0/access_log
83.149.9.216 - - [04/Jan/2015:05:13:42 +0000] "GET /presentations/logstash-monitorama-2013/imageskibana-search.png HTTP/1.1" 200 203023 "http://semicomplete.com/presentations/logstash-monitorama-2013/" "Mozilla/5.0 (Macintosh; Intel Mac OS X 10_9_1) AppleWebKit/537.36 (KHTML, like Gecko) Chrome/32.0.1700.77 Safari/537.36"
[root@ela1 logstash-7.10.0]# cat /usr/local/logstash-7.10.0/error_log
 2020/12/29 15:25:10 [warn] 3380#3380: *161 an upstream response is buffered to a temporary file /var/cache/nginx/proxy_temp/5/00/0000000005 while reading upstream, client: 10.9.29.234, server: localhost, request: "GET /35949/bundles/plugin/data/data.plugin.js HTTP/1.1", upstream: "http://127.0.0.1:5601/35949/bundles/plugin/data/data.plugin.js", host: "10.9.12.250:8080", referrer: "http://10.9.12.250:8080/app/home"
match => { “message” => “%{COMBINEDAPACHELOG}”} 的意思是:
当匹配到 “message” 字段时,用户模式 “COMBINEDAPACHELOG}” 进行字段映射。
配置完成后,再次进行验证
[root@ela1 logstash-7.10.0]# cat /usr/local/logstash-7.10.0/second-pipeline.conf
input {


  file {


    path => "/usr/local/logstash-7.10.0/access_log"
    start_position => "beginning"
  }
}

filter {


    grok {


        match => {

     "message" => "%{COMBINEDAPACHELOG}" }
        remove_field => [ "message" ]
    }
}

output {


  stdout {


     codec => rubydebug
  }
}
输出
{


     "@timestamp" => 2020-12-29T06:26:15.259Z,
           "path" => "/usr/local/logstash-7.10.0/access_log",
       "clientip" => "83.149.9.216",
    "httpversion" => "1.1",
           "host" => "localhost",
       "referrer" => "\"http://semicomplete.com/presentations/logstash-monitorama-2013/\"",
          "agent" => "\"Mozilla/5.0 (Macintosh; Intel Mac OS X 10_9_1) AppleWebKit/537.36 (KHTML, like Gecko) Chrome/32.0.1700.77 Safari/537.36\"",
       "response" => "200",
          "bytes" => "203023",
       "@version" => "1",
           "verb" => "GET",
           "auth" => "-",
          "ident" => "-",
      "timestamp" => "04/Jan/2015:05:13:42 +0000",
        "request" => "/presentations/logstash-monitorama-2013/imageskibana-search.png"
}
会发现原来的非结构化数据,变为结构化的数据了。
细心的你一定发现原来的 message 字段仍然存在,假如你不需要它,可以使用 grok 中提供的常用选项之一: remove_filed 来移除这个字段。
事实上 remove_field 可以移除任意的字段,它可以接收的值是一个数组。
修改后管道配置文件如下:
[root@localhost logstash-7.10.0]# cat first-pipeline.conf
input {


  file {


    path => "/usr/local/logstash-7.10.0/access_log"
    start_position => "beginning"
  }
}

filter {


    grok {


        match => {

     "message" => "%{COMBINEDAPACHELOG}"}
        remove_field => [ "message" ]
    }
}

output {


  stdout {

     codec => rubydebug }
}
继续执行
bin/logstash -f first-pipeline.conf --config.reload.automatic
发现 message 不见了
使用如下命令向示例日志文件中输入新的一行内容
[root@localhost logstash-7.10.0]# echo '83.149.9.216 - - [04/Jan/2015:05:13:42 +0000] "GET /presentations/logstash-monitorama-2013/imageskibana-search.png HTTP/1.1" 200 203023 "http://semicomplete.com/presentations/logstash-monitorama-2013/" "Mozilla/5.0 (Macintosh; Intel Mac OS X 10_9_1) AppleWebKit/537.36 (KHTML, like Gecko) Chrome/32.0.1700.77 Safari/537.36"' >> /var/nginx/access_log
输出
{


          "bytes" => "203023",
           "path" => "/usr/local/logstash-7.10.0/access_log",
      "timestamp" => "04/Jan/2015:05:13:42 +0000",
          "agent" => "\"Mozilla/5.0 (Macintosh; Intel Mac OS X 10_9_1) AppleWebKit/537.36 (KHTML, like Gecko) Chrome/32.0.1700.77 Safari/537.36\"",
       "clientip" => "83.149.9.216",
       "response" => "200",
           "verb" => "GET",
       "referrer" => "\"http://semicomplete.com/presentations/logstash-monitorama-2013/\"",
       "@version" => "1",
          "ident" => "-",
     "@timestamp" => 2020-12-29T06:36:51.119Z,
        "request" => "/presentations/logstash-monitorama-2013/imageskibana-search.png",
           "host" => "localhost",
    "httpversion" => "1.1",
           "auth" => "-"
}
3 使用Geoip过滤器插件增强数据编辑
新的管道配置文件
input {


 stdin {

    }
}
 filter {


    grok {


        match => {

     "message" => "%{COMBINEDAPACHELOG}"}
    }
    geoip {


        source => "clientip"
    }
}
output {


    stdout {

     codec => rubydebug }
}
继续输入之前的内容
83.149.9.216 - - [04/Jan/2015:05:13:42 +0000] "GET /presentations/logstash-monitorama-2013/imageskibana-search.png HTTP/1.1" 200 203023 "http://semicomplete.com/presentations/logstash-monitorama-2013/" "Mozilla/5.0 (Macintosh; Intel Mac OS X 10_9_1) AppleWebKit/537.36 (KHTML, like Gecko) Chrome/32.0.1700.77 Safari/537.36"
输出
{


        "message" => "83.149.9.216 - - [04/Jan/2015:05:13:42 +0000] \"GET /presentations/logstash-monitorama-2013/imageskibana-search.png HTTP/1.1\" 200 203023 \"http://semicomplete.com/presentations/logstash-monitorama-2013/\" \"Mozilla/5.0 (Macintosh; Intel Mac OS X 10_9_1) AppleWebKit/537.36 (KHTML, like Gecko) Chrome/32.0.1700.77 Safari/537.36\"",
           "auth" => "-",
          "geoip" => {


          "country_name" => "Russia",
              "latitude" => 55.7527,
              "location" => {


            "lon" => 37.6172,
            "lat" => 55.7527
        },
                    "ip" => "83.149.9.216",
         "country_code2" => "RU",
         "country_code3" => "RU",
             "city_name" => "Moscow",
        "continent_code" => "EU",
              "timezone" => "Europe/Moscow",
             "longitude" => 37.6172,
           "postal_code" => "144700",
           "region_code" => "MOW",
           "region_name" => "Moscow"
    },
       "@version" => "1",
       "clientip" => "83.149.9.216",
      "timestamp" => "04/Jan/2015:05:13:42 +0000",
        "request" => "/presentations/logstash-monitorama-2013/imageskibana-search.png",
    "httpversion" => "1.1",
       "response" => "200",
           "verb" => "GET",
          "bytes" => "203023",
          "ident" => "-",
       "referrer" => "\"http://semicomplete.com/presentations/logstash-monitorama-2013/\"",
     "@timestamp" => 2020-12-29T02:19:09.153Z,
          "agent" => "\"Mozilla/5.0 (Macintosh; Intel Mac OS X 10_9_1) AppleWebKit/537.36 (KHTML, like Gecko) Chrome/32.0.1700.77 Safari/537.36\"",
           "host" => "ela1"
}
二、Filebeat 安装与使用
1、安装
curl -L -O https://artifacts.elastic.co/downloads/beats/filebeat/filebeat-7.10.1-linux-x86_64.tar.gz

tar xzvf filebeat-7.10.1-linux-x86_64.tar.gz -C /usr/local
2、启用和配置数据收集模块
Filebeat使用模块来收集和解析日志数据。
1 查看可以启用的模块列表
[root@localhost ~]# cd /usr/local/filebeat-7.10.0-linux-x86_64/
[root@localhost filebeat-7.10.0-linux-x86_64]# ./filebeat modules list
Enabled:

Disabled:
activemq
apache
...
2 在安装目录中,启用一个或多个模块。
2.1 启用 nginx 模块
例如,下面的命令启用 nginx 的配置模块:
[root@localhost filebeat-7.10.0-linux-x86_64]# ./filebeat modules enable  nginx
Enabled nginx
这条命令实际上是把位于 modules.d/ 目录下的文件 nginx.yml.disabled 修改为了 nginx.yml
2.2 配置 nginx 模块
nginx.yml 文件内容:
module: nginx
access:

  # 开启搜集访问日志

  enabled: true

  # var.paths:

error:

  # 开启搜集错误日志

  enabled: true
  #var.paths:
ingress_controller:
  #它可以在Kubernetes环境中用于解析nginx日志的入口,默认禁用此选项
  enabled: false
  #var.paths:
var.paths
是用于给日志文件设置自定义路径的。
如果不设置此选项,Filebeat将根据您的操作系统选择路径。
比如:
/var/log/nginx/assecc.log
/var/log/nginx/error.log
var.paths 接收的值是一个数组,可以使用如下方式配置。
- module: nginx
  access:
    # 开启搜集访问日志
    enabled: true
    var.paths: ["/var/log/nginx/access.log*"] #自定义位置
部署步骤
1.logstash
beats {
port => 5044
}2.filebeat
数据源
从哪儿搜集日志模块
./filebeat modules enable nginxvar.paths: ["/path/to/*.log"]
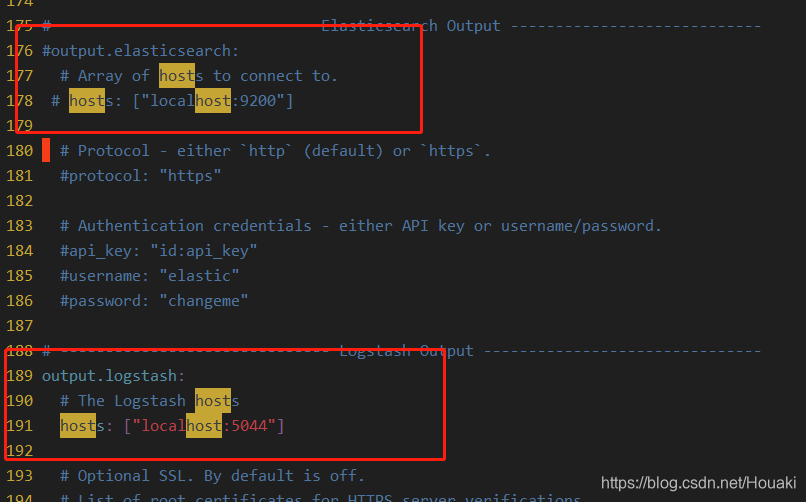
配置输出
filebeat.yml输出到Logstatsh
配置上 logstash 的 IP 地址3.启动 filebeat
./filebeat # 前台
nohub ./filebeat &
3 修改配置文件
[root@localhost ~]# cat  /usr/local/logstash-7.10.0/first-pipeline.conf
input {


    beats {


      port => 5044
   }
}

filter {


    grok {


        match => {

     "message" => "%{COMBINEDAPACHELOG}"}
        remove_field => [ "message" ]
    }
    geoip {

     source => "clientip" }
}

output {


  stdout {

     codec => rubydebug }
}
/filebeat-7.10.0-linux-x86_64/filebeat.yml
4 启动
[root@localhost ~]#  /usr/loacl/filebeat-7.10.0-linux-x86_64/filebeat -d #放入后台
[root@localhost ~]# cd /usr/local/logstash-7.10.0/
[root@localhost logstash-7.10.0]# bin/logstash -f first-pipeline.conf --config.reload.automatic
输出
[2020-12-29T02:22:28,710][INFO ][logstash.agent           ] Successfully started Logstash API endpoint {

    :port=>9600}
{


       "clientip" => "10.9.29.250",
      "timestamp" => "29/Dec/2020:08:46:43 +0800",
       "referrer" => "\"http://10.9.12.250:8080/app/home\"",
           "verb" => "POST",
          "ident" => "-",
           "auth" => "-",
            "ecs" => {


        "version" => "1.5.0"
    },
          "event" => {


        "timezone" => "-05:00",
         "dataset" => "nginx.access",
          "module" => "nginx"
    },
     "@timestamp" => 2020-12-29T07:21:11.293Z,
           "host" => {


         "architecture" => "x86_64",
                 "name" => "localhost",
                   "ip" => [
            [0] "192.168.116.167",
            [1] "fe80::2bcc:46ea:d75d:d5dc"
        ],
...
三、Elasticsearch + Logstash + Filebeat 用于生产环境的简单配置方案
配合 Elastic 可以在集群中实现查询
[root@localhost filebeat-7.10.0-linux-x86_64]# curl -X GET "192.168.116.167:9200/_cat/nodes"
192.168.116.155 33 96  6 0.33 0.23 0.17 cdhilmrstw * ela2
192.168.116.166 31 96  6 0.10 0.11 0.13 cdhilmrstw - ela3
192.168.116.167 29 96 39 1.39 1.67 1.84 cdhilmrstw - ela1
[root@ela3 ~]# curl -X GET "192.168.116.167:9200/_cat/indices?v"
health status index                      uuid                   pri rep docs.count docs.deleted store.size pri.store.size
green  open   logstash-2020.12.28-000001 W1R0NfkXToCDbgy_nSmr8A   1   1          0            0
[root@localhost ~]# cat /usr/local/logstash-7.10.0/first-pipeline.conf
input {


    beats {


      port => 5044
   }
}

filter {


    grok {


        match => {

     "message" => "%{COMBINEDAPACHELOG}"}
        remove_field => [ "message" ]
    }
    geoip {

     source => "clientip" }
}

output {


  stdout {

     codec => rubydebug }

elasticsearch {


    # 这里是输出到 elasticsearch 集群中
    hosts => ["192.168.116.167:9200","192.168.116.155:9200","192.168.116.166:9200"]
  }
}
日志追加 则继续
输出
{


        "request" => "/api/ui_metric/report",
       "clientip" => "10.9.29.250",
        "fileset" => {


        "name" => "access"
    },
       "referrer" => "\"http://10.9.12.250:8080/app/home\"",
      "timestamp" => "29/Dec/2020:08:46:43 +0800",
        "service" => {


        "type" => "nginx"
    },
          "agent" => {


        "ephemeral_id" => "68962cc2-f4d6-465a-b7bc-8cc3aa91429d",
                  "id" => "dce975d3-24f5-421f-a7ca-0dadfc6348f1",
            "hostname" => "localhost",
                "type" => "filebeat",
                "name" => "localhost",
             "version" => "7.10.0"
    },
          "geoip" => {

    },
            "log" => {


          "file" => {


            "path" => "/var/log/nginx/access.log"
        },
        "offset" => 0
    },
    "httpversion" => "1.1",
          "bytes" => "0",
           "tags" => [
        [0] "beats_input_codec_plain_applied",
        [1] "_geoip_lookup_failure"
    ],
       "response" => "499",
          "input" => {


        "type" => "log"
    },
           "verb" => "POST",
           "host" => {


                   "id" => "38b8887c97c045caa0333f41031ea4ea",
             "hostname" => "localhost",
                  "mac" => [
            [0] "00:0c:29:6d:70:86"
        ],
                   "os" => {


            "platform" => "centos",
                "name" => "CentOS Linux",
            "codename" => "Core",
              "family" => "redhat",
             "version" => "7 (Core)",
              "kernel" => "3.10.0-1127.19.1.el7.x86_64"
        },
         "architecture" => "x86_64",
        "containerized" => false,
                 "name" => "localhost",
                   "ip" => [
            [0] "192.168.116.167",
            [1] "fe80::2bcc:46ea:d75d:d5dc"
        ]
    },
       "@version" => "1",
          "ident" => "-",
           "auth" => "-",
            "ecs" => {


        "version" => "1.5.0"
    },
          "event" => {


          "module" => "nginx",
        "timezone" => "-05:00",
         "dataset" => "nginx.access"
    },
     "@timestamp" => 2020-12-29T09:53:38.427Z
}