一、简介
A* 算法是启发式搜索算法,是根据Dijkstra算法改进而来。
问题引入
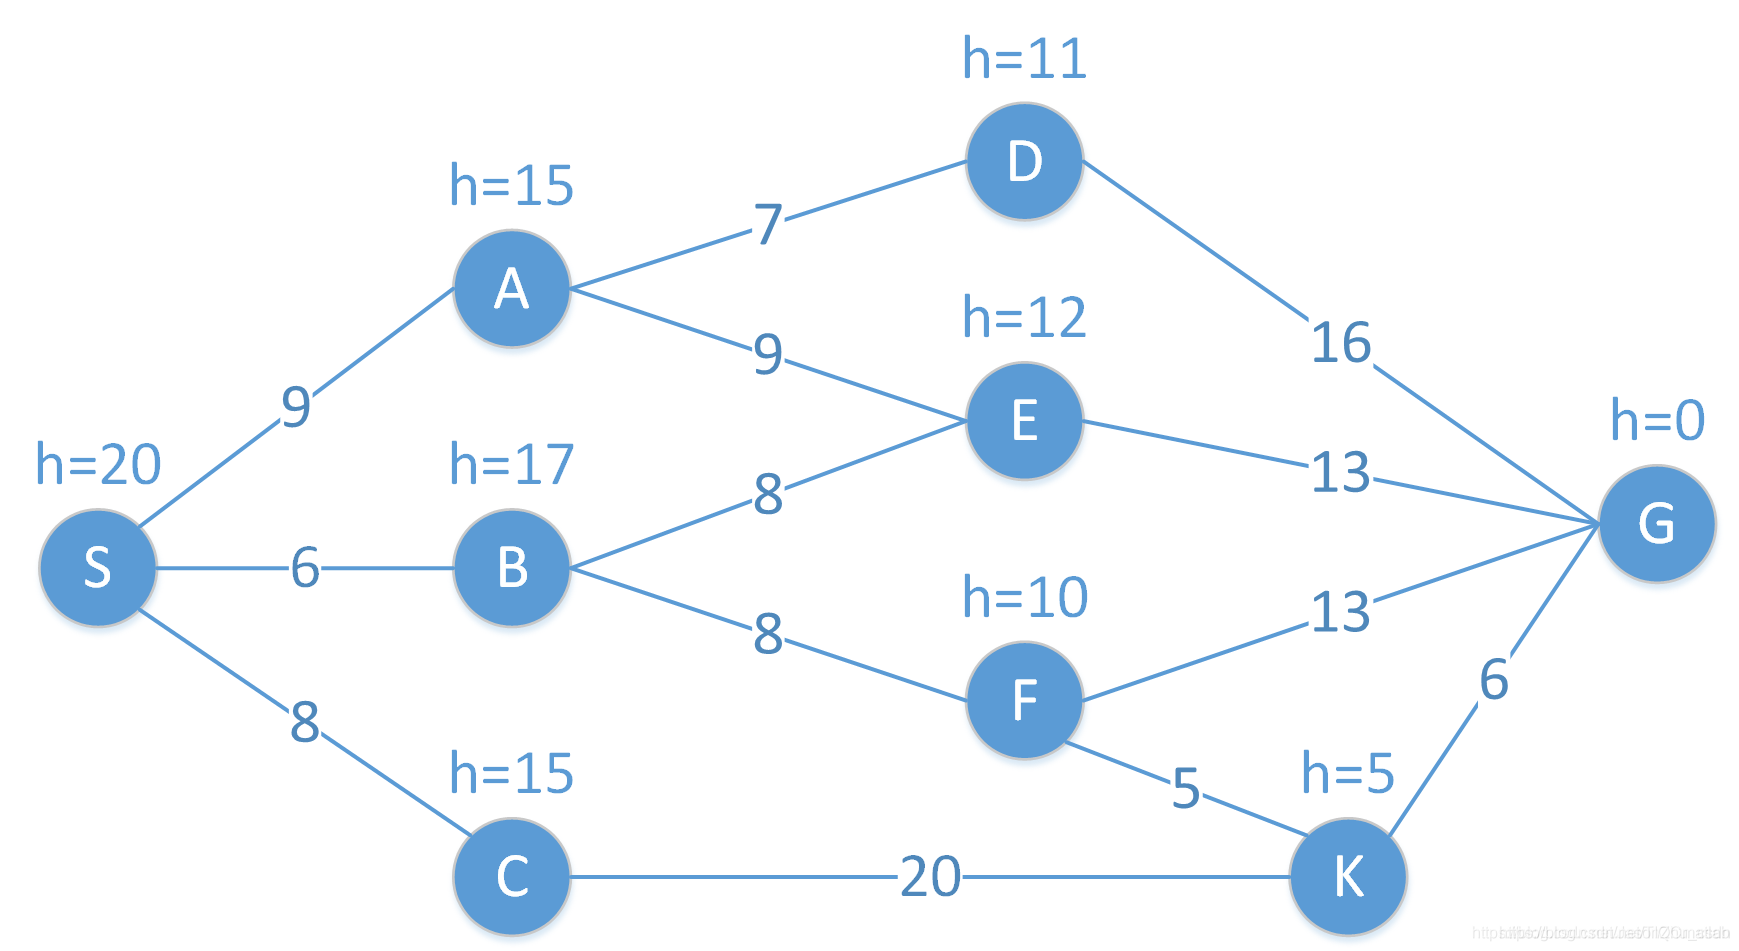
如下图所示,S为起始(start)节点,G为目标(goal)节点。
节点之间连线是两点的路径长度,如A到E的路径长度c(A,E) = 9。
节点旁的h值时当前节点到达目标节点(G)的预估值,如h(A)=15, 表示从当前点A到达目标点G的估计路径长度为15,此处h(x)即为启发函数,启发函数的设计有很多方法,具体可参考链接,此处不再扩展。
从起点S到达当前节点x的路径长度表示为g(x) 。
从起点S到达目标G并经过点x的估计距离长度表示为f(x) = g(x) + h(x),该公式是A算法的核心公式。
A算法通过不断的选择估计距离f最小的节点,逐渐构建最短路径。
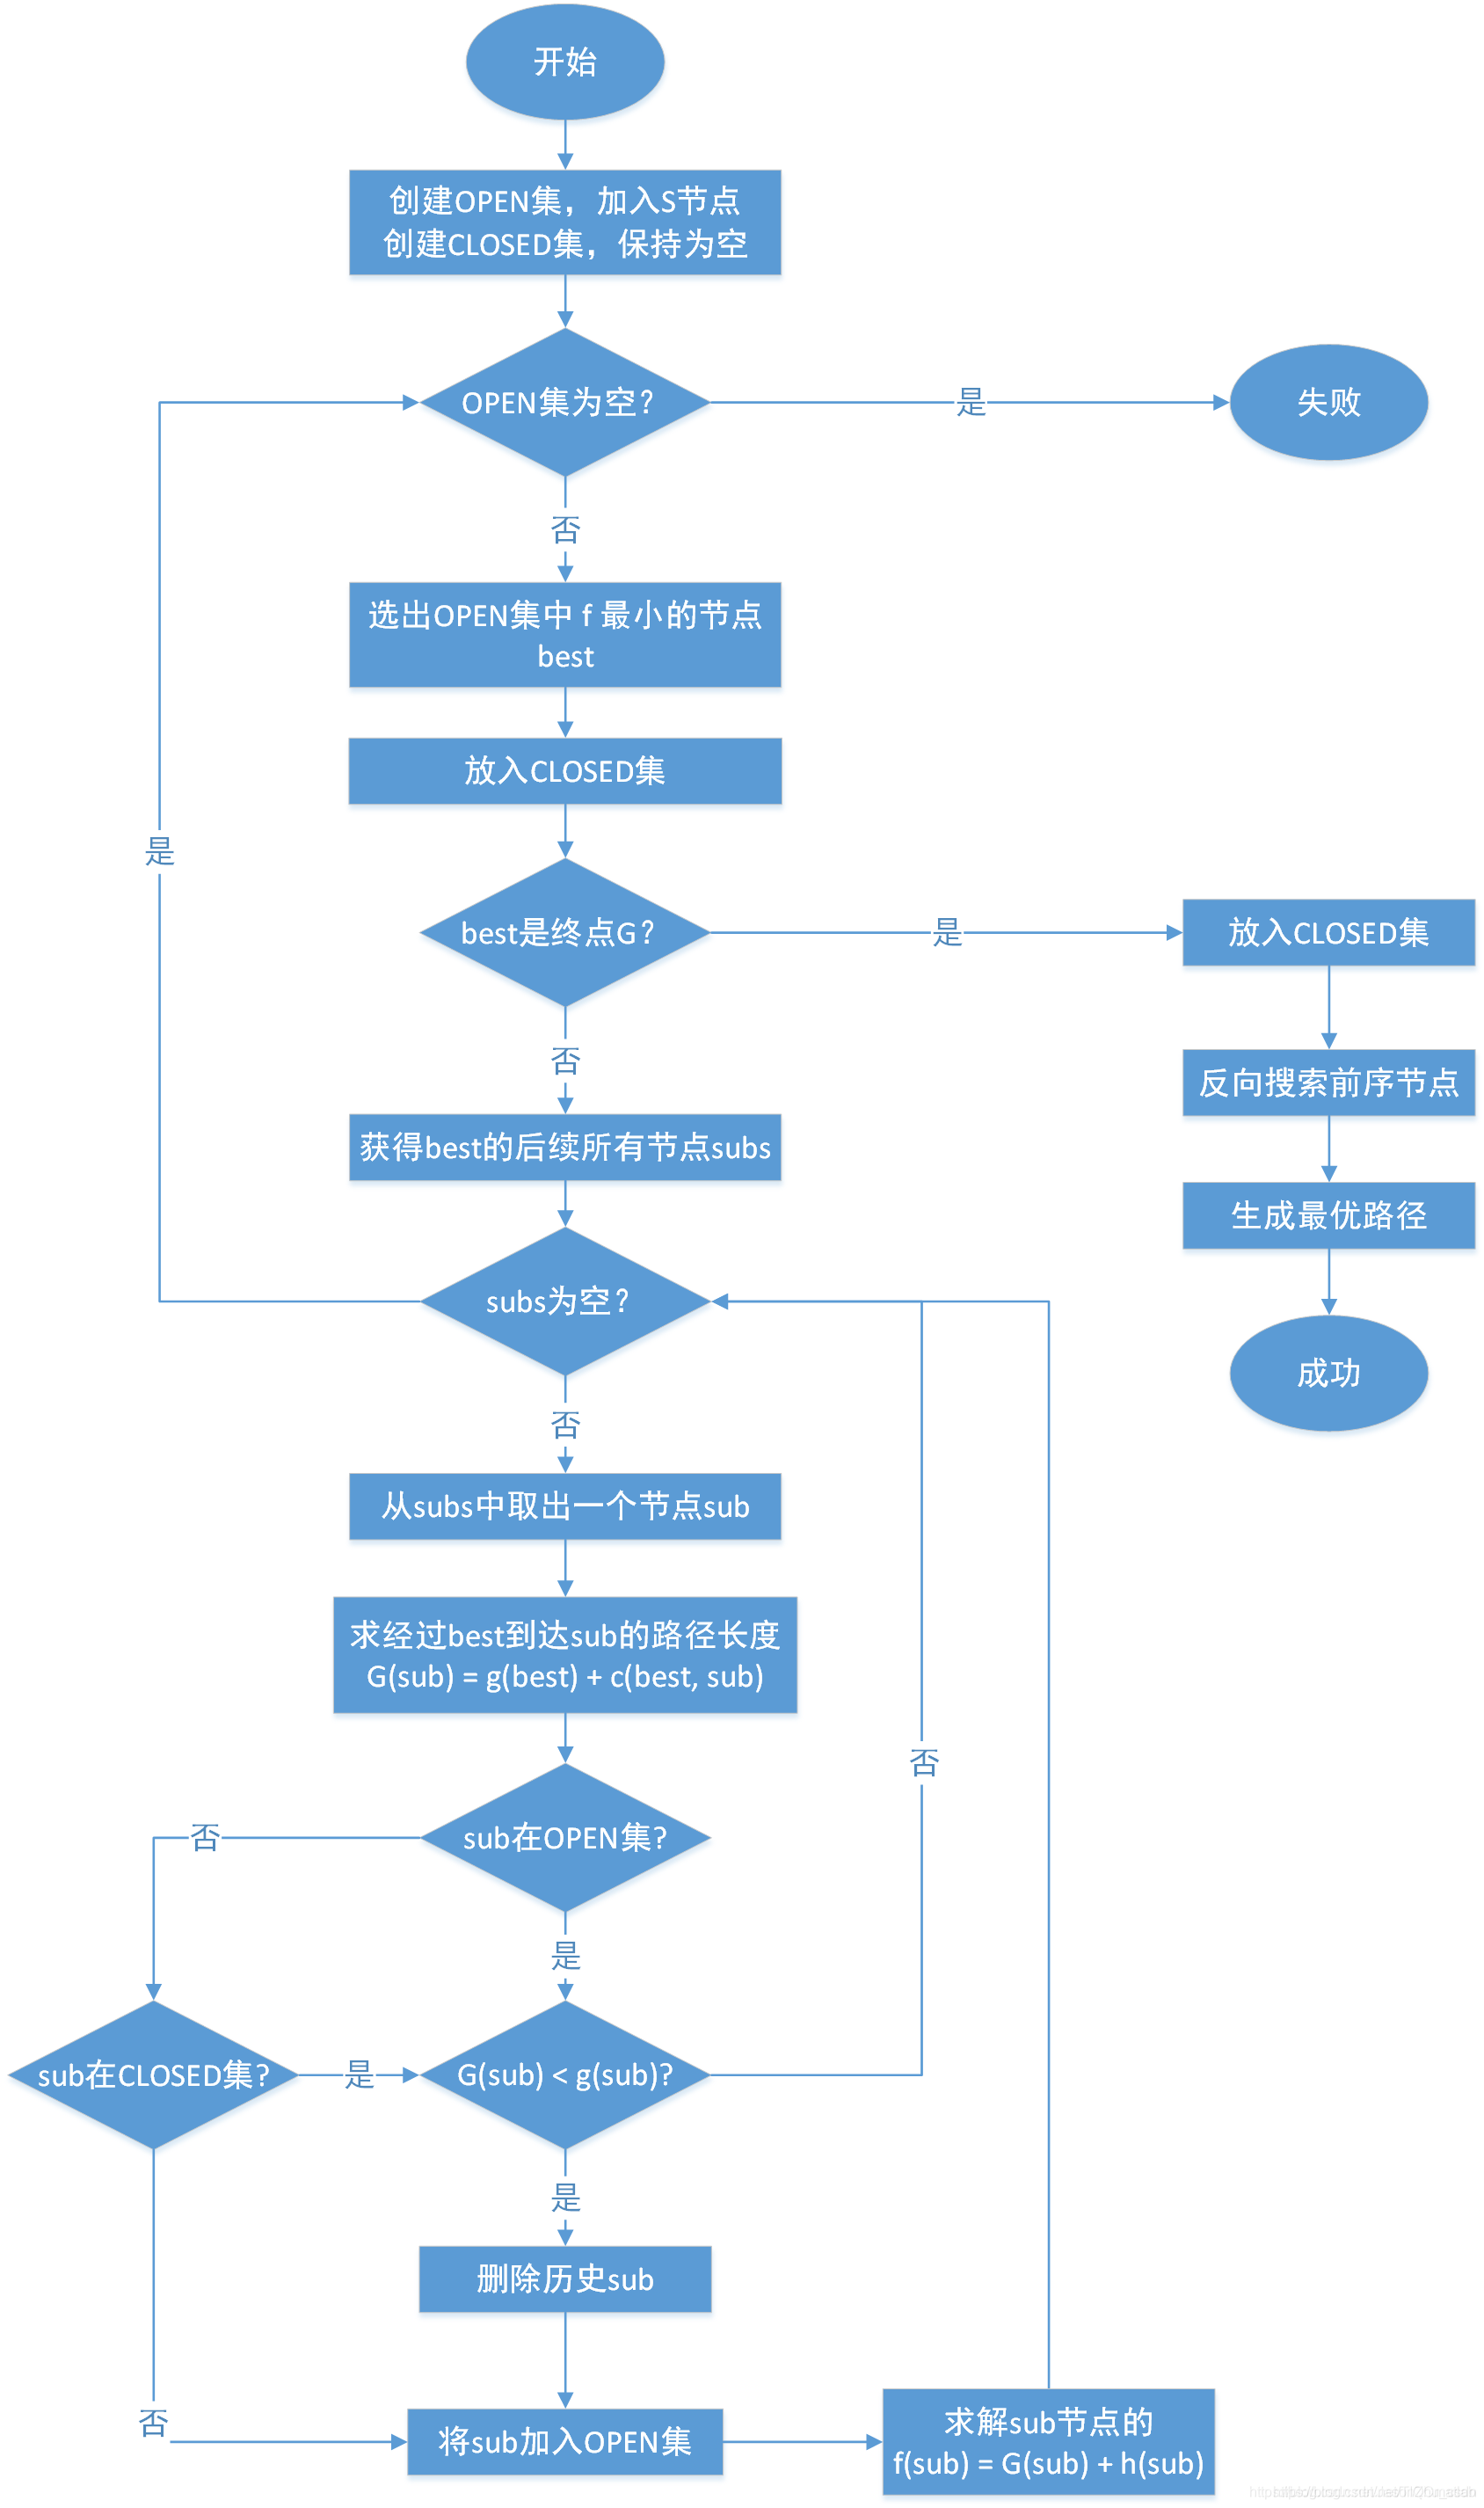
逻辑流程
创建两个集合OPEN集,CLOSED集,算法核心是从OPEN集中选择最优(f值小最优,或f相同时,h小的更优)的节点到CLOSED集中,然后将其后继节点放入OPEN集中,然后重复操作选取最优节点,直到到达目标,或者OPEN为空为止。最后再CLOSED集中根据目标G所包含的前序节点逆序查找最后到达起点S,这个链路的逆序即最优路径,具体流程如下图。
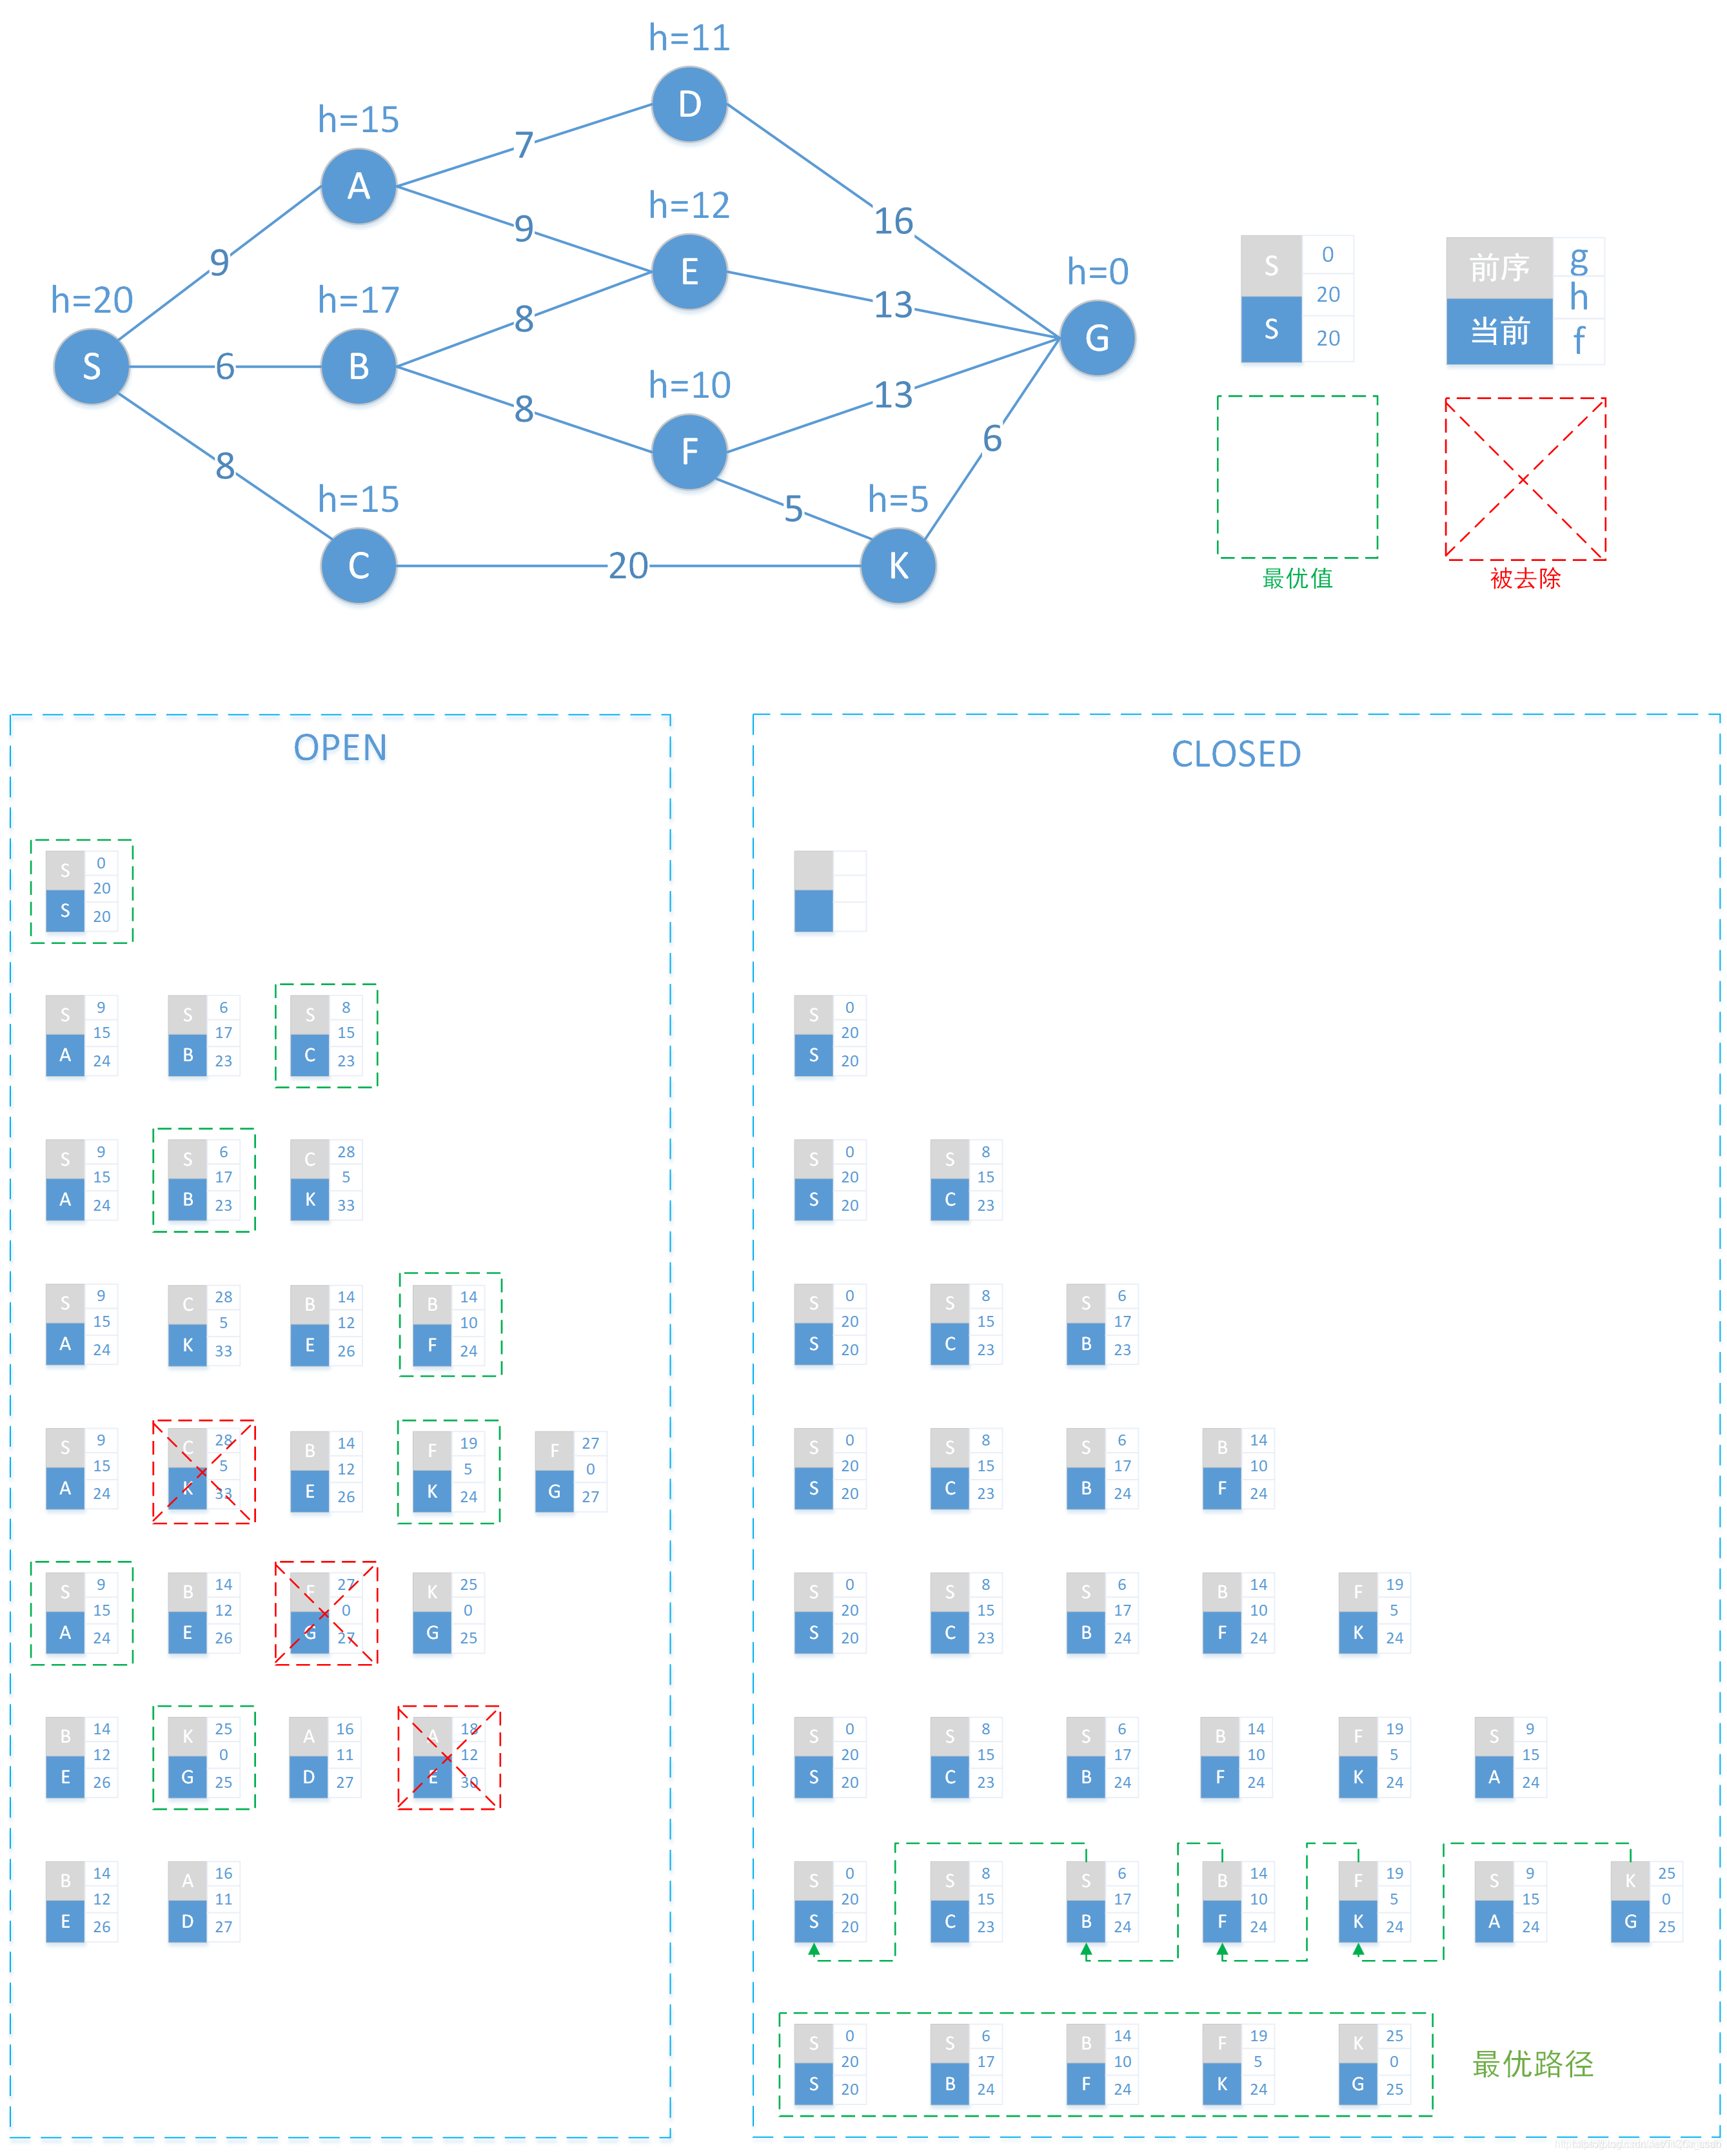
搜索过程
以下是前面网络的搜索过程展开图。
组合块中:
灰色为前序节点
蓝色当前节点x
g:起点S到当前节点x的路径距离。
h:当前节点x到终点G的估计距离
f:起点S途径x到达终点G的估计距离,即 f = g + h
绿色框为当前OPEN集合中的最优节点
红色框表示当前OPEN集合中需要被删除的节点
在OPEN、CLOSED中每一行表示一次完整迭代完成时两集合中的节点集合。
最后的最优路径是:S->B->F->k->G
注:当两个节点f相同时,h小的更优
二、源代码
%**************************************************************************
disp(' Generating Grid ... ');
co=or;
crn=s;
noOfNodes = nooc*noor;
nodmat=ones(nooc,noor,3);
nodmat(1:noOfNodes)=1:noOfNodes;
nodmat(:,:,2)=(find(nodmat(:,2,2)==1))*ones(1,noor);
nodmat(:,:,3)=ones(nooc,1)*(find(nodmat(2,:,3)==1));
nodmat(:,:,1)=flipdim((nodmat(:,:,1)),2);
nodmat(:,:,2)=flipdim((nodmat(:,:,2)),2);
nodmat(:,:,3)=flipdim((nodmat(:,:,3)),2);
noddata=reshape(nodmat,noOfNodes,3);
%rand('state', 0);
if plot_flag==1
scrsz = get(0,'ScreenSize');
h=figure(gcf);
set(h,'Position',[scrsz(3)/8 scrsz(4)/8 scrsz(3)-2*scrsz(3)/8 ...
scrsz(4)-2*scrsz(4)/8]);
clf;
hold on;
end
Astar_coor=noddata(:,2:3)*GTS;
netXloc = Astar_coor(:,1)';
netYloc = Astar_coor(:,2)';
axis([min(netXloc)-20 max(netXloc)+30 min(netYloc)-20 max(netYloc)+30])
Astar_connect = zeros(noOfNodes, noOfNodes);
Astar_coord = zeros(noOfNodes, 2);
for i = 1:noOfNodes
Astar_coord(i,1) = netXloc(i);
Astar_coord(i,2) = netYloc(i);
for j = 1:noOfNodes
distance = sqrt((netXloc(i) - netXloc(j))^2 + (netYloc(i) - netYloc(j))^2);
ll=isempty(find(o==i, 1));
lm=isempty(find(o==j, 1));
if (distance <= R && ll==1 && lm==1)
matrix(i, j) = distance; % if set to '1', Dijkstra computes Spath in terms of hops; if set to 'distance', it is the real shortest path
if i~=j % must be satisfied
Astar_connect(i, j) = 1;
else
Astar_connect(i, j) = 0;
end
if plot_flag==1
line([netXloc(i) netXloc(j)], [netYloc(i) netYloc(j)], 'color',[.65 .65 .65],'LineStyle', ':');
end
else
matrix(i, j) = inf;
Astar_connect(i, j) = 0;
end;
end;
end
for i = 1:noOfNodes
if plot_nodenum
text(netXloc(i)+20, netYloc(i), num2str(i));
end
if plot_flag==1
if i==s
plot(netXloc(i), netYloc(i),'square','MarkerSize',12,'MarkerFaceColor','g');
hold on;
end
if i==d
plot(netXloc(i), netYloc(i),'square','MarkerSize',12,'MarkerFaceColor','r');
end
if isempty(find(o==i))
plot(netXloc(i), netYloc(i),'.');
end
end
end;
% activeNodes = [];
% for i = 1:noOfNodes,
% % initialize the farthest node to be itself;
% farthestPreviousHop(i) = i; % used to compute the RTS/CTS range;
% farthestNextHop(i) = i;
% end;
Astar_coord=Astar_coord';
%Astar_connect;
%%
disp('Generating Paths ... ')
%[path, totalCost, farthestPreviousHop, farthestNextHop] = dijkstra(noOfNodes, matrix, s, d, farthestPreviousHop, farthestNextHop);
% combo = [noOfNodes s-1 d-1 R/2];
%[Astar_path, Astar_search] = Astar(Astar_coord', Astar_connect, combo); % notice, we must put Astar_coord' rather than Astar_coord
%[Astar_paths,cost_astar,astar_time] = Astarm(Astar_coord, Astar_connect, s , d);
%[Astar_path,Astar_search]=Astar(Astar_coord, Astar_connect, combo);
[Astar_path,cost_astar,astar_time,Astar_dist] =komegaA(Astar_coord, Astar_connect, s, d, 1, inf, 0);
[komega_path,cost_komega,ko_time,komega_dist]=komegaA(Astar_coord, Astar_connect, s, d, k , b, n);
%%
if disp_summary==1
Astar_path, komega_path,cost_astar,cost_komega,astar_time,ko_time, Astar_dist, komega_dist
end
if ~isempty(Astar_path)
for i = 1:(length(Astar_path)-1)
if plot_flag==1
astr=line([netXloc(Astar_path(i)) netXloc(Astar_path(i+1))], [netYloc(Astar_path(i)) netYloc(Astar_path(i+1))], 'Color','r','LineWidth', 2, 'LineStyle', '-.');
if plot_nodenum==1
text(netXloc(i), netYloc(i), num2str(i));
end
end
end;
end;
if ~isempty(komega_path)
for i = 1:(length(komega_path)-1)
if plot_flag==1
kom=line([netXloc(komega_path(i)) netXloc(komega_path(i+1))], [netYloc(komega_path(i)) netYloc(komega_path(i+1))], 'Color','g','LineWidth', 2, 'LineStyle', '-');
if plot_nodenum==1
text(netXloc(i), netYloc(i), num2str(i));
end
end
end;
end;
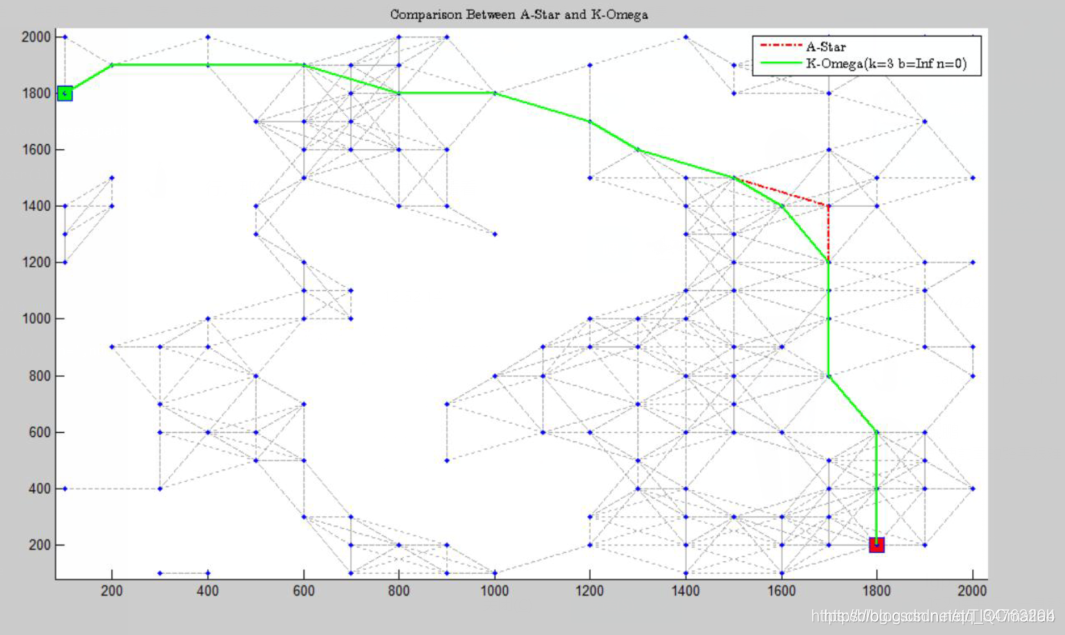
rest=title('Comparison Between A-Star and K-Omega');
set(rest,'Interpreter','latex');
dkstr=strcat('K-Omega(k=',num2str(k),' b=',num2str(b),' n=',num2str(n),')');
kleg=legend([astr kom],'A-Star',dkstr);hold on;
set(kleg,'Interpreter','latex');
if plot_flag == 1
hold off;
end
% Execute if K-Omega has not yet executed harware
if (n==0)
[done]=execnxt(komega_path);
end
% If Analysis mode requested, perform analysis
if AnalysisMode==1
AnalyzeKO;
end
三、运行结果
四、备注
完整代码或者代写添加QQ1564658423
往期回顾>>>>>>
【预测模型】基于matlab粒子群的lssvm预测【含Matlab源码 103期】
【lSSVM预测】基于matlab鲸鱼优化算法之lSSVM数据预测【含Matlab源码 104期】
【lstm预测】基于matlab鲸鱼优化算法之改进的lstm预测【含Matlab源码 105期】
【SVM预测】基于matlab蝙蝠算法改进的SVM预测(一)【含Matlab源码 106期】
【SVM预测】基于matlab灰狼算法优化svm支持向量机预测【含Matlab源码 107期】
【预测模型】基于matlab BP神经网络的预测【含Matlab源码 108期】
【lssvm预测模型】基于蝙蝠算法改进的最小二乘支持向量机lssvm预测【Matlab 109期】
【lssvm预测】基于飞蛾扑火算法改进的最小二乘支持向量机lssvm预测【Matlab 110期】
【SVM预测】基于matlab蝙蝠算法之改进的SVM预测(二)【含Matlab源码 141期】
【lssvm预测】基于matlab飞蛾扑火算法之改进的最小二乘支持向量机lssvm预测【含Matlab源码 142期】
【ANN预测模型】基于matlab差分算法改进ANN网络预测【含Matlab源码 151期】
【预测模型】基于matlab RBF神经网络预测模型【含Matlab源码 177期】
【预测模型】基于matlab SVM回归预测算法来预测股票趋势【含Matlab源码 180期】
【预测模型】基于matlab BP神经网络之模型优化预测【含Matlab源码 221期】
【预测模型】基于matlab RLS算法的数据预测【含Matlab源码 222期】
【预测模型】基于matlab碳排放约束下的煤炭消费量优化预测【含Matlab源码 223期】