step函数概述
step函数用于绘制阶梯图。
根据源码可知,step函数是对plot函数的轻量级封装,很多概念和用法与plot函数非常相似。
def step(self, x, y, *args, where='pre', data=None, **kwargs):
    cbook._check_in_list(('pre', 'post', 'mid'), where=where)
    kwargs['drawstyle'] = 'steps-' + where
    return self.plot(x, y, *args, data=data, **kwargs)
step函数签名:
matplotlib.pyplot.step(x, y, *args, where='pre', data=None, **kwargs)
step函数调用签名:
step(x, y, [fmt], *, data=None, where='pre', **kwargs)
step(x, y, [fmt], x2, y2, [fmt2], ..., *, where='pre', **kwargs)
其中:
x:类数组结构,一维x轴坐标序列。一般假设x轴坐标均匀递增。必备参数。y:类数组结构,一维y轴坐标序列。必备参数。fmt:格式字符串,与plot函数的fmt参数类似。可选参数。官方建议只设置颜色格式。data:可索引数据,类似于plot函数。可选参数。**kwargs:类似于plot函数。where:设置阶梯所在位置,取值范围为{'pre', 'post', 'mid'},默认值为'pre'。
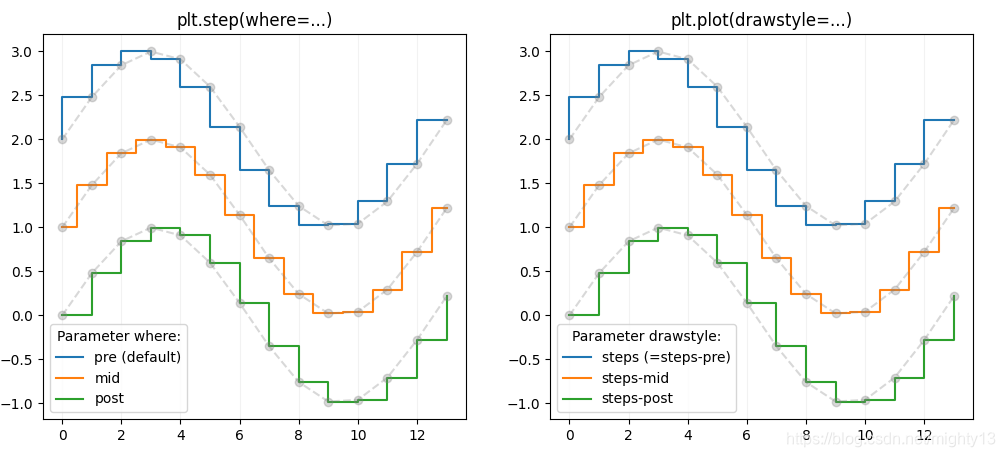
案例:使用step函数和plot函数演示不同where参数的效果
通过案例可知,step函数可以认为是plot函数绘制阶梯图的一个特例。
import numpy as np
import matplotlib.pyplot as plt

x = np.arange(14)
y = np.sin(x / 2)

plt.figure(figsize=(12,5))
plt.subplot(121)
plt.step(x, y + 2, label='pre (default)')
plt.plot(x, y + 2, 'o--', color='grey', alpha=0.3)

plt.step(x, y + 1, where='mid', label='mid')
plt.plot(x, y + 1, 'o--', color='grey', alpha=0.3)

plt.step(x, y, where='post', label='post')
plt.plot(x, y, 'o--', color='grey', alpha=0.3)

plt.grid(axis='x', color='0.95')
plt.legend(title='Parameter where:')
plt.title('plt.step(where=...)')

plt.subplot(122)
plt.plot(x, y + 2, drawstyle='steps', label='steps (=steps-pre)')
plt.plot(x, y + 2, 'o--', color='grey', alpha=0.3)

plt.plot(x, y + 1, drawstyle='steps-mid', label='steps-mid')
plt.plot(x, y + 1, 'o--', color='grey', alpha=0.3)

plt.plot(x, y, drawstyle='steps-post', label='steps-post')
plt.plot(x, y, 'o--', color='grey', alpha=0.3)

plt.grid(axis='x', color='0.95')
plt.legend(title='Parameter drawstyle:')
plt.title('plt.plot(drawstyle=...)')
plt.show()