1、自动关联参考文献和引用
\usepackage{hyperref}
\hypersetup{hypertex=true,
colorlinks=true,
linkcolor=blue,
anchorcolor=blue,
citecolor=blue}
2、换行
\\
3、引用参考文献:
\cite{}
4、首行缩进
\usepackage{indentfirst}
\indent{}
5、插入表格:
\begin{table}
\centering

\begin{tabular}{lccccc}%l=left, r=right,c=center分别代表左对齐,右对齐和居中,字母的个数代表列数
\hline
Databases &Ref Images &Dist Images &Dist Types &Score Type &Score Range  \\
\hline

LIVE    &29 &779 &5 &DMOS &[0,100] \\
 \hline
TID2013 &30 &3000 &24 &MOS &[0,9] \\
 \hline
CSIQ &25 &866 &6 &DMOS &[0,1] \\
 \hline
LIVEC &N.A. &1162 &Numerous &MOS &[0,100] \\
 \hline
\end{tabular}
\caption{Parameter setting in simulation and experiment}
\end{table}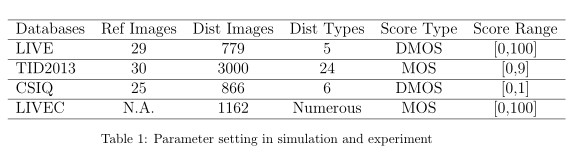
自动关联:
\caption{Parameter setting in simulation and experiment}\label{table:Figure1}
the result is show in Table . \ref{table:Figure1}.
6、表格缩放
\scalebox{0.9}{
\begin{tabular}

......

\end{tabular}}


文章前面需有

\usepackage{graphicx}


如果要在外面加table,就这么用

\begin{table}

\caption{表格标题}

\scalebox{0.9}{

\begin{tabular}

……

\end{tabular}}

\end{table}
7、表格合并:
The easiest way to do multirow and multicolumn spanning in latex is to use the package multirow. Just put
\usepackage{multirow} at the top of your latex file.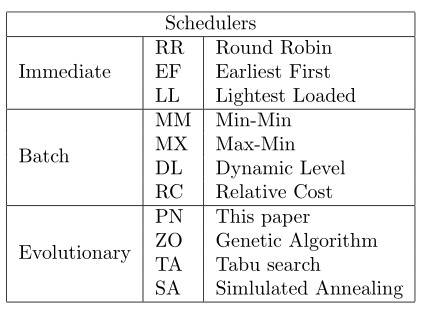
Above is a simple example of this in action.
\begin{tabular}{|l|l|l|} \hline
\multicolumn{3}{|c|}{Schedulers} \\ \hline
\multirow{3}{*}{Immediate} & RR & Round Robin \\
& EF & Earliest First \\
& LL & Lightest Loaded \\ \hline
\multirow{4}{*}{Batch} & MM & Min-Min \\
& MX & Max-Min \\
& DL & Dynamic Level \\
& RC & Relative Cost \\ \hline
\multirow{4}{*}{Evolutionary} & PN & This paper \\
& ZO & Genetic Algorithm\\
& TA & Tabu search~\cite{GLOV1986j}\\
& SA & Simlulated Annealing \\ \hline
\end{tabular}
The main things to note are, to span multiple columns in a latex table you just use \multicolumnfollowed by the number of columns to span and how you want it positioned, e.g. l for left, r for right, c for centered. Spanning multiple rows in a latex table is the same, except using \multirow followed by the number of rows to span, and how you would like it positioned. * basically means best fit. Remember that the first element of each row needs to be empty, since you have some piece of information spanning multiple rows.
8、各种表格样式:
参见[3]
9、缩小两行的距离
\vspace{2.0 cm}
10、图片排版:
(1)一行图片,注释在最左边居中:
%origin
\begin{minipage}[cl]{0.12\linewidth}
\textbf{Original} \\ \textbf{image}
\end{minipage}
\hfill
\begin{minipage}[c]{0.88\textwidth}
\includegraphics[width=\featureImgWith cm, height=\featureImgWith cm ]{resizeFeatureMap/origin/origin.eps}
\includegraphics[width=\featureImgWith cm, height=\featureImgWith cm]{resizeFeatureMap/origin/conv1.eps}
\includegraphics[width=\featureImgWith cm,  height=\featureImgWith cm]{resizeFeatureMap/origin/L1.eps}
\end{minipage}
\vspace{\featureImgMargin cm}

%White noise
\begin{minipage}[cl]{0.12\linewidth}
\textbf{White} \\ \textbf{noise}
\end{minipage}
\hfill
\begin{minipage}[c]{0.88\textwidth}
\includegraphics[width=\featureImgWith cm, height=\featureImgWith cm]{resizeFeatureMap/wn/wn.eps}
\includegraphics[width=\featureImgWith cm, height=\featureImgWith cm]{resizeFeatureMap/wn/conv1.eps}
\includegraphics[width=\featureImgWith cm,  height=\featureImgWith cm]{resizeFeatureMap/wn/L1.eps}
\end{minipage}
\vspace{\featureImgMargin cm}
(2)一行两列图片的排版:
\begin{figure}[H]
  \centering
  \subfigure[neutron image]{
  % Requires \usepackage{graphicx}
  \includegraphics[width=6cm]{./image/LCN/origin.jpg}}
  \quad
  \subfigure[LCN image]{
  \includegraphics[width=6cm]{./image/LCN/result.jpg}}
  \caption{Neutron image and corresponding LCN image}\label{fig:Fig1}
\end{figure}
11、公式对齐 参考[5]
(1)等号对齐:
\begin{equation}
\begin{split}
S &= P, \\
NP &= NS
\end{split}
\end{equation}
(2)居中对齐
或是改用 gathered 环境(居中),像这样:
\begin{equation}
\begin{gathered}
S = P, \\
NP = NS
\end{gathered}
\end{equation}
参考:
[1]https://blog.csdn.net/liu3237/article/details/14165993
[2] LaTeX技巧289:合并行合并列表格实例 - LaTeX科技排版工作室
[3] LaTeX各种表格