vue内使用 cytoscape
官网(https://js.cytoscape.org/)
官网全是英文,不太友好,哈哈哈,翻译过来也是乱七八糟…
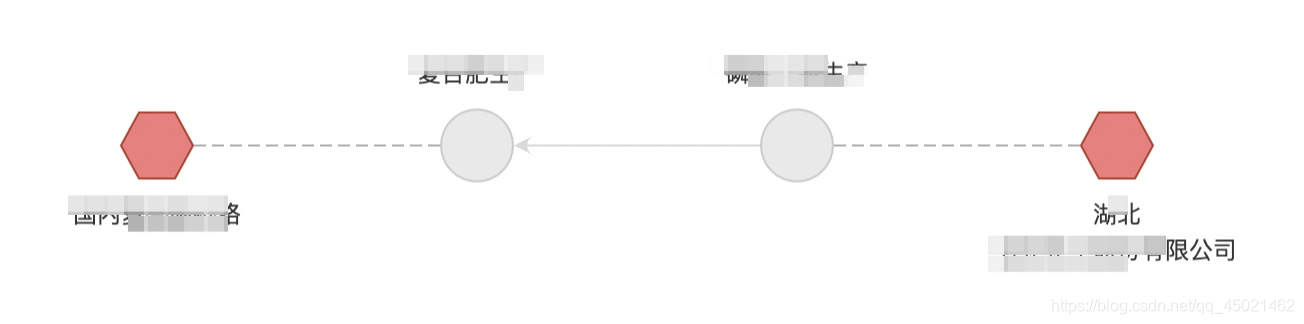
cytoscape能够进行图形分析和可视化,轻松显示和操作交互式图形,允许用户与图形进行交互。
cytoscape是用于可视化网络数据的强大工具。点(node)和线(edge)是网络图中的两大核心要素,我们做各种各样的网络图,归根结底是对点和线进行注释,通过改变点和线的样式来赋予点和线不同的意义,从而实现数据的可视化。
安装cytoscape
npm install cytoscape
引入
import cytoscape from "cytoscape";
使用
- container:一个HTML DOM元素,应在其中呈现图形;
- elements:指定为纯对象的元素数组。为方便起见,也可以将此选项指定为可解析为JSON元素的Promise;
- style:用于设置图形样式的样式表。为方便起见,也可以将此选项指定为解析为样式表的Promise;
- layout:指定布局选项的普通对象。该name字段最初指定运行哪种布局。如果要在元素JSON中自己指定节点位置,则可以使用preset布局-默认情况下,它不设置任何位置,而将节点保留在当前位置(即options.elements在初始化时指定);
- data:包含图形级数据(即不属于任何特定节点或边的数据)的普通对象。
var cy = cytoscape({
  container: document.getElementById('cy') // container to render in
  elements: this.eleData(),
  style: [ // the stylesheet for the graph
    {
      selector: 'node',
      style: {
        'background-color': '#666',
        'label': 'data(id)'
      }
    },

    {
      selector: 'edge',
      style: {
        'width': 3,
        'line-color': '#ccc',
        'target-arrow-color': '#ccc',
        'target-arrow-shape': 'triangle',
        'curve-style': 'bezier'
      }
    }
  ],
  layout: {
    name: 'grid',
    rows: 1
  },
});

  eleData(){
	function getNodeColor(label) {
        if (label === "www") {
          return "#E9E9E9";
        } else {
          return "#F47B7B";
        }
      }

      function getNodeType(label) {
        if (label === "www") {
          return "eee";
        } else {
          return "hhh";
        }
      }

      function getEdgeType(etype) {
        if (etype === "ppp" || etype === "aaa") {
          return "dashed";
        } else {
          return "solid";
        }
      }

      function getEdgeColor(etype) {
        if (etype === "ppp" || etype === "aaa") {
          return "#ACACAC";
        } else {
          return "#D9D9D9";
        }
      }

      function getArrowType(etype) {
        if (etype === "ppp" || etype === "aaa") {
          return "none";
        } else {
          return "triangle-backcurve";
        }
      }

	let eles = {
        nodes: [],
        edges: []
    };
    //path_data为从后端获取回来的数据
    this.path_data.forEach((item, index) => {
        // console.log(item,index);
        eles.nodes.push({
          data: {
            id: item.idx,
            name: item.name,
            borderColor: "#",
            backgroundColor: getNodeColor(item.label),
            type: getNodeType(item.label)
          },
          position: {
            x: index * 200 + 40,
            y: 100
          }
        });

        if (index < this.path_data.length - 1) {
          let source, target;
          if (item.from_to === 0) {
            source = item.idx;
            target = this.path_data[index + 1].idx;
          } else {
            source = this.path_data[index + 1].idx;
            target = item.idx;
          }

          eles.edges.push({
            data: {
              id: Math.random()
                .toString(36)
                .substr(2, 9),
              source: source,
              target: target,
              edgeType: getEdgeType(item.etype),
              edgeColor: getEdgeColor(item.etype),
              arrowType: getArrowType(item.etype)
            }
          });
        }
      });

      return eles;
	}