数据分析目标
- 将有效数字提前出来
- 根据device_id 和包序号seq,统计出丢包率
- rssi,snr信号折线图和平均值
数据文件(显示部分)数据下载
channel [11], device_id[612], ts[5] sf[9], rssi [-59.710346], snr [9.750000], seq [940], skip_seq 0, msg_type=161,ibeacon=5,station_id=6, freq_hz=488200000, freq_offset=-2992
channel [10], device_id[611], ts[5] sf[9], rssi [-59.710346], snr [8.750000], seq [934], skip_seq 0, msg_type=161,ibeacon=5,station_id=6, freq_hz=488000000, freq_offset=-2740
channel [8], device_id[609], ts[5] sf[9], rssi [-61.710346], snr [9.000000], seq [912], skip_seq 0, msg_type=161,ibeacon=5,station_id=6, freq_hz=487600000, freq_offset=-255
channel [12], device_id[613], ts[5] sf[9], rssi [-61.710346], snr [10.250000], seq [966], skip_seq 0, msg_type=161,ibeacon=5,station_id=6, freq_hz=488400000, freq_offset=-1638
channel [13], device_id[614], ts[5] sf[9], rssi [-62.710346], snr [10.000000], seq [949], skip_seq 0, msg_type=161,ibeacon=5,station_id=6, freq_hz=488600000, freq_offset=-1232
channel [9], device_id[610], ts[5] sf[9], rssi [-53.710346], snr [10.500000], seq [927], skip_seq 0, msg_type=161,ibeacon=5,station_id=6, freq_hz=487800000, freq_offset=-3229
channel [14], device_id[615], ts[5] sf[9], rssi [-56.710346], snr [11.500000], seq [1034], skip_seq 0, msg_type=161,ibeacon=5,station_id=6, freq_hz=488800000, freq_offset=-3236
channel [7], device_id[608], ts[5] sf[9], rssi [-32.710346], snr [10.500000], seq [904], skip_seq 0, msg_type=161,ibeacon=5,station_id=6, freq_hz=487400000, freq_offset=1859
channel [5], device_id[606], ts[5] sf[9], rssi [-30.710344], snr [10.250000], seq [798], skip_seq 0, msg_type=161,ibeacon=5,station_id=6, freq_hz=487000000, freq_offset=-2645
channel [3], device_id[604], ts[5] sf[9], rssi [-29.710344], snr [12.750000], seq [890], skip_seq 0, msg_type=161,ibeacon=5,station_id=6, freq_hz=486600000, freq_offset=-2283
channel [6], device_id[607], ts[5] sf[9], rssi [-33.710346], snr [11.500000], seq [896], skip_seq 0, msg_type=161,ibeacon=5,station_id=6, freq_hz=487200000, freq_offset=-3332
channel [0], device_id[601], ts[5] sf[9], rssi [-28.710344], snr [11.750000], seq [867], skip_seq 0, msg_type=161,ibeacon=5,station_id=6, freq_hz=486000000, freq_offset=-1949
0 74 6 0 0 0 0 6 0 0 0 0 0 64 2 c5 ff 0 0 74 6 0 0 0 0 6 0 0 0 0 0 63 2 c5 ff 0 0 74 6 0 0 0 0 6 0 0 0 0 0 61 2 c3 ff 0 0 74 6 0 0 0 0 6 0 0 0 0 0 65 2 c3 ff 0 0 74 6 0 0 0 0 6 0 0 0 0 0 66 2 c2 ff 0 0 74 6 0 0 0 0 6 0 0 0 0 0 62 2 cb ff 0 0 74 6 0 0 0 0 6 0 0 0 0 0 67 2 c8 ff 0 0 74 6 0 0 0 0 6 0 0 0 0 0 60 2 e0 ff 0 0 74 6 0 0 0 0 6 0 0 0 0 0 5e 2 e2 ff 0 0 74 6 0 0 0 0 6 0 0 0 0 0 5c 2 e3 ff 0 0 74 6 0 0 0 0 6 0 0 0 0 0 5f 2 df ff 0 0 74 6 0 0 0 0 6 0 0 0 0 0 59 2 e4 ff 0 ####time =1610536162 301
payload len=0,station_id=0,g_payload_sos_cnt=0,txrx_node_diff_id_count=5
test node_id=612,drop_rate=0,rssi=-59,snr=9
test node_id=611,drop_rate=0,rssi=-59,snr=8
test node_id=609,drop_rate=0,rssi=-61,snr=9
数据不规则,从中提取有用信息。只有下面这样的数据才是有效数据。数字和英文连接在一起,需要把数字提取出来。
channel [11], device_id[612], ts[5] sf[9], rssi [-59.710346], snr [9.750000], seq [940], skip_seq 0, msg_type=161,ibeacon=5,station_id=6, freq_hz=488200000, freq_offset=-2992
import re
import matplotlib.pyplot as plt
from matplotlib.pyplot import MultipleLocator
import numpy as np
import pandas as pd
MAX_SKIP = 1
ch='613'#device_id
#读取文件
with open('E:\lora\lora_test\lora_8.txt', 'r') as f:
lines = f.readlines()
def count_list(std:list):
from collections import Counter
name=Counter()
for num in std:
name[num]+=1
return name
item_data = []
for line in lines:
if len(line) !=0:#非空判断
comp=re.compile('-?\d+\.*\d*')#筛选出数值 包括负数
string=comp.findall(line)
#print(string)
siz = len(string)
if siz == 13:
str1 = string
if str1[3] == '9': #sf=7 || str1[7] == '11'
item_data.append(str1)
elif str1[3] == '11':
item_data.append(str1)
#print(item_data)
#使用pandas
df = pd.DataFrame(item_data,columns = list(['ch','id','ts','sf','rssi','snr','seq','dr','mt','beacon','st_id','fre','fre_off']))#
print('df',df[df.id == ch])
df = df[df.ch != "15"]
pd.set_option('display.max_rows',None)
#筛选ID 可优化
id_get = df["id"].values
#print('id_get:',id_get)
id_result = []
for i in range(len(id_get)):
if int(id_get[i]) > 600 and int(id_get[i])< 616:#
id_result.append(id_get[i])
c = list(set(id_result))
print("ccc",c)
s2=[]
rssi_average = []
snr_average = []
drop_total=0
drop_t = 0
s10=[]
s11=[]
s_total_drop=0
s_total_pack=0
for j in range(len(c)):
select = df[df.id == c[j]]#不能等于110 需要引号c[j]
seq = select["seq"].values
arr = select["snr"].values#将值提取出来
x = list(map(float, arr))#转化为int
mean = np.mean(x,axis=0)
arr = select["rssi"].values#将值提取出来
x6 = list(map(float, arr))#转化为int
rssi_mean = np.mean(x6,axis=0)
snr_average.append(mean)
rssi_average.append(rssi_mean)
seq = list(map(int, seq))#转化为int
s = 0
drop_total = 0
for i in range(0,len(seq)-1,1):
a = seq[i+1]- seq[i]
if c[j] == ch:
print("###",a,seq[i+1],seq[i],drop_total,(max(seq) - min(seq)))
if a == 0:
continue
elif a >= 2:
drop_total +=a
drop_total -=1
if a > MAX_SKIP:
s+=1
count = (max(seq) - min(seq) + 1)
if (count) == 0:
print("pass id ",c[j])
count = 1
#continue
s2.append(c[j])
s_total_drop +=drop_total
s_total_pack +=count
s11.append(drop_total/count)#total count
s10.append(count - drop_total)#
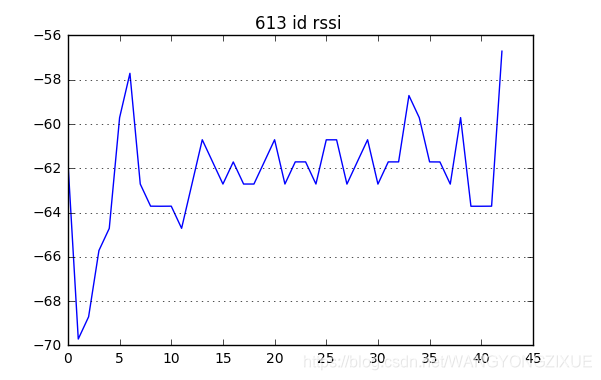
if c[j] == ch:
plt.figure(1)
x_ = np.linspace(0,len(x6)-1,len(x6))
#fig = plt.figure(figsize=(25,25))
plt.plot(x_,x6)
plt.grid(axis='y', linestyle=':')
plt.title("%s id rssi "% c[j])
plt.show()
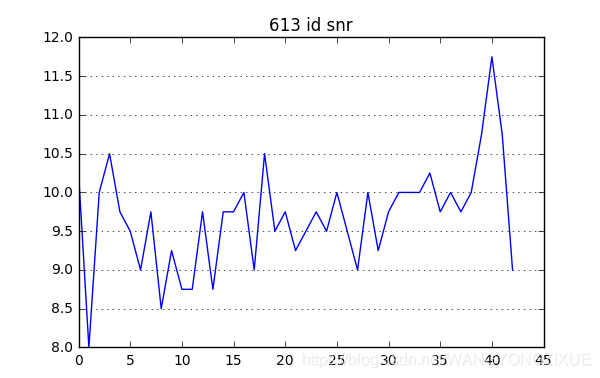
#fig = plt.figure(figsize=(25,25))
plt.plot(x_,x)
plt.grid(axis='y', linestyle=':')
plt.title("%s id snr" % c[j])
plt.show()
drop_rate = s_total_drop/(s_total_pack+1)
print("drop_rate:",s_total_drop,s_total_pack,drop_rate)
提取的有效数据 (部分),根据数据计算出丢包率,snr,rssi平均值和折线图。
df      ch   id ts sf        rssi        snr   seq dr   mt beacon st_id  \
3    12  613  5  9  -61.710346  10.250000   966  0  161      5     6
19   12  613  5  9  -69.710342   8.000000   967  0  161      5     6
35   12  613  5  9  -68.707100  10.000000   968  0  161      5     6
44   12  613  5  9  -65.713585  10.500000   969  0  161      5     6
59   12  613  5  9  -64.713585   9.750000   970  0  161      5     6
71   12  613  5  9  -59.713589   9.500000   971  0  161      5     6
82   12  613  5  9  -57.710346   9.000000   972  0  161      5     6
104  12  613  5  9  -62.710346   9.750000   973  0  161      5     6
122  12  613  5  9  -63.710346   8.500000   974  0  161      5     6
146  12  613  5  9  -63.713589   9.250000   975  0  161      5     6
164  12  613  5  9  -63.710346   8.750000   976  0  161      5     6
188  12  613  5  9  -64.710342   8.750000   977  0  161      5     6
206  12  613  5  9  -62.713589   9.750000   978  0  161      5     6
229  12  613  5  9  -60.710346   8.750000   979  0  161      5     6
248  12  613  5  9  -61.710346   9.750000   980  0  161      5     6
269  12  613  5  9  -62.710346   9.750000   981  0  161      5     6
打印613编号 rssi,snr信号变化情况
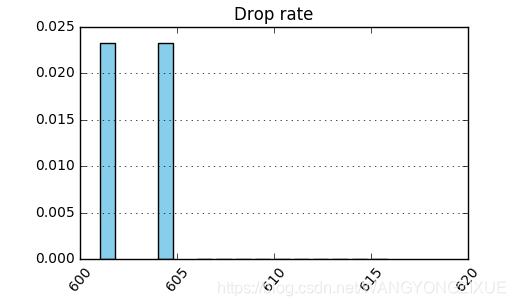
统计丢包率
fig = plt.figure(figsize=(5,3))
ax=plt.gca()
x_major_locator=MultipleLocator(5)
plt.grid(axis='y', linestyle=':') #显示虚线
ax.xaxis.set_major_locator(x_major_locator)
plt.tick_params(axis='x', labelsize=10)#labelsize大小
plt.xticks(rotation=50)#旋转度数
plt.bar(s2,s11,color='SkyBlue')#横纵颠倒
plt.title('Drop rate')
plt.show()
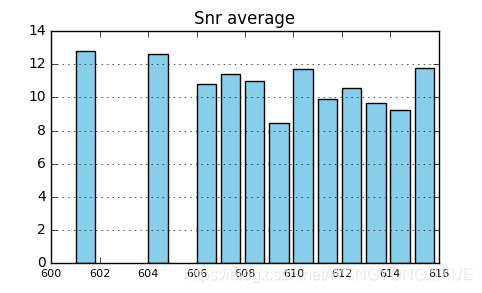
平均值SNR统计
fig = plt.figure(figsize=(5,3))
x_major_locator=MultipleLocator(2)
plt.grid(axis='y', linestyle=':')
ax.xaxis.set_major_locator(x_major_locator)
plt.tick_params(axis='x', labelsize=8)
#plt.xticks(rotation=50)
print('snr',len(s2))
print('snr_average',len(snr_average))
plt.bar(s2,snr_average,color='SkyBlue')#横纵颠倒
plt.title('Snr average')
plt.show()
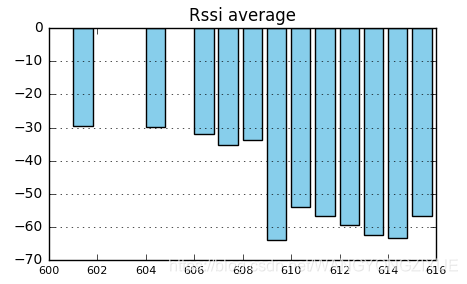
平均值RSSI统计
fig = plt.figure(figsize=(5,3))
plt.grid(axis='y', linestyle=':')
ax.xaxis.set_major_locator(x_major_locator)
plt.tick_params(axis='x', labelsize=8)
#plt.xticks(rotation=50)
plt.bar(s2,rssi_average,color='SkyBlue')#横纵颠倒
plt.title('Rssi average')
plt.show()