option = {
legend: {
},
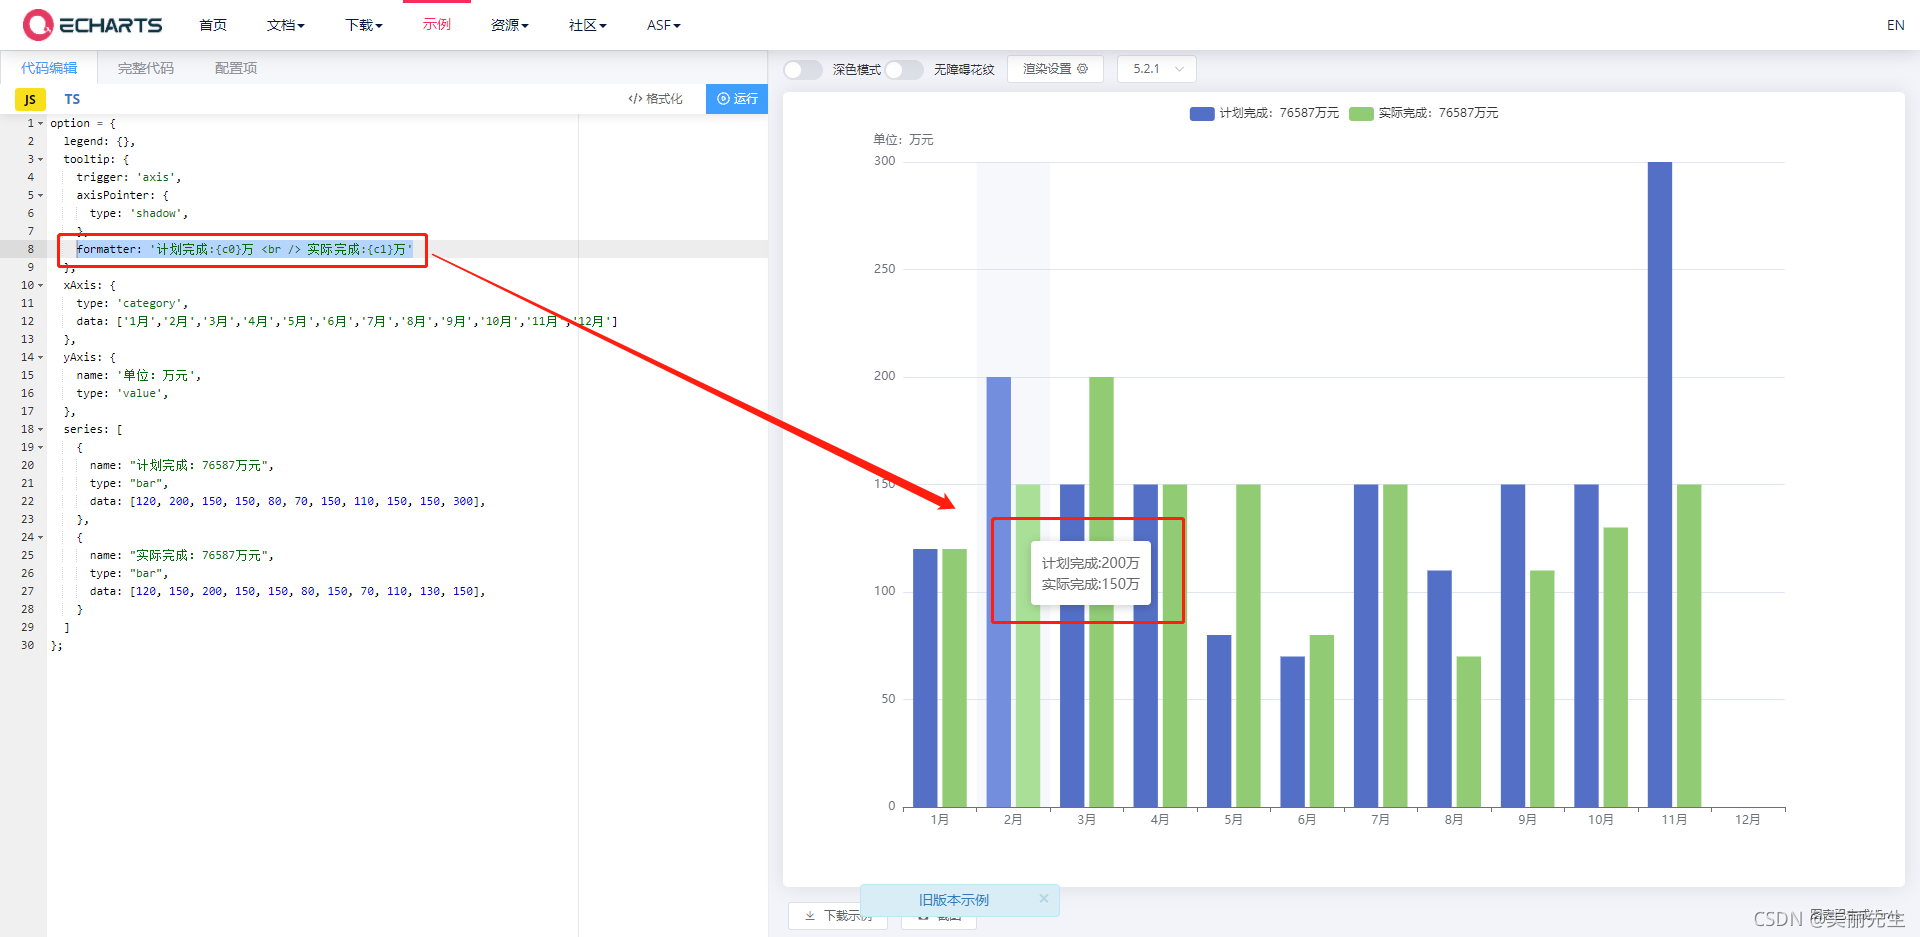
tooltip: {
trigger: 'axis',
axisPointer: {
type: 'shadow',
},
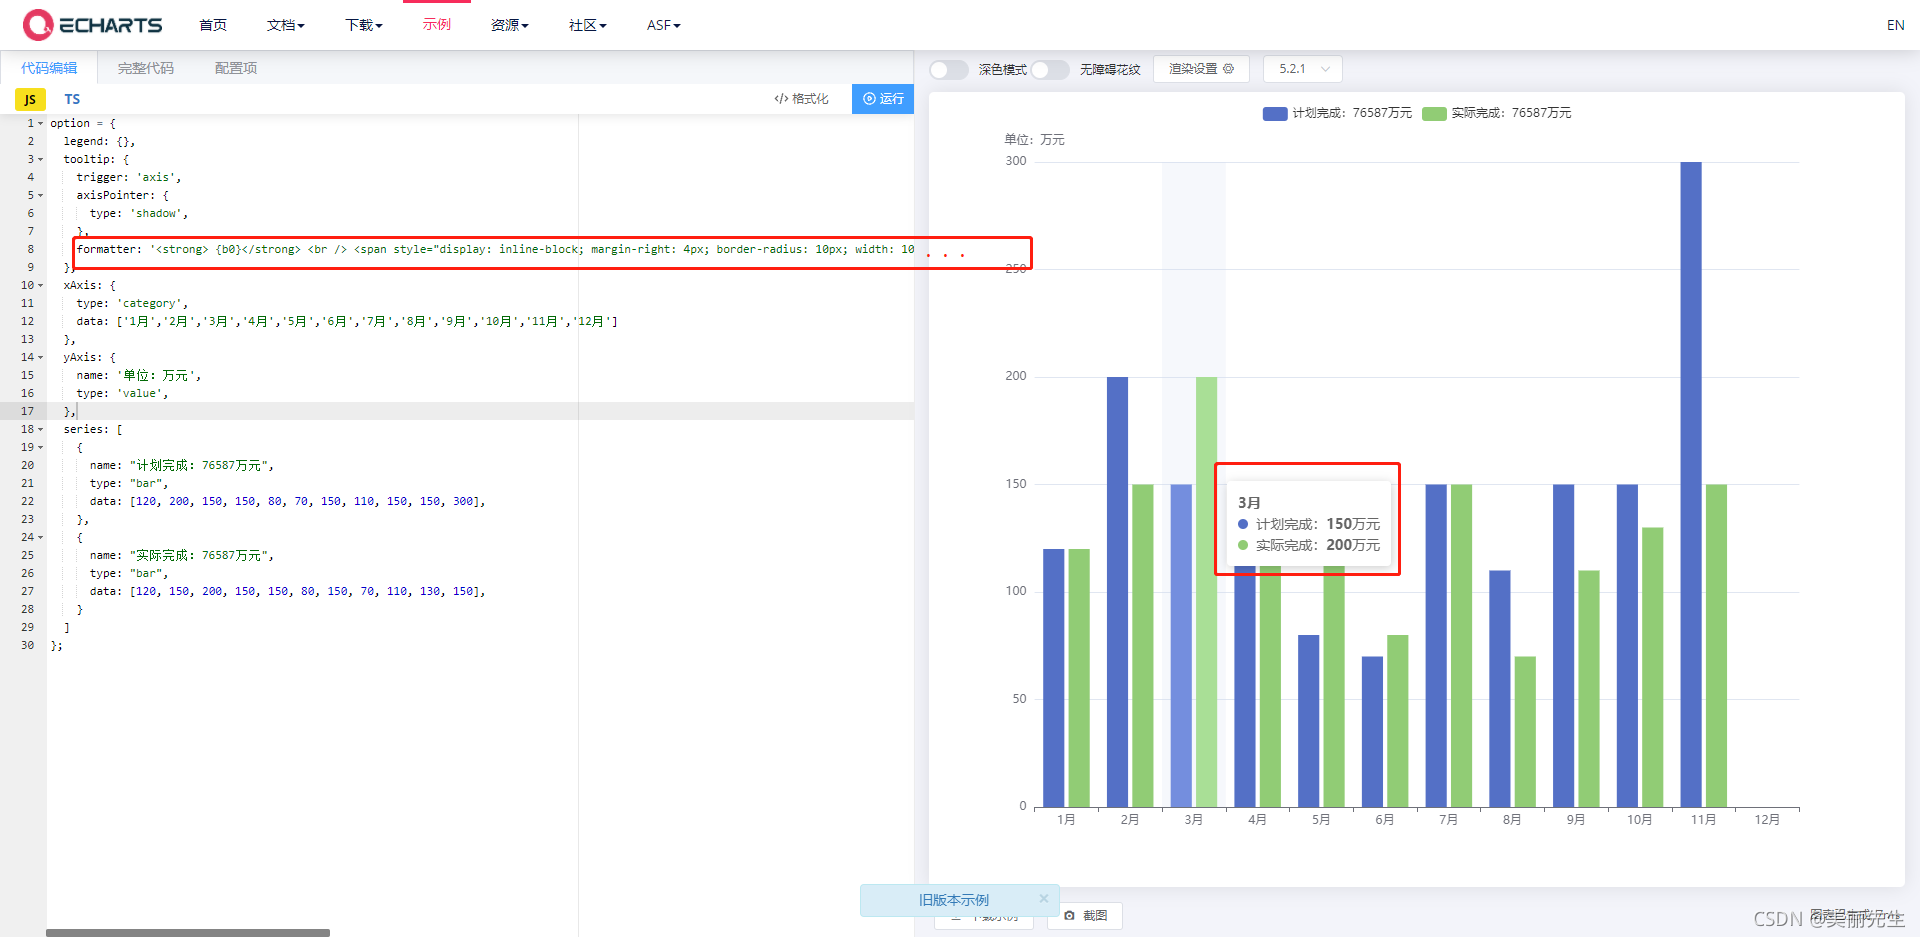
//这里改变样式
formatter: '<strong> {b0}</strong> <br /> <span style="display: inline-block; margin-right: 4px; border-radius: 10px; width: 10px; height: 10px;background-color: #5470c6;"></span> 计划完成:<strong>{c0}</strong>万元 <br /> <span style="display: inline-block; margin-right: 4px; border-radius: 10px; width: 10px; height: 10px;background-color: #91cc75;"></span> 实际完成:<strong>{c1}</strong>万元'
},
xAxis: {
type: 'category',
data: ['1月','2月','3月','4月','5月','6月','7月','8月','9月','10月','11月','12月']
},
yAxis: {
name: '单位:万元',
type: 'value',
},
series: [
{
name: "计划完成:76587万元",
type: "bar",
data: [120, 200, 150, 150, 80, 70, 150, 110, 150, 150, 300],
},
{
name: "实际完成:76587万元",
type: "bar",
data: [120, 150, 200, 150, 150, 80, 150, 70, 110, 130, 150],
}
]
};

option = {


  legend: {

    },
  tooltip: {


    trigger: 'axis',
    axisPointer: {


      type: 'shadow',
    },
    formatter: function(list){


      let str = '123'
      return str
    }
  },
  xAxis: {


    type: 'category',
    data: ['1月','2月','3月','4月','5月','6月','7月','8月','9月','10月','11月','12月']
  },
  yAxis: {


    name: '单位:万元',
    type: 'value',
  },
  series: [
    {


      name: "计划完成:76587万元",
      type: "bar",
      data: [120, 200, 150, 150, 80, 70, 150, 110, 150, 150, 300],
    },
    {


      name: "实际完成:76587万元",
      type: "bar",
      data: [120, 150, 200, 150, 150, 80, 150, 70, 110, 130, 150],
    }
  ]
};