Alertmanager 内部架构
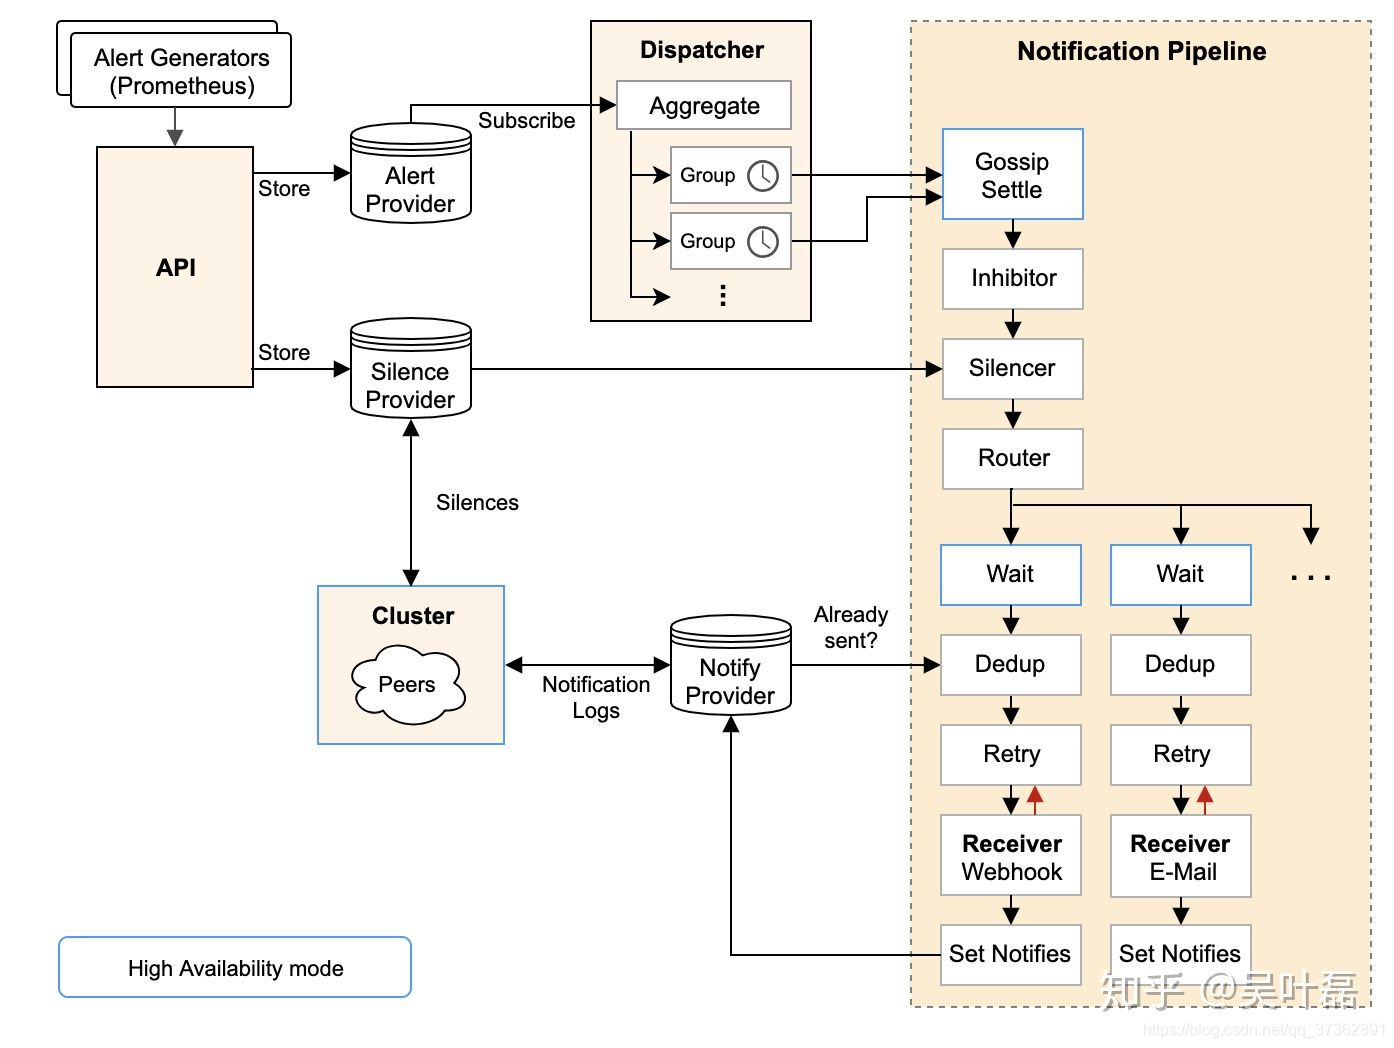
- 先看官方文档中的架构图:

负责处理接受client(例如prometheus)发送的告警消息,包括重复告警的发送、聚合、发给相关人员,并且支持多种方式例如email或者pagerduty这种第三方通知告警平台,同时他还提供了静音以及告警抑制的功能。
实现一个完整的监控体系需要以下几个功能:
- 数据采集(xxx_export)
- 数据抓取(prometheus)
- 数据存储(prometheus/cortex)
- 规则检测并生成告警(prometheus/cotex.ruler)
- 告警处理(alertmanager)
- 告警通知(一般根据自身业务和管理体系实现)
Alertmanager实现了告警处理(聚合、抑制、屏蔽、路由)
配置文件
Alertmanager
global:
  # The smarthost and SMTP sender used for mail notifications.
  smtp_smarthost: 'smtp.qq.com:465'
  smtp_from: '[email protected]'
  smtp_auth_username: '[email protected]'
  smtp_auth_password: 'XXXX'
  # The auth token for Hipchat.
  hipchat_auth_token: '1234556789'
  # Alternative host for Hipchat.
  hipchat_url: 'https://hipchat.foobar.org/'

# The directory from which notification templates are read.
templates:
- '/etc/alertmanager/template/*.tmpl'

# The root route on which each incoming alert enters.
route:
  # The labels by which incoming alerts are grouped together. For example,
  # multiple alerts coming in for cluster=A and alertname=LatencyHigh would
  # be batched into a single group.
  group_by: ['alertname', 'cluster', 'service']

  # When a new group of alerts is created by an incoming alert, wait at
  # least 'group_wait' to send the initial notification.
  # This way ensures that you get multiple alerts for the same group that start
  # firing shortly after another are batched together on the first
  # notification.
  group_wait: 30s

  # When the first notification was sent, wait 'group_interval' to send a batch
  # of new alerts that started firing for that group.
  group_interval: 5m

  # If an alert has successfully been sent, wait 'repeat_interval' to
  # resend them.
  repeat_interval: 3h

  # A default receiver
  receiver: team-X-mails

  # All the above attributes are inherited by all child routes and can
  # overwritten on each.

  # The child route trees.
  routes:
  # This routes performs a regular expression match on alert labels to
  # catch alerts that are related to a list of services.
  - match_re:
      service: ^(foo1|foo2|baz)$
    receiver: team-X-mails
    # The service has a sub-route for critical alerts, any alerts
    # that do not match, i.e. severity != critical, fall-back to the
    # parent node and are sent to 'team-X-mails'
    routes:
    - match:
        severity: critical
      receiver: team-X-pager
  - match:
      service: files
    receiver: team-Y-mails

    routes:
    - match:
        severity: critical
      receiver: team-Y-pager

  # This route handles all alerts coming from a database service. If there's
  # no team to handle it, it defaults to the DB team.
  - match:
      service: database
    receiver: team-DB-pager
    # Also group alerts by affected database.
    group_by: [alertname, cluster, database]
    routes:
    - match:
        owner: team-X
      receiver: team-X-pager
    - match:
        owner: team-Y
      receiver: team-Y-pager


# Inhibition rules allow to mute a set of alerts given that another alert is
# firing.
# We use this to mute any warning-level notifications if the same alert is
# already critical.
inhibit_rules:
- source_match:
    severity: 'critical'
  target_match:
    severity: 'warning'
  # Apply inhibition if the alertname is the same.
  equal: ['alertname', 'cluster', 'service']


receivers:
- name: 'team-X-mails'
  webhook_configs:
  - url: 'http://u2.kugou.net:11770/sendRtxByPost'

- name: 'team-X-pager'
  email_configs:
  - to: '[email protected]'
  pagerduty_configs:
  - service_key: <team-X-key>

- name: 'team-Y-mails'
  email_configs:
  - to: '[email protected]'

- name: 'team-Y-pager'
  pagerduty_configs:
  - service_key: <team-Y-key>

- name: 'team-DB-pager'
  pagerduty_configs:
  - service_key: <team-DB-key>

- name: 'team-X-hipchat'
  hipchat_configs:
  - auth_token: <auth_token>
    room_id: 85
    message_format: html
    notify: true
参数说明
-
global
smtp_smarthost、smtp_from、smtp_auth_username、smtp_auth_password用于设置smtp邮件的地址及用户信息
hipchat_auth_token与安全性认证有关 -
templates
指定告警信息展示的模版 -
route
group_by:指定所指定的维度对告警进行分组
group_wait:指定每组告警发送等待的时间
group_interval:指定告警调度的时间间隔
repeat_interval:在连续告警触发的情况下,重复发送告警的时间间隔 -
receiver
指定告警默认的接受者 -
routes
match_re:定义告警接收者的匹配方式
service:定义匹配的方式,纬度service值以foo1或foo2或baz开始/结束时表示匹配成功
receiver:定义了匹配成功的的情况下的接受者 -
inhibit_rules
定义告警的抑制条件,过滤不必要的告警 -
receivers
定义了具体的接收者,也就是告警具体的方式方式
prometheus
# my global config
global:
  scrape_interval:     15s # By default, scrape targets every 15 seconds.
  evaluation_interval: 15s # By default, scrape targets every 15 seconds.
  # scrape_timeout is set to the global default (10s).

  # Attach these labels to any time series or alerts when communicating with
  # external systems (federation, remote storage, Alertmanager).
  external_labels:
      monitor: 'codelab-monitor'

# Load and evaluate rules in this file every 'evaluation_interval' seconds.
rule_files:
  # - "first.rules"
  # - "second.rules"
  - "alert.rules"
  # - "record.rules"

# A scrape configuration containing exactly one endpoint to scrape:
# Here it's Prometheus itself.
scrape_configs:
  # The job name is added as a label `job=<job_name>` to any timeseries scraped from this config.
  - job_name: 'windows-test'

    # Override the global default and scrape targets from this job every 5 seconds.
    scrape_interval: 1s

    # metrics_path defaults to '/metrics'
    # scheme defaults to 'http'.

    static_configs:
      - targets: ['192.168.3.1:9090','192.168.3.120:9090']

  - job_name: 'windows-chenx'

    # Override the global default and scrape targets from this job every 5 seconds.
    scrape_interval: 3s

    # metrics_path defaults to '/metrics'
    # scheme defaults to 'http'.

    static_configs:
      - targets: ['192.168.3.1:9091']
参数说明:
-
global下的scrape_interval
用于向pushgateway采集数据的频率,上图所示:每隔15秒向pushgateway采集一次指标数据 -
global下的evaluation_interval
表示规则计算的频率,上图所示:每隔15秒根据所配置的规则集,进行规则计算 -
global下的external_labels
为指标增加额外的维度,可用于区分不同的prometheus,在应用中多个prometheus可以对应一个alertmanager -
rule_files
指定所配置规则文件,文件中每行可表示一个规则 -
scrape_configs下的job_name
指定任务名称,在指标中会增加该维度,表示该指标所属的job -
scrape_configs下的scrape_interval
覆盖global下的scrape_interval配置 -
static_configs下的targets
指定指标数据源的地址,多个地址之间用逗号隔开
实操
准备操作
docker-compose.yml文件
version: '3.2'

networks:
    monitor:
        driver: bridge

services:
    prometheus:
        image: prom/prometheus
        container_name: prometheus
        hostname: prometheus
        restart: always
        volumes:
            - /usr/local/src/config/prometheus.yml:/etc/prometheus/prometheus.yml
            - /usr/local/src/config/node_down.yml:/etc/prometheus/node_down.yml
        ports:
            - "9090:9090"
        networks:
            - monitor

    alertmanager:
        image: prom/alertmanager
        container_name: alertmanager
        hostname: alertmanager
        restart: always
        volumes:
            - /usr/local/src/config/alertmanager.yml:/etc/alertmanager/alertmanager.yml
            - /usr/local/src/config/test.tmpl:/etc/alertmanager/test.tmpl
        ports:
            - "9093:9093"
        networks:
            - monitor

    grafana:
        image: grafana/grafana
        container_name: grafana
        hostname: grafana
        restart: always
        ports:
            - "3000:3000"
        networks:
            - monitor

    node-exporter:
        image: quay.io/prometheus/node-exporter
        container_name: node-exporter
        hostname: node-exporter
        restart: always
        ports:
            - "9100:9100"
        networks:
            - monitor

    cadvisor:
        image: google/cadvisor:latest
        container_name: cadvisor
        hostname: cadvisor
        restart: always
        volumes:
            - /:/rootfs:ro
            - /var/run:/var/run:rw
            - /sys:/sys:ro
            - /var/lib/docker/:/var/lib/docker:ro
        ports:
            - "8080:8080"
        networks:
            - monitor
- 配置文件
cd /usr/local/src/config/
- 配置
prometheus.yml
global:
  scrape_interval:     15s # Set the scrape interval to every 15 seconds. Default is every 1 minute.
  evaluation_interval: 15s # Evaluate rules every 15 seconds. The default is every 1 minute.
  # scrape_timeout is set to the global default (10s).

# Alertmanager configuration
alerting:
  alertmanagers:
  - static_configs:
    - targets: ['192.168.56.101:9093']

# Load rules once and periodically evaluate them according to the global 'evaluation_interval'.
rule_files:
   - "node_down.yml"
  # - "second_rules.yml"

# A scrape configuration containing exactly one endpoint to scrape:
# Here it's Prometheus itself.
scrape_configs:
  # The job name is added as a label `job=<job_name>` to any timeseries scraped from this config.
  - job_name: 'prometheus'

    # metrics_path defaults to '/metrics'
    # scheme defaults to 'http'.

    static_configs:
    - targets: ['localhost:9090']
  - job_name: 'springboot_app'
    scrape_interval: 5s
    metrics_path: '/actuator/prometheus'
    static_configs:
      - targets: ['XXXX:8080']
        "labels": {
            "instance": "fast-commmon-prometheus-example",
            "service": "fast-commmon-prometheus-example-service"
        }
- 配置触发规则,
node_down.yml
groups:
- name: node_down
  rules:
  - alert: InstanceDown
    expr: up == 0
    for: 1m
    labels:
      user: test
      severity: major
    annotations:
      summary: "Instance {

   { $labels.instance }} down"
      description: "{

   { $labels.instance }} of job {

   { $labels.job }} has been down for more than 1 minutes."
- 配置告警模版,
test.tmpl
{

   { define "default-monitor.html" }}
{

   { range .Alerts }}
=========start==========<br>
告警程序: prometheus_alert <br>
告警级别: {

   { .Labels.severity }} 级 <br>
告警类型: {

   { .Labels.alertname }} <br>
故障主机: {

   { .Labels.instance }} <br>
告警主题: {

   { .Annotations.summary }} <br>
告警详情: {

   { .Annotations.description }} <br>
告警时间: {

   { (.StartsAt.Add 28800e9).Format "2006-01-02 15:04:05" }} <br>
=========end==========<br>
{

   { end }}
{

   { end }}
webhook通知
- 后端http接口
@RestController
@RequestMapping("alertMessage")
@Slf4j
public class ReceiveAlertMessageController {


    @PostMapping("receive")
    public String receiveMsg(@RequestBody byte[] data) {


        String msg = new String(data, 0, data.length, Charset.forName("UTF-8"));
        log.info("接收AlertManager预警消息:" + msg);
        return "success";
    }
}
- 配置
alertmanager.yml
global:
  resolve_timeout: 5m

route:
  group_by: ['alertname']
  group_wait: 10s
  group_interval: 10s
  repeat_interval: 1h
  receiver: 'web.hook'
receivers:
- name: 'web.hook'
  webhook_configs:
  - url: 'http://XXXX:8888/alertMessage/receive'
inhibit_rules:
  - source_match:
      severity: 'critical'
    target_match:
      severity: 'warning'
    equal: ['alertname', 'dev', 'instance']
- 观察控制台,参数json格式化如下
{
    "receiver":"web\\.hook",
    "status":"firing",
    "alerts":[
        {
            "status":"firing",
            "labels":{
                "alertname":"InstanceDown",
                "instance":"fast-commmon-prometheus-example",
                "job":"springboot_app",
                "service":"fast-commmon-prometheus-example-service",
                "severity":"major",
                "user":"test"
            },
            "annotations":{
                "description":"fast-commmon-prometheus-example of job springboot_app has been down for more than 1 minutes.",
                "summary":"Instance fast-commmon-prometheus-example down"
            },
            "startsAt":"2021-08-03T13:31:24.494Z",
            "endsAt":"0001-01-01T00:00:00Z",
            "generatorURL":"http://prometheus:9090/graph?g0.expr=up+%3D%3D+0\u0026g0.tab=1",
            "fingerprint":"f94d3764ae627a38"
        }
    ],
    "groupLabels":{
        "alertname":"InstanceDown"
    },
    "commonLabels":{
        "alertname":"InstanceDown",
        "instance":"fast-commmon-prometheus-example",
        "job":"springboot_app",
        "service":"fast-commmon-prometheus-example-service",
        "severity":"major",
        "user":"test"
    },
    "commonAnnotations":{
        "description":"fast-commmon-prometheus-example of job springboot_app has been down for more than 1 minutes.",
        "summary":"Instance fast-commmon-prometheus-example down"
    },
    "externalURL":"http://alertmanager:9093",
    "version":"4",
    "groupKey":"{}:{alertname=\"InstanceDown\"}",
    "truncatedAlerts":0
}
email通知
- 配置
alertmanager.yml
global:
  #超时时间
  resolve_timeout: 5m
  #smtp地址需要加端口
  smtp_smarthost: 'smtp.163.com:25'
  smtp_from: '[email protected]'
  #发件人邮箱账号
  smtp_auth_username: '[email protected]'
  #账号对应的授权码(不是密码),163邮箱授权码可以在“设置”里面找到
  smtp_auth_password: 'XXX'
  smtp_require_tls: false

templates:
  - '/etc/alertmanager/test.tmpl'

route:
  group_by: ['alertname']
  group_wait: 10s
  group_interval: 1m
  repeat_interval: 4h
  receiver: 'mail'
receivers:
- name: 'mail'
  email_configs:
  - to: '[email protected]'
    html: '{

   { template "default-monitor.html" . }}'
    headers: { Subject: "[WARN] 报警邮件test" }
-
启动docker-compose脚本
-
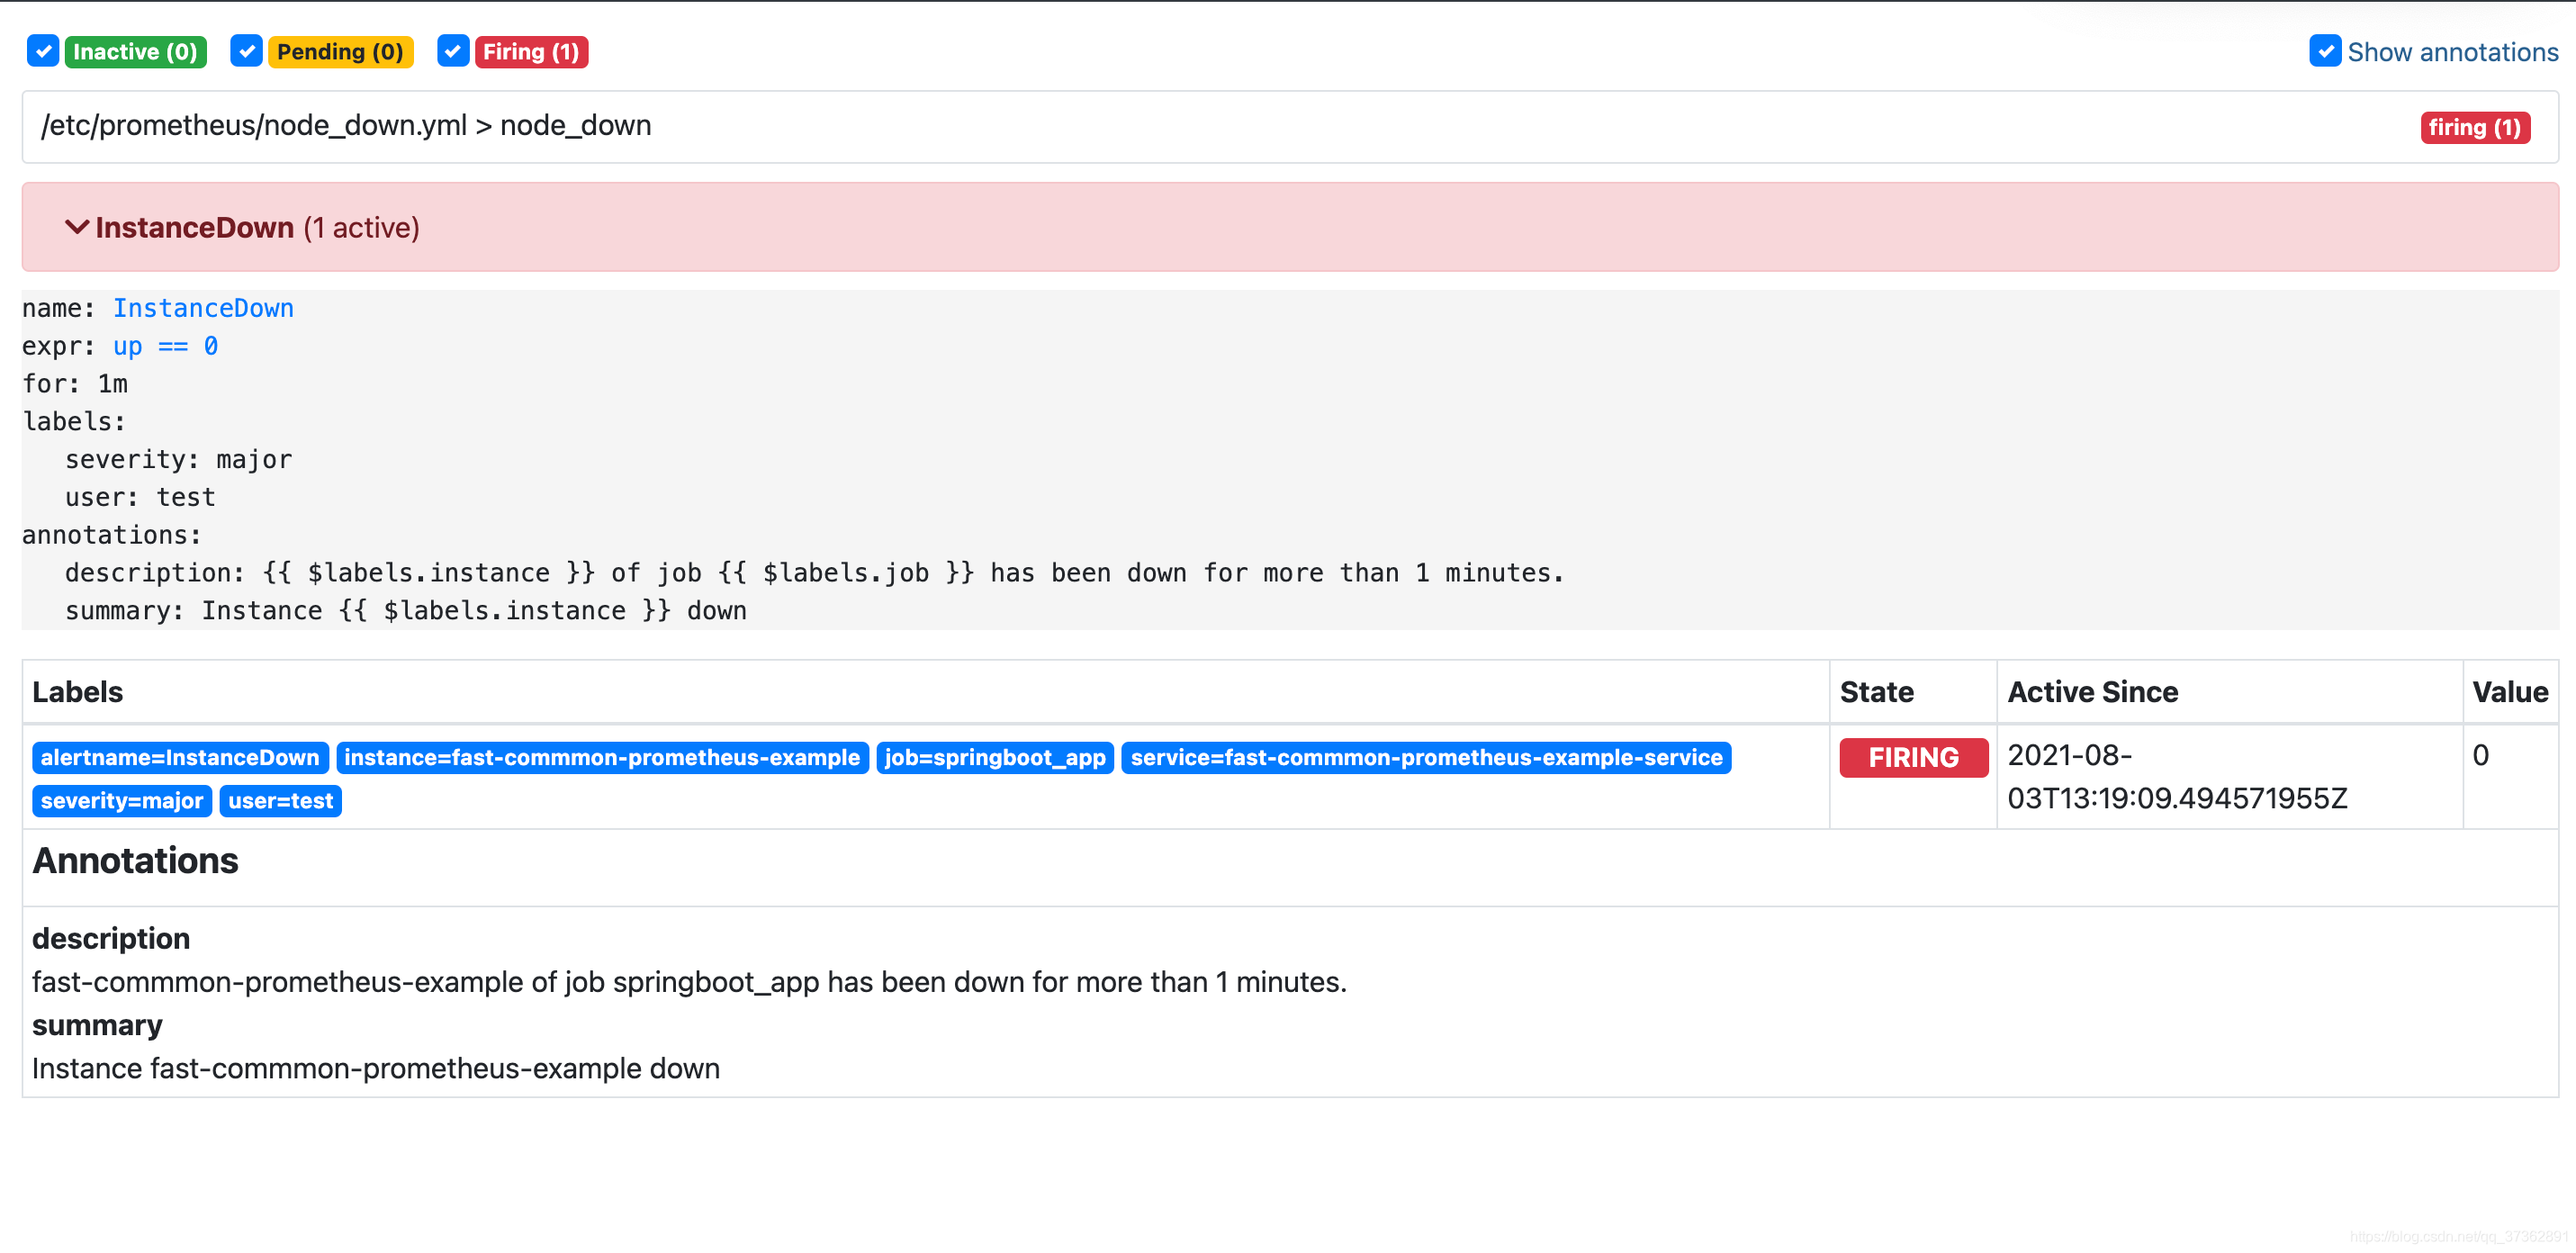
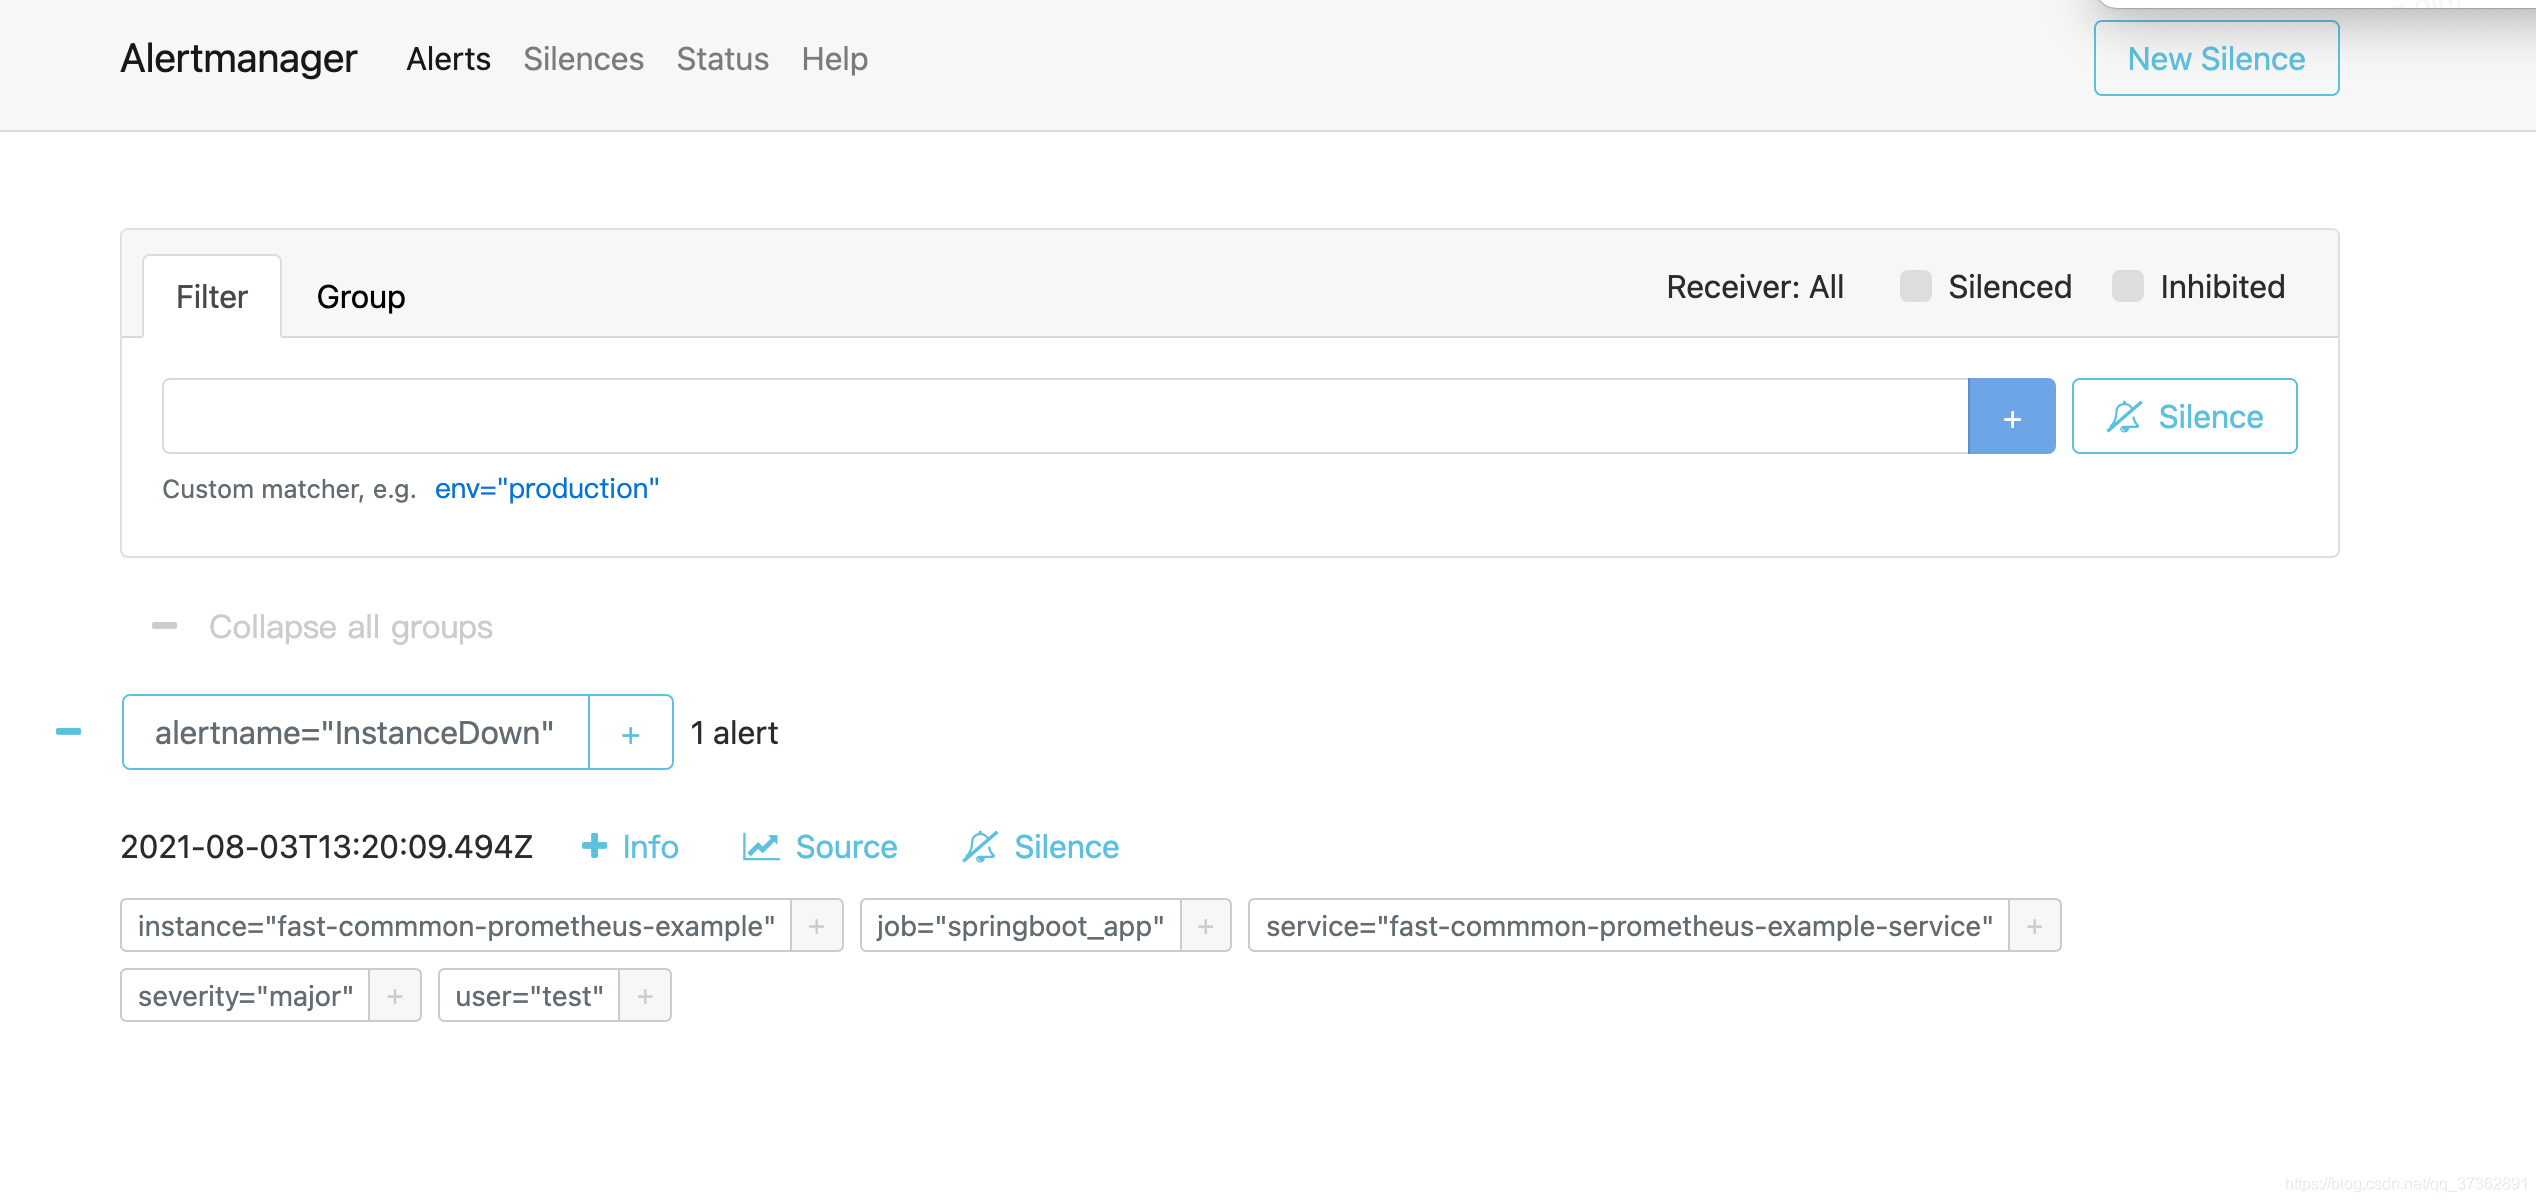
观察prometheus中alert


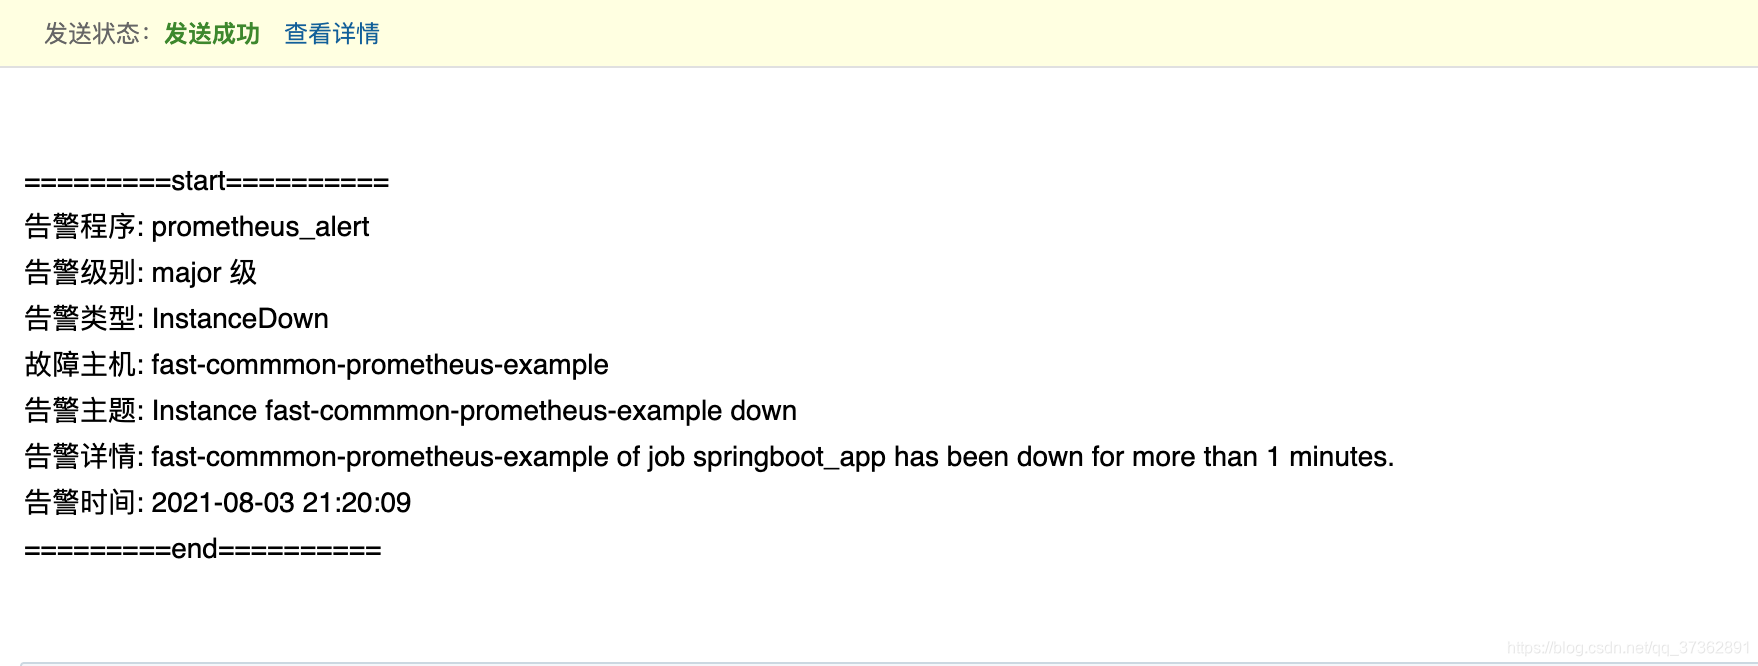
- 查看邮箱
