只需要在指定图像的时候添加:projection='polar'就可以在极坐标上进行绘图了
import matplotlib.pyplot as plt
import numpy as np
import pandas as pd
def draw_polar(series: pd.Series):
"""绘图"""
fig = plt.figure()
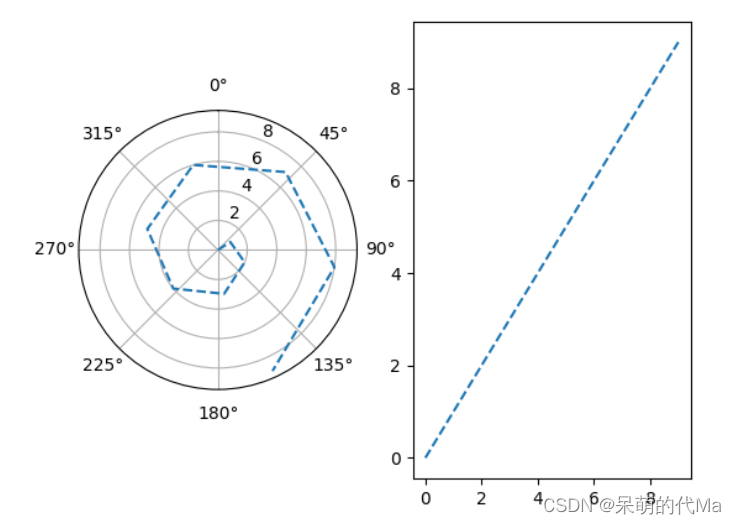
# 在左边绘制极坐标图像
ax1 = fig.add_subplot(1, 2, 1, projection='polar') # 指定绘制极坐标图
ax1.set_theta_direction(-1) # 旋转方向:1(默认)为顺时值方向,-1为逆时针方向
ax1.set_theta_zero_location('N') # 设置0的朝向 N, NW, W, SW, S, SE, E, NE
ax1.plot(series.index, series.values, '--')
# 在右边绘制直角坐标图像
ax2 = fig.add_subplot(1, 2, 2)
ax2.plot(series.index, series.values, '--')
# 展示
plt.show()
if __name__ == '__main__':
series_value = pd.Series(np.arange(0, 10), index=np.arange(0, 10))
draw_polar(series_value)