一、爬虫部分
爬虫说明:
1、本爬虫是以面向对象的方式进行代码架构的
2、本爬虫爬取的数据存入到MongoDB数据库中
3、爬虫代码中有详细注释
代码展示
import re
import time
from pymongo import MongoClient
import requests
from lxml import html

class BaBaiSpider():
    def __init__(self):
        self.start_url = 'https://movie.douban.com/subject/26754233/reviews'
        self.url_temp = 'https://movie.douban.com/subject/26754233/reviews?start={}'
        # 由于豆瓣有ip地址访问的反爬机制 需要登录账户后获取Cookie信息
        # 有条件的可以使用ip代理池
        self.headers = {


            "User-Agent": "Mozilla/5.0 (Windows NT 10.0; WOW64) AppleWebKit/537.36 (KHTML, like Gecko) Chrome/87.0.4280.141 Safari/537.36",
            'Cookie': 'll="118160"; bid=jBJGzgkqoW0; _ga=GA1.2.299310750.1603415173; _vwo_uuid_v2=D02C810B09B328A9291DA2DE0215B1F4E|7b20627b7b4770d357d6251faaad13b7; __yadk_uid=NVdS10Z9dQ70V1AkBBbqmLR6Ny6AQC6R; UM_distinctid=175530c360058f-0cd5eb2121026b-3e604000-144000-175530c3601502; Hm_lvt_19fc7b106453f97b6a84d64302f21a04=1603416111; __utmv=30149280.22554; douban-fav-remind=1; __gads=ID=9b3fe7aa29748925-22a3ff1066c400c6:T=1603618426:RT=1603618426:S=ALNI_MZdkcEBUdorLQd-nNQm0ECaz6aPgQ; __utmc=30149280; __utmc=223695111; ap_v=0,6.0; _pk_ref.100001.4cf6=%5B%22%22%2C%22%22%2C1610800679%2C%22https%3A%2F%2Faccounts.douban.com%2F%22%5D; _pk_ses.100001.4cf6=*; push_doumail_num=0; push_noty_num=0; dbcl2="225547599:+KzDIeqUyH8"; ck=S_qd; __utmt=1; douban-profile-remind=1; __utma=30149280.299310750.1603415173.1610800679.1610803327.13; __utmb=30149280.0.10.1610803327; __utmz=30149280.1610803327.13.11.utmcsr=baidu|utmccn=(organic)|utmcmd=organic|utmctr=%E8%B1%86%E7%93%A3%E7%94%B5%E5%BD%B1; __utma=223695111.299310750.1603415173.1610800679.1610803327.7; __utmb=223695111.0.10.1610803327; __utmz=223695111.1610803327.7.6.utmcsr=baidu|utmccn=(organic)|utmcmd=organic|utmctr=%E8%B1%86%E7%93%A3%E7%94%B5%E5%BD%B1; _pk_id.100001.4cf6=77003652978e8b92.1603415561.6.1610803542.1610797625.'
        }
        # 初始化MongoDB数据库
        self.client = MongoClient()
        self.collection = self.client['test']['babai']

    # 构造列表页url
    def get_url_list(self,total_page):
        return [self.url_temp.format(i*20) for i in range(int(total_page)+1)]

    # 请求并解析url地址
    def parse_url(self,url):
        rest = requests.get(url,headers=self.headers)
        time.sleep(2)
        return rest.content.decode()

    # 获取并解析列表页评论数据
    def get_item(self,str_html):
        new_html = html.etree.HTML(str_html)
        div_list = new_html.xpath('//div[@class="review-list  "]/div')
        # 获取信息多采用三目运算符的方式 防止因获取的内容不存在而报异常
        # 通过三目运算符进行多重判断可以增加程序的稳定性
        for i in div_list:
            item = {

    }
            title = i.xpath('.//div[@class="main-bd"]/h2/a/text()')
            item['评论标题'] = title[0] if len(title)>0 else None
            name = i.xpath('.//a[@class="name"]/text()')
            item['评论人姓名'] = name[0] if len(name)>0 else None
            rate = i.xpath('.//span[contains(@class,"main-title-rating")]/@title')
            item['评价'] = rate[0] if len(rate)>0 else None
            time = i.xpath('.//span[@class="main-meta"]/text()')
            item['评论时间'] = time[0] if len(time) > 0 else None
            favor = i.xpath('.//div[@class="action"]/a[1]/span/text()')
            item['赞成数'] = favor[0].strip() if len(favor)>0 else None
            oppose = i.xpath('.//div[@class="action"]/a[2]/span/text()')
            item['反对数'] = oppose[0].strip() if len(oppose)>0 else None
            reply = i.xpath('.//a[@class="reply "]/text()')
            item['回复数'] = reply[0].split('回应')[0] if len(reply)>0 else None
            star = i.xpath('.//span[contains(@class,"main-title-rating")]/@class')
            item['评论得分'] = re.findall(r'allstar(\d)0 main-title-rating',star[0])[0] if len(star)>0 else None
            print(item)
            self.save(item)

    # 保存评论数据
    def save(self,item):
        self.collection.insert(item)

    def run(self):
        # 获取数据总页码数
        rest = requests.get(self.start_url,headers=self.headers)
        str_html = html.etree.HTML(rest.content.decode())
        total_page= str_html.xpath('//div[@class="paginator"]/a[last()]/text()')[0]
        url_list = self.get_url_list(total_page)
        for url in url_list:
            old_html = self.parse_url(url)
            self.get_item(old_html)

if __name__ == '__main__':
    babai = BaBaiSpider()
    babai.run()
二、数据分析和数据可视化部分
数据分析和数据可视化说明:
1、本博客通过Flask框架来进行数据分析和数据可视化
2、项目的架构图为
代码展示
- 数据分析代码展示(analysis.py)
from pymongo import MongoClient
import pandas as pd
import jieba
import pymysql
from wordcloud import WordCloud
from matplotlib import pyplot as plt
import cv2 as cv
import numpy as np

# 评论标题词云
def word_cloud(df):
    title_list = df['评论标题'].tolist()
    pro_title_list = [' '.join(list(jieba.cut(i))) for i in title_list]
    cut_text = ' '.join(pro_title_list)

    # 读入图片背景
    # 对于中文词云首先使用jieba来中文分词,然后还要记得指定font_path设置字体识别
    # 想要的话还能设置词云的背景图片

    background_image = cv.imread(r'../static/images/love.jpeg')  # 不设置background_image可以不加这行,得到的词云就是矩形了

    word_cloud = WordCloud(font_path="C:/Windows/Fonts/simfang.ttf", mask=background_image,
                          background_color='white').generate(cut_text)
    plt.figure(figsize=(10,10))
    plt.imshow(word_cloud,interpolation="bilinear")
    plt.axis("off")
    # 将词云图保存到静态文件的images目录下 方便后续的展示
    plt.savefig(r'../static/images/wordCount.jpg')
    plt.show()

# 评论数量随时间的变化
def hour_count(df):
    # 按照小时进行分组求出不同时刻的评论数量
    grouped = df.groupby('评论小时')['评论标题'].count().reset_index()
    data = [[i['评论小时'],i['评论标题']] for i in grouped.to_dict(orient='records')]
    print(data)
    return data

# 不同评价星级的数量
def star_count(df):
    # 按照评论星级进行分组求不同星级评价的数量
    grouped = df.groupby('评论得分')['评论标题'].count().reset_index()
    data = [[i['评论得分'],i['评论标题']] for i in grouped.to_dict(orient='records')]
    return data

# 评分均值随时间的变化
def star_avg(df):
    # 将评论小时列数据转换成int类型 方面后续求均值
    df['评论得分'] = df['评论得分'].apply(lambda x:int(x))
    grouped = df.groupby('评论小时')['评论得分'].mean().reset_index()
    data = [[i['评论小时'],round(i['评论得分'],1)] for i in grouped.to_dict(orient='records')]
    return data


if __name__ == '__main__':
    client = MongoClient()
    collection = client['test']['babai']
    comments = collection.find({

    },{

    '_id':0})

    df = pd.DataFrame(comments)
    print(df.info())
    print(df.head(1))

    # 删除评论或评论得分中为NaN的数据
    df.dropna(how='any',inplace=True)

    # 将赞成数、反对数中为空的值转变成0
    df['赞成数'] = df['赞成数'].apply(lambda x:int(x)if len(x)>0 else 0)
    df['反对数'] = df['反对数'].apply(lambda x:int(x)if len(x)>0 else 0)

    # 转换时间类型为pandas时间类型
    df['评论时间'] = pd.to_datetime(df['评论时间'])
    date = pd.DatetimeIndex(df['评论时间'])
    # 增加小时字段
    df['评论小时'] = date.hour

    # 评论标题词云
    # word_cloud(df)

    # 评论数量随时间的变化
    # data = hour_count(df)

    # 不同星级评价的数量
    # data = star_count(df)

    # 评分均值随时间的变化
    data = star_avg(df)


    # 创建数据库连接
    conn = pymysql.connect(host='localhost',user='root',password='123456',port=3306,database='babai',charset='utf8')
    with conn.cursor() as cursor:
        # 评论数量随时间的变化
        # sql = 'insert into db_hour_count(hour,count) values(%s,%s)'

        # 不同星级评价的数量
        # sql = 'insert into db_star_count(star,count) values(%s,%s)'

        # 评分均值随时间的变化
        sql = 'insert into db_star_avg(hour,star_avg) values(%s,%s)'
        try:
            result = cursor.executemany(sql,data)
            if result:
                print('插入数据成功')
                conn.commit()
        except pymysql.MySQLError as error:
            print(error)
            conn.rollback()
        finally:
            conn.close()
- 数据库模型文件展示(models.py)
from . import db

# 时刻与评论数量关系模型
class HourCount(db.Model):
    __tablename__ = 'db_hour_count'
    id = db.Column(db.Integer,primary_key=True,autoincrement=True)
    hour = db.Column(db.Integer,nullable=False)
    count = db.Column(db.Integer,nullable=False)

# 评价星级与评价数量关系模型
class StarCount(db.Model):
    __tablename__ = 'db_star_count'
    id = db.Column(db.Integer,primary_key=True,autoincrement=True)
    star = db.Column(db.Integer,nullable=False)
    count = db.Column(db.Integer,nullable=False)

# 评分均值与随时间关系模型
class StarAvg(db.Model):
    __tablename__ = 'db_star_avg'
    id = db.Column(db.Integer,primary_key=True,autoincrement=True)
    hour = db.Column(db.Integer,nullable=False)
    star_avg = db.Column(db.Float,nullable=False)
- 配置文件代码展示(config.py)
class Config(object):
    SECRET_KEY = 'ma5211314'
    SQLALCHEMY_DATABASE_URI = 'mysql://root:123456@localhost:3306/cateye'
    SQLALCHEMY_TRACK_MODIFICATIONS = True

class DevelopmentConfig(Config):
    DEBUG = True

class ProjectConfig(Config):
    pass

# 采用映射方式方便后续调用配置类
config_map = {


    'develop':DevelopmentConfig,
    'project':ProjectConfig
}
- 主工程目录代码展示(api_1_0/init.py)
from flask import Flask
from flask_sqlalchemy import SQLAlchemy
import pymysql
from config import config_map
# python3的pymysql取代了mysqldb库 为了防止出现 ImportError: No module named ‘MySQLdb’的错误
pymysql.install_as_MySQLdb()

db = SQLAlchemy()
# 采用工厂模式创建app实例
def create_app(mode='develop'):
    app = Flask(__name__)
    # 加载配置类
    config = config_map[mode]
    app.config.from_object(config)

    # 加载数据库
    db.init_app(app)

    # 导入蓝图
    from . import view
    app.register_blueprint(view.blue,url_prefix='/show')

    return app
- 主程序文件代码展示(manager.py)
from api_1_0 import create_app,db
from flask_script import Manager
from flask_migrate import Migrate,MigrateCommand
from flask import render_template

app = create_app()

manager = Manager(app)
Migrate(app,db)

manager.add_command('db',MigrateCommand)

# 首页
@app.route('/')
def index():
    return render_template('index.html')

if __name__ == '__main__':
    manager.run()
- 视图文件代码展示(api_1_0/views/_init_.py,show.py)
_init_.py
from flask import Blueprint
# 为了在主程序运行时能够加载到模型类
from api_1_0 import model
blue = Blueprint('show',__name__)

# 导入定义的视图函数
from . import show
show.py
from . import blue
from api_1_0.models import HourCount,StarCount,StarAvg
from flask import render_template

# 词云图
@blue.route('/drawCloud')
def drawCloud():
    return render_template('drawCloud.html')

# 评论数量随时间的变化折线图和评论均值随时间的变化折线图
@blue.route('/drawLine')
def drawLine():
    hour_count = HourCount.query.all()
    hour_star_avg = StarAvg.query.all()
    # 构造折线图所需数据 两个数组
    hour = [i.hour for i in hour_count]
    count = [i.count for i in hour_count]
    star_avg = [i.star_avg for i in hour_star_avg]

    return render_template('drawLine.html',**locals())

# 不同星级评价的数量占比图
@blue.route('/drawPie')
def drawPie():
    star_count = StarCount.query.all()
    # 构造画饼图所需数据格式数组嵌套字典
    data = [{

    'name':i.star,'value':i.count} for i in star_count]
    return render_template('drawPie.html',**locals())
- 主页展示(index.html)
主页简单创建了三个超链接指向对应的图表
<!DOCTYPE html>
<html lang="en">
<head>
    <meta charset="UTF-8">
    <title>首页说明</title>
    <style>
        .container{


            width: 100%;
            height: 600px;
            padding: 40px;
            line-height: 60px;
        }
        ul{


            margin: auto;
            width: 60%;
        }
    </style>
</head>
<body>
    <div class="container">
        <ul>
            <li><a href="http://127.0.0.1:5000/show/drawCloud" target="_blank"><h3>评论标题词云                                                                                                                                                                                </h3></a></li>
            <li><a href="http://127.0.0.1:5000/show/drawLine" target="_blank"><h3>评论数量随时间的变化折线图&评论均值随时间的变化折线图</h3></a></li>
            <li><a href="http://127.0.0.1:5000/show/drawPie" target="_blank"><h3>不同星级评价的数量占比图</h3></a></li>
        </ul>
    </div>
</body>
</html>

- 模板文件代码展示(drawCloud.html,drawLine.htm,drawPie.html)
drawCloud.html
<!DOCTYPE html>
<html lang="en">
<head>
    <meta charset="UTF-8">
    <title>词云图</title>
    <style>
        .container{


            width: 1000px;
            margin: auto;
            padding-top: 50px;
        }
        img{


            width: 800px;
            height: 600px;
        }

    </style>
</head>
<body>
<div class="container">
	# 图片地址为数据分析中生成的保存的词云图
    <img src="../static/images/wordCount.jpg">
</div>
</body>
</html>

结论:
除了电影和一些常用词之后,英雄、历史、战争的词频最高,所以可以初步判断八佰是以历史战争为题材的电影
drawLine.html
<!DOCTYPE html>
<html lang="en">
<head>
    <meta charset="UTF-8">
    <title>评论数量随时间的变化折线图和评论均值随时间的变化折线图</title>
    <script src="../static/js/echarts.min.js"></script>
    <script src="../static/theme/vintage.js"></script>
    <style>
        .chart_group{


            width: 100%;
            display: flex;
            justify-content: space-between;
            padding: 50px;
            box-sizing: border-box;
        }
    </style>
</head>
<body>
<div class="chart_group">
    <div class="chat1" style="width: 700px;height: 500px"></div>
    <div class="chat2" style="width: 700px;height: 500px"></div>
</div>
<script>
    var myCharts1 = echarts.init(document.querySelector('.chat1'),'vintage')
    var myCharts2 = echarts.init(document.querySelector('.chat2'),'vintage')
    var hour = {

    {

     hour|tojson }}
    var count = {

    {

     count|tojson }}
    var star_avg = {

    {

    star_avg|tojson }}

function getOptions(category,data,title_text,desc){


        var option  = {


        title:{


            text:title_text,
            textStyle:{


                fontFamily:'楷体',
                fontSize:21
            }
        },
        xAxis:{


            type:'category',
            data: category,
            axisLabel:{


                interval:0,
                rotate:40,
                margin:10
            }
        },
        yAxis:{


            type:'value',
            scale:true
        },
        legend:{


            name:[desc],
            top:20
        },
        tooltip:{


          trigger:'axis',
          triggerOn:'mousemove',
          formatter:function(arg){


              return '评论时刻:'+arg[0].name+':00'+'<br>'+'评论数量:'+arg[0].value
          }
        },
        series:[
            {


                name:desc,
                type:'line',
                data:data,
                label:{


                    show:true
                },
                smooth:true,
                markLine:{


                    data:[
                        {


                            name:'平均值',
                            type:'average',
                            label: {


                                show:true,
                                formatter:function(arg)
                                {


                                    return arg.name+':\n'+arg.value
                                }
                            }
                        }
                    ]
                },
                markPoint:{


                    data:[
                        {


                            name:'最大值',
                            type:'max',
                            symbolSize:[40,40],
                            symbolOffset:[0,-20],
                            label:{


                                show:true,
                                formatter:function (arg)
                                {


                                    return arg.name
                                }
                            }
                        },
                        {


                            name:'最小值',
                            type:'min',
                            symbolSize:[40,40],
                            symbolOffset:[0,-20],
                            label:{


                                show:true,
                                formatter:function (arg)
                                {


                                    return arg.name
                                }
                            }
                        }
                    ]
                }
            }
        ]
    }
    return option
    }

    var option1 = getOptions(hour,count,'评论数量随时间的变化','评论数量')
    var option2 = getOptions(hour,star_avg,'评论均值随时间的变化','评论均值')
    myCharts1.setOption(option1)
    myCharts2.setOption(option2)
</script>
</body>
</html>
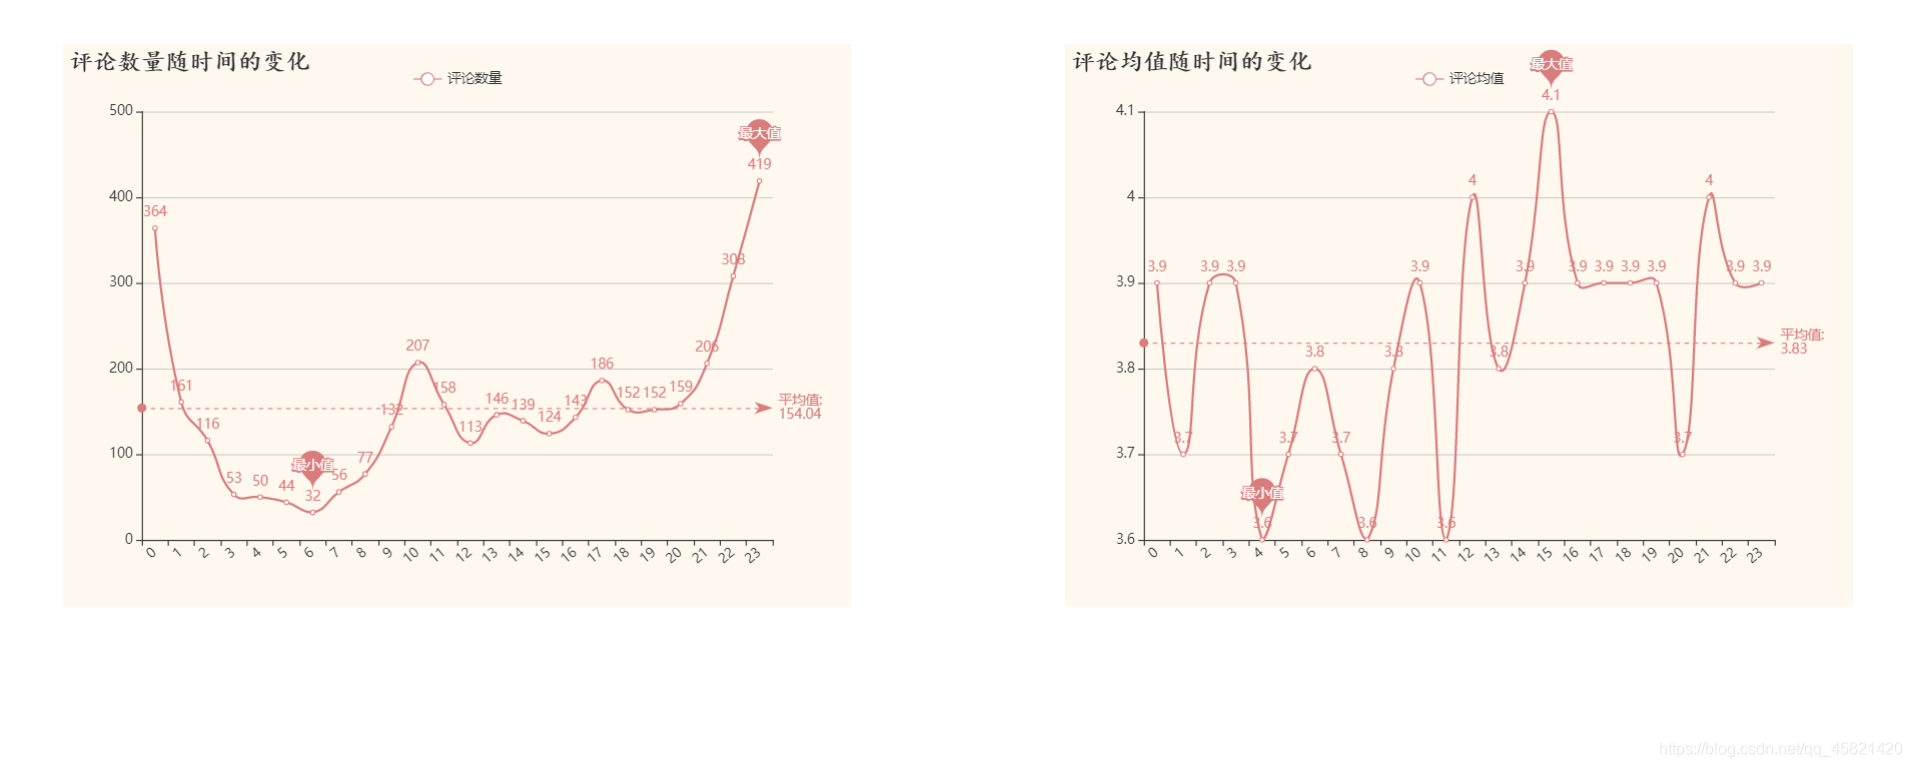
结论:
影迷们大都在21点至凌晨1点左右观影评论,可见影迷们大都是夜猫子,而凌晨1点至中午11点影评的评分普遍低于平均分,熬夜和中午吃饭之前影迷们的大都处在一个心情不大好的状态,所以一点要少熬夜多吃饭
draw.html
<!DOCTYPE html>
<html lang="en">
<head>
    <meta charset="UTF-8">
    <title>不同星级评价的数量占比图</title>
    <script src="../static/js/echarts.min.js"></script>
    <script src="../static/theme/vintage.js"></script>
</head>
<body>
<div class="chat" style="width: 800px;height: 600px;margin: auto"></div>
<script>
    var myCharts = echarts.init(document.querySelector('.chat'),'vintage')
    var data = {

    {

     data|tojson }}
    var option = {


        title:{


            text:'不同星级评价的数量占比',
            textStyle:{


                fontFamily:'楷体',
                fontSize:21
            }
        },
        legend:{


            name:['星级'],
            left:40,
            bottom:40,
            orient:'verticals',
            formatter:function(arg)
            {


                return arg+'星'
            }
        },
        tooltip:{


          trigger:'item',
          triggerOn:'mousemove',
          formatter:function(arg)
          {


              return '评价星级:'+arg.name+'星'+'<br>'+'评价数量:'+arg.value+'<br>'+'评价占比:'+arg.percent+"%"
          },
        },
        series:[
            {


                name:'星级',
                type:'pie',
                data:data,
                label:{


                    show:true,
                    formatter:function (arg)
                    {


                        return arg.name+'星'
                    }
                },
                {

    #roseType:'radius',#} //南丁格尔玫瑰图
                radius:['50%','80%'],
                selectedMode:'multiple',
                selectedOffset:20
            }
        ]
    }
    myCharts.setOption(option)
</script>
</body>
</html>
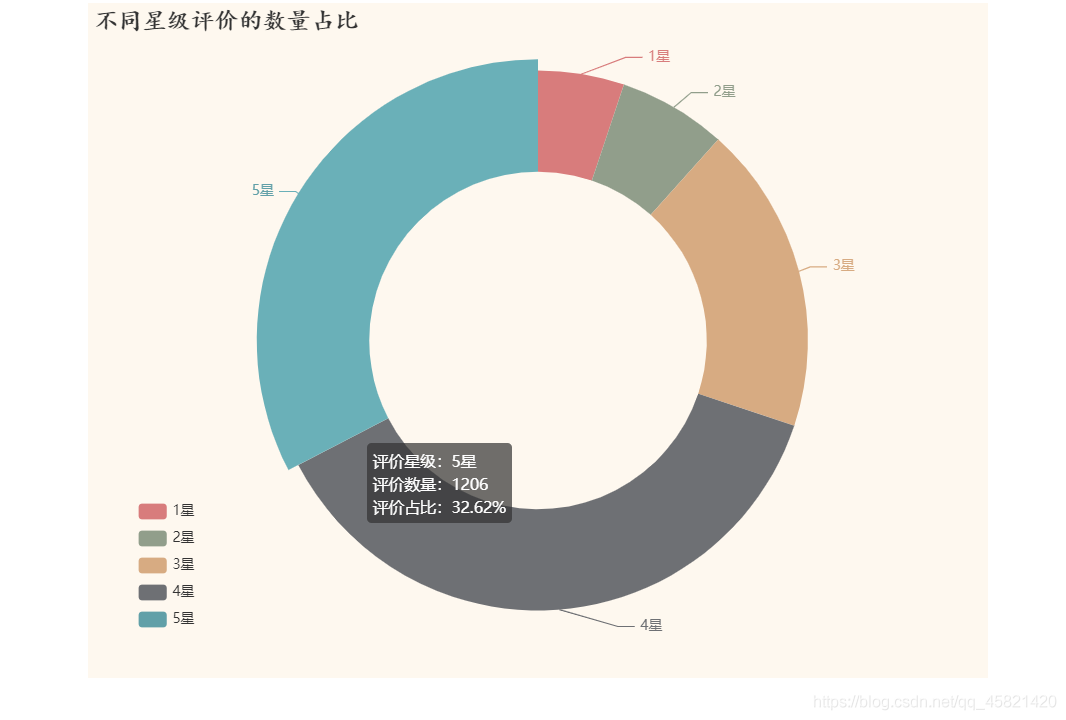
结论:
影迷们对八佰这部电影的评价普遍很高,5星和4星评论占总评分的80%左右,可见这部电影的受欢迎程度。
以下是项目源码,希望能够帮助你们,如有疑问,下方评论
flask项目代码链接