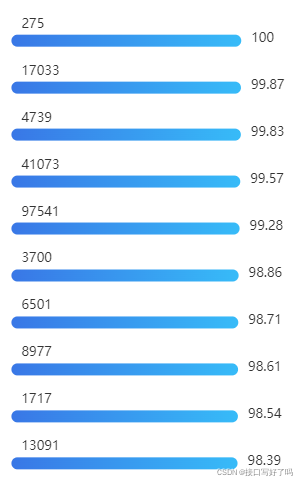
今天遇到的问题是柱状图一个轴有多个柱子,需要其中的一个柱子长度保持在同一个地方,所以需要调整柱子的高度,我就去查了百度,但是没有找到。后来查文档发现也没有找到这个直接设置最大高度的属性,那就只能曲线救国了。
效果图:
上面的大的数字是一根柱子,我给他全部控制在0的位置,然后只显示数字就行了,这就是我的需求

方法:
这里我是用的多轴的玩法,直接把两根柱子分轴对应不同的X轴,然后我再把其中我需要控制长度的柱子的X轴设置max也就是最大刻度是多少。这样就会根据刻度来自适应柱子长短,那我需要他在0的位置,我直接max:2000000000,直接写个20亿,那肯定不会再有这么大的数字了,我这就算是以后图表膨胀到几百万,在20亿面前,他仍然还是在0的附件。
    barGraph(val) {


      console.log(val, "--");
      //初始化图标
      var myCharts = this.$echarts.init(this.$refs["echart-right"]);
      //Y轴的数据,和数据值位置一一对应
      var cate = val.gtcodeArray;
      //数据值,顺序和Y轴的名字一一对应totalCount
      var option = {


        title: {


          text: this.rightname + "合格率排行榜top10",
        },
        tooltip: {


          trigger: "axis",
          axisPointer: {


            type: "shadow",
          },
          // trigger: "item",
          // formatter: function (params) {


          //   return `百分比:${params.data.value}<br/>数量:${params.data.totalCount}`;
          // },
        },
        //图表位置
        grid: {


          left: "3%",
          right: "4%",
          bottom: "3%",
          containLabel: true,
        },
        //X轴
        xAxis: [
          {


            type: "value",
            max:2000000000,
            axisLine: {


              show: false,
            },
            axisTick: {


              show: false,
            },
            //不显示X轴刻度线和数字
            splitLine: {

     show: false },
            axisLabel: {

     show: false },
            boundaryGap: [0, 0.001],
          },
          {


            type: "value",
            axisLine: {


              show: false,
            },
            axisTick: {


              show: false,
            },
            //不显示X轴刻度线和数字
            splitLine: {

     show: false },
            axisLabel: {

     show: false },
            boundaryGap: [0, 0.001],
          },
        ],
        yAxis: {


          type: "category",
          data: cate,
          //升序
          inverse: true,
          splitLine: {

     show: false },
          axisLine: {


            show: false,
          },
          axisTick: {


            show: false,
          },
          //key和图间距
          offset: 10,
          //动画部分
          animationDuration: 300,
          animationDurationUpdate: 300,
          //key文字大小
          nameTextStyle: {


            fontSize: 5,
          },
        },
        series: [
          {


            //柱状图自动排序,排序自动让Y轴名字跟着数据动
            name: "数量",
            type: "bar",
            data: val.totalCountArray,
            barWidth: 12,
            smooth: true,
            valueAnimation: true,
            //Y轴数字显示部分
            label: {


              normal: {


                show: true,
                position: "right",
                valueAnimation: true,
                offset: [5, -2],
                textStyle: {


                  color: "#333",
                  fontSize: 13,
                },
              },
            },
            itemStyle: {


              emphasis: {


                barBorderRadius: 7,
              },
              //颜色样式部分
              normal: {


                barBorderRadius: 7,
                color: new echarts.graphic.LinearGradient(0, 0, 1, 0, [
                  {

     offset: 0, color: "#fff" },
                  {

     offset: 1, color: "#fff" },
                ]),
              },
            },
          },
          {


            //柱状图自动排序,排序自动让Y轴名字跟着数据动
            realtimeSort: true,
            xAxisIndex: 1,
            name: "百分比",
            type: "bar",
            data: val.percentageArray,
            barWidth: 12,
            smooth: true,
            valueAnimation: true,
            //Y轴数字显示部分
            label: {


              normal: {


                show: true,
                position: "right",
                valueAnimation: true,
                offset: [5, -2],
                textStyle: {


                  color: "#333",
                  fontSize: 13,
                },
              },
            },
            itemStyle: {


              emphasis: {


                barBorderRadius: 7,
              },
              //颜色样式部分
              normal: {


                barBorderRadius: 7,
                color: new echarts.graphic.LinearGradient(0, 0, 1, 0, [
                  {

     offset: 0, color: "#3977E6" },
                  {

     offset: 1, color: "#37BBF8" },
                ]),
              },
            },
          },

        ],
        //动画部分

        animationDuration: 0,
        animationDurationUpdate: 3000,
        animationEasing: "linear",
        animationEasingUpdate: "linear",
      };
      myCharts.setOption(option, true);
      //图表大小变动从新渲染,动态自适应
      window.addEventListener("resize", function () {


        myCharts.resize();
      });
    },