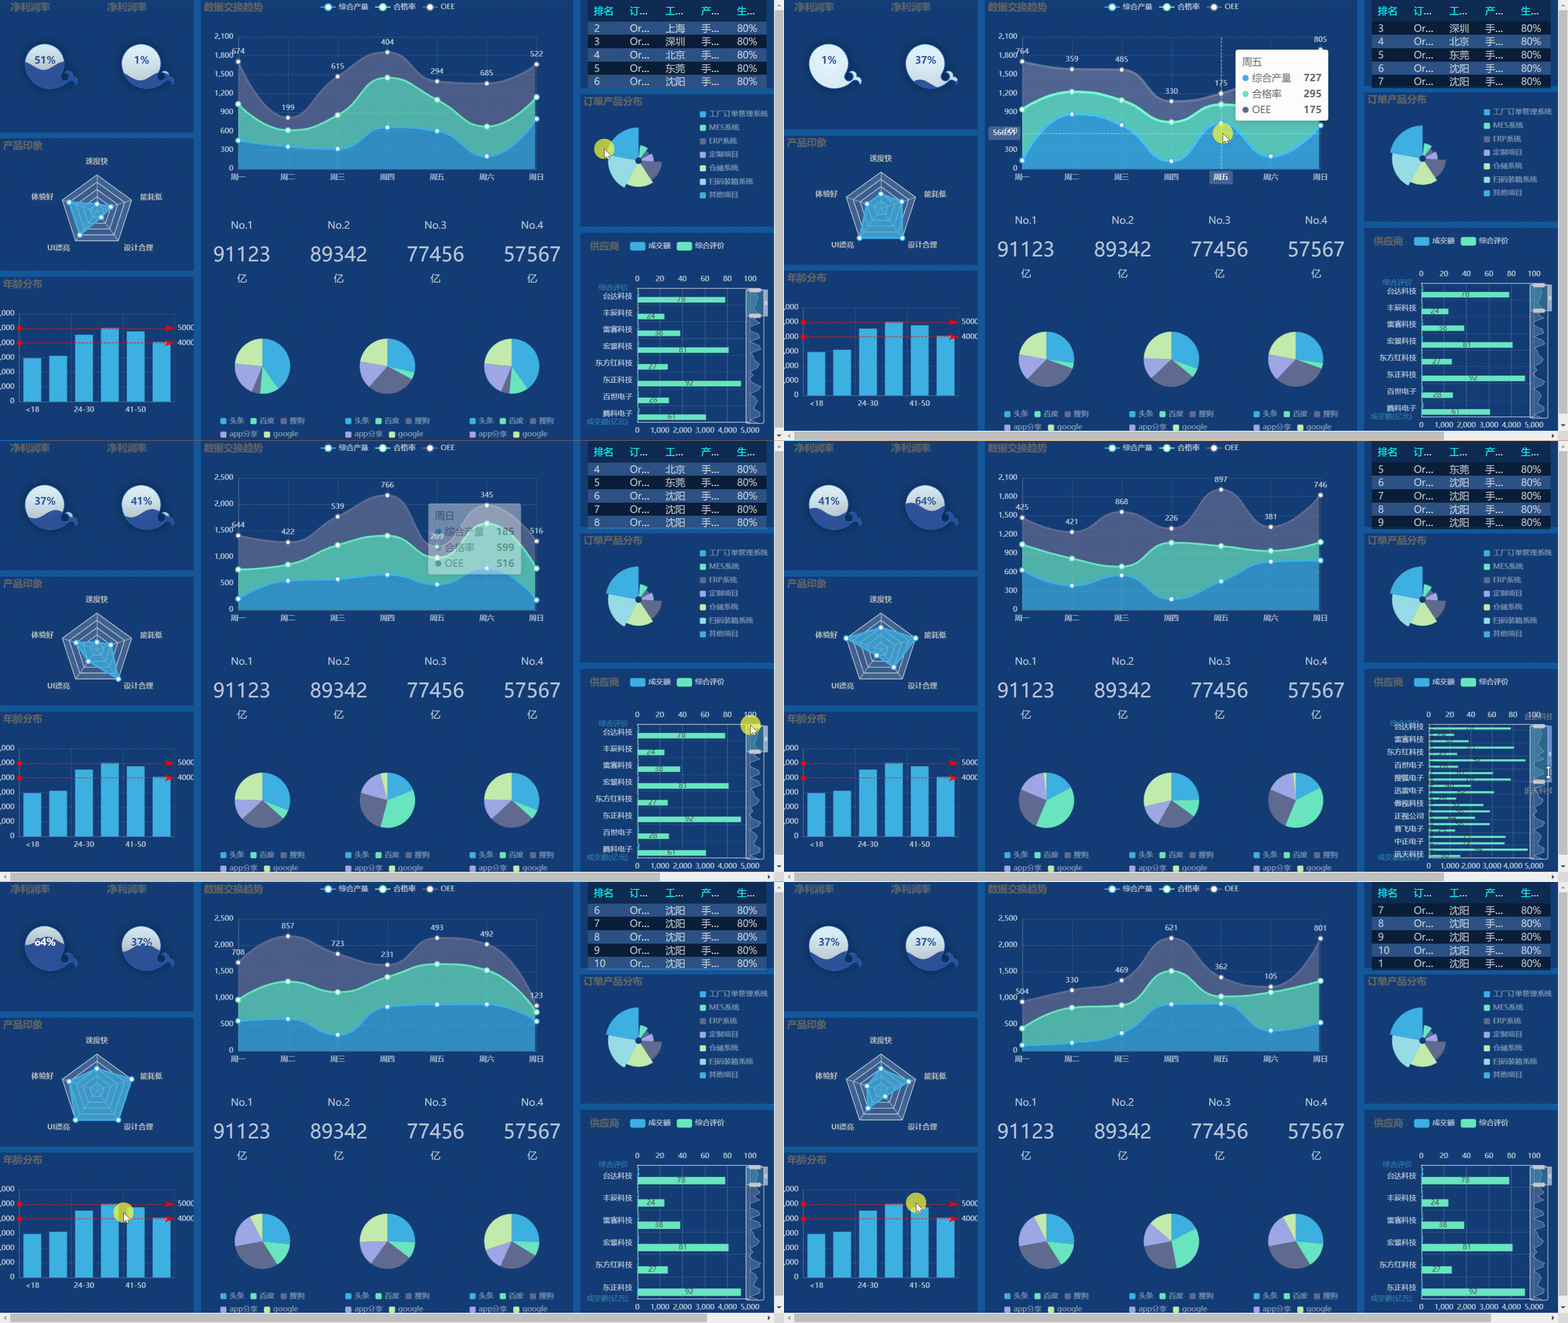
数据可视化大屏的出现,掀起一番又一番的浪潮,众多企业主纷纷想要打造属于自己的“酷炫吊炸天”的霸道总裁大屏驾驶舱。
之前有小伙伴们建议我出一些视频课程来学习Echarts,这样可以更快上手,所以我就追星赶月的录制了《Echarts - 0基础入门课程》,希望对有需要的小伙伴有帮助。
传送门
YYDatav的数据可视化大屏《精彩案例汇总》(Java SpringBoot&Echarts源码)_YYDataV的博客-CSDN博客
28【源码】数据可视化:基于Echarts+JavaSpringBoot动态实时大屏范例-数据分析看板.zip-企业管理文档类资源-CSDN下载
效果图展示
1.动态实时更新数据效果图

2.鼠标右键切换主题


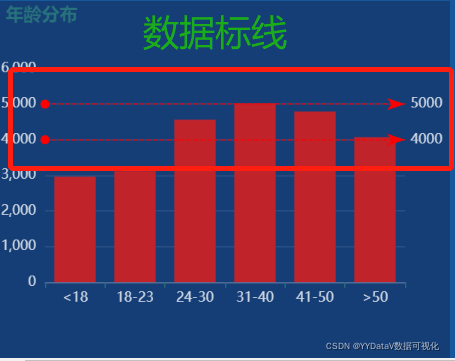
3. 数据标线&视觉映射效果

4. 大数据区域缩放效果

一、 确定需求方案
1、确定产品上线部署的屏幕LED分辨率
本案例基于16:9 屏宽比,F11全屏显示。
2、部署方式
基于免安装可执行程序:支持Windows、Linux、Mac等各种操作系统;将程序复制到服务器上即可,无需其它环境依赖;
观看方式:既可在服务器上直接观看程序界面,也可在远程用浏览器打开播放,例如Chrome浏览器、360浏览器等。
二、整体架构设计
- 前端基于Echarts开源库设计,使用WebStorm编辑器;
- 后端基于Java Web实现,使用 IDEA 编辑器;
- 数据传输格式:JSON;
- 数据源类型:目前采用JSON文件方式,自行添加Mybatis可支持PostgreSQL、MySQL、Oracle、Microsoft SQL Server、SQLite,自行添加POI可支持Excel表格等,还可以定制HTTP API接口方式。
- 数据更新方式:采用http get 轮询方式 。在实际应用中,也可以视情况选择j监测后端数据实时更新,实时推送到前端的方式;
三、编码实现 (关键代码)
1、前端html代码 - 页面布局layout&样式style
<div id="vue_app" class="container-fluid">

          <!-- 外框 在row这里设置样式-->
          <div class="row" style="height: 100%; ">
               <!-- 左侧 -->
               <div class=" col-3" style="height: 100%;">
                    <!-- 左侧第1行 -->
                    <div class="row" id="container_l1"
                         style="height: 30%; background-color:rgb(21,62,119); margin-bottom: 10px;">
                         <div class="col-6" id="container_l1_1" style="height: 100%;"></div>
                         <div class="col-6" id="container_l1_2" style="height: 100%;"></div>
                    </div>
                    <!-- 左侧第2行 -->
                    <div class="row" id="container_l2"
                         style="height: 30%; background-color:rgb(21,62,119); margin-bottom: 10px;">
                    </div>
                    <!-- 左侧第3行 -->
                    <div class="row" id="container_l3" style="height: 38%; background-color:rgb(21,62,119); ">
                    </div>
               </div>
               <!-- 中间 -->
               <div class="col-6" style="height:100%;">
                    <div style="background-color:rgb(21,62,119);">
                         <!-- 中间第一行 -->
                         <div class="row-fluid" id="container_m1" style="height: 48%; margin-bottom: 10px;">
                         </div>
                         <!-- 中间第二行 -->
                         <div class="row" id="container_m2"
                              style="height: 20%; margin-bottom: 10px; color:rgba(255, 255, 255, 0.7); text-align:center">
                              <div class="col-3" id="container_m2_1"></div>
                              <div class="col-3" id="container_m2_2"></div>
                              <div class="col-3" id="container_m2_3"></div>
                              <div class="col-3" id="container_m2_4"></div>
                         </div>
                         <!-- 中间第三行 -->
                         <div class="row" id="container_m3" style="height: 30%; padding: 10px">
                              <div class="col-4" id="container_m3_1" style="height: 100%;"></div>
                              <div class="col-4" id="container_m3_2" style="height: 100%;"></div>
                              <div class="col-4" id="container_m3_3" style="height: 100%;"></div>
                         </div>
                    </div>
               </div>

               <!-- 右侧 -->
               <div class="col-3" style="height:100%;">
                    <!-- 右侧第一行 -->
                    <div class="row" id="container_r1"
                         style="height: 20%; background-color:rgb(21,62,119); margin-bottom: 10px; ">
                         <dv-scroll-board :config="config" />
                    </div>
                    <!-- 右侧第二行 -->
                    <div class="row" id="container_r2"
                         style="height: 30%; background-color:rgb(21,62,119); margin-bottom: 10px; ">

                    </div>
                    <!-- 右侧第三行 -->
                    <div class="row" id="container_r3"
                         style="height: 48%;  padding: 10px; background-color:rgb(21,62,119); ">

                    </div>
               </div>
          </div>
     </div>
2、前端JS代码 - 数据定时更新控制
支持在每个echarts图表中独立控制定时更新的间隔。
 // 定时1s执行数据更新函数
  setInterval(function () {
    async_echart_bar_horizontal(
      container,
      path_bar_horizontal + "bar_horizontal.json"
    );
  }, 1000);
3、后端Java代码
@RestController
@RequestMapping("/json")
public class Process {

    @RequestMapping("/{filename}")
    public String json(@PathVariable("filename") String filename) throws Exception {
        System.out.println(filename);
        ChangeJSON(filename);

        String jsonStr = readJSON(filename);
        System.out.println(jsonStr);
        return jsonStr;
    }
4、数据通信 JSON
[
    {
        "name": "<18",
        "value": 2962
    },
    {
        "name": "18-23",
        "value": 3119
    },
    {
        "name": "24-30",
        "value": 4562
    },
    {
        "name": "31-40",
        "value": 5024
    },
    {
        "name": "41-50",
        "value": 4791
    },
    {
        "name": ">50",
        "value": 4073
    }
]
四、开发配置&代码结构说明
数据可视化:基于 Echarts +Java SpringBoot 实现的动态实时大屏【Java开发环境搭建】
五. 运行效果

六、更多案例
YYDatav的数据可视化大屏《精彩案例汇总》(Python&Echarts源码)_YYDataV的博客-CSDN博客
《工厂订单出入库信息管理系统》完整案例详解(含演示网址账号)(Go&Vue源码)_YYDataV的博客-CSDN博客
本次分享结束,欢迎讨论!QQ微信同号: 6550523