0 声音处理基础专业名词
FT - 傅立叶变换FT(Fourier Transform) 时域频域转换,此链接讲的很清晰。

FFT - 快速傅里叶变换 (fast Fourier transform):计算机计算DFT
DTFT - 离散时间傅立叶变换:时域离散,频域连续

DFT-离散傅立叶变换:时域离散,频域也离散时域离散,频域连续
相当于对时域的连续信号进行抽样(等间隔采样)后,再进行傅立叶变换。(FFT DFT DTDF 的关系 可视化原理 此链接讲的很清晰) IFT IFFT IDFT ...为逆变换

STFT - 短时傅里叶变换short-time Fourier transform:在信号做傅里叶变换之前乘一个时间有限的窗函数 h(t),并假定非平稳信号在分析窗的短时间隔内是平稳的,通过窗函数 h(t)在时间轴上的移动,对信号进行逐段分析得到信号的一组局部“频谱”。STFT对声音处理很重要,可以生成频谱图,详细原理此STFT链接讲的很清晰。
MFCC - 梅尔频率倒谱系数。 此MFCC链接讲的很清晰。梅尔频率:梅尔频率是一种给予人耳对等距的音高变化的感官判断而定的非线性频率刻度。它与频率赫兹的关系为:

倒谱:是一种信号的频谱经过对数运算后再进行傅里叶反变换得到的谱。

DCT-离散余弦变换 Discrete Cosine Transform:不同频率振荡的余弦函数之和来表示数据点的有限序列。

幅度谱、相位谱、能量谱等语音信号处理中的基础知识_IMU_YY的博客-CSDN博客_幅度谱

1 简介
1.1 什么是阵列麦克风
麦克风阵列是由一定数目的麦克风组成,对声场的空间特性进行采样并滤波的系统。目前常用的麦克风阵列可以按布局形状分为:线性阵列,平面阵列,以及立体阵列。其几何构型是按设计已知,所有麦克风的频率响应一致,麦克风的采样时钟也是同步的。
1.2 麦克风阵列的作用
麦克风阵列一般用于:声源定位,包括角度和距离的测量,抑制背景噪声、干扰、混响、回声,信号提取,信号分离。其中声源定位技术利用麦克风阵列计算声源距离阵列的角度和距离,实现对目标声源的跟踪。
2 acoular库
2.1 安装
安装可以通过pip安装。
pip install acoular也可以源码安装,github下载,进入文件夹。
python setup.py install进入python环境检查安装。
import acoular
acoular.demo.acoular_demo.run()
出现64阵列麦克风与三个模拟声援范例,安装成功。

3 二维定位
首先准备阵列麦克风的xml配置文件。就改麦格风个数与空间坐标。
<?xml version="1.0" encoding="utf-8"?>
<MicArray name="array_64">
	<pos Name="Point 	1	" x="	0.4	" y="	-0.1	" z="	0	"/>
	<pos Name="Point 	2	" x="	0.2	" y="	0	" z="	0	"/>
	<pos Name="Point 	3	" x="	0.1	" y="	0.1	" z="	0	"/>
	<pos Name="Point 	4	" x="	-0.4	" y="	0.4	" z="	0	"/>
	<pos Name="Point 	5	" x="	-0.2	" y="	0	" z="	0	"/>
	<pos Name="Point 	6	" x="	-0.1	" y="	-0.2	" z="	0	"/>
</MicArray> 准备这个麦克风的录音文件,如果有的是USB阵列麦克风,首先连接上再查对应的麦克风ID。
import numbers
import pyaudio
#//cat /proc/asound/devices

p=pyaudio.PyAudio()
info=p.get_host_api_info_by_index(0)
numberdevices=info.get('deviceCount')
for i in range(0,numberdevices):
    if(p.get_device_info_by_host_api_device_index(0,i).get('maxInputChannels'))>0:
        print('INPUT DVEICES ID:',i,"-",p.get_device_info_by_host_api_device_index(0,i).get('name'))
录音,保存格式为wav(wav为一般音频文件处理格式) 需要调节采样率等参数
from chunk import Chunk
from ctypes import sizeof
import numbers
import pyaudio
import argparse
import numpy as np
#//cat /proc/asound/devices
import wave
import  cv2
p=pyaudio.PyAudio()

def recode_voice(micid):#打开麦 设置数据流格式

#调节rate channels    stream=p.open(format=pyaudio.paInt16,channels=6,rate=16000,input=True,frames_per_buffer=8000,input_device_index=micid)
    return stream


if  __name__ == '__main__':
    paser=argparse.ArgumentParser(description="This bin is for recode the voice by wav,you need input the micid!")
    paser.add_argument('micid',type=int,help="the ID of mic device!")
    args=paser.parse_args()
    stream=recode_voice(args.micid)
    stream:pyaudio.Stream
    frames=[]
    i=0
    while(i<20):
        i+=1
        print('开始录音!')
        data=stream.read(8000,exception_on_overflow=False)
        audio_data=np.fromstring(data,dtype=np.short)  #转numpy获取最大值
        # print(len(audio_data))  #8000一记录 chunk块
        temp=np.max(np.abs(audio_data))     #显示每8000个的最大数值
        print("当前最大数值:",temp)
        frames.append(data)
print('停止录音!')
wf=wave.open("./recordV.wav",'wb')
wf.setnchannels(1)
wf.setsampwidth(p.get_sample_size(pyaudio.paInt16))
wf.setframerate(16000)
wf.writeframes(b''.join(frames))
wf.close
有了wav格式文件,转H5文件,acoular库需要h5音频格式。需要改文件名,对应采样率。
from sys import byteorder
import wave
import tables
import scipy.io.wavfile as wavfile

name_="你的音频文件名"
samplerate,data=wavfile.read(name_+'.wav')
# fs=wave.open(name_+'.wav')

meh5=tables.open_file(name_+".h5",mode="w")
meh5.create_earray('/','time_data',obj=data)
meh5.set_node_attr('/time_data','sample_freq',16000)
到这里H5格式的音频文件,xml配置文件都准备好,利用acoular库定位音源。
import acoular
import pylab as plt
from os import path


micgeofile = path.join('/home/......./array_6.xml')#############输入麦格风文件

rg = acoular.RectGrid( x_min=-1, x_max=1, y_min=-1, y_max=1, z=0.3, increment=0.01 )#画麦克风的网格大小

mg = acoular.MicGeom( from_file=micgeofile )   #读麦位置

ts = acoular.TimeSamples( name='memory.h5' ) ###########输入h5

print(ts.numsamples)
print(ts.numchannels)
print(ts.sample_freq)

print(ts.data)
ps = acoular.PowerSpectra( time_data=ts, block_size=128, window='Hanning' )#分帧加窗

plt.ion() # switch on interactive plotting mode
print(mg.mpos[0],type(mg.mpos))
plt.plot(mg.mpos[0],mg.mpos[1],'o')
plt.show()
plt.waitforbuttonpress()
env=acoular.Environment(c=346.04)
st = acoular.SteeringVector( grid=rg, mics=mg ,env=env)#用单源传输模型实现转向矢量的基本类

bb = acoular.BeamformerBase( freq_data=ps, steer=st )#波束形成在频域采用基本的延迟和和算法。

pm = bb.synthetic( 2000, 2 )

Lm = acoular.L_p( pm )

plt.figure() # open new figure

plt.imshow( Lm.T, origin='lower', vmin=Lm.max()-0.1,extent=rg.extend())

plt.colorbar()

plt.waitforbuttonpress()
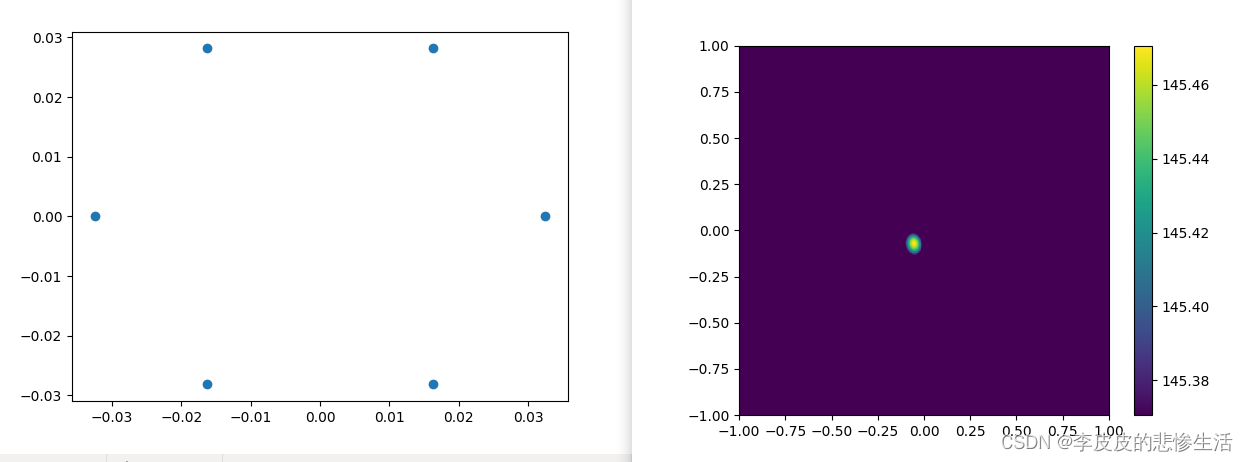
运行效果

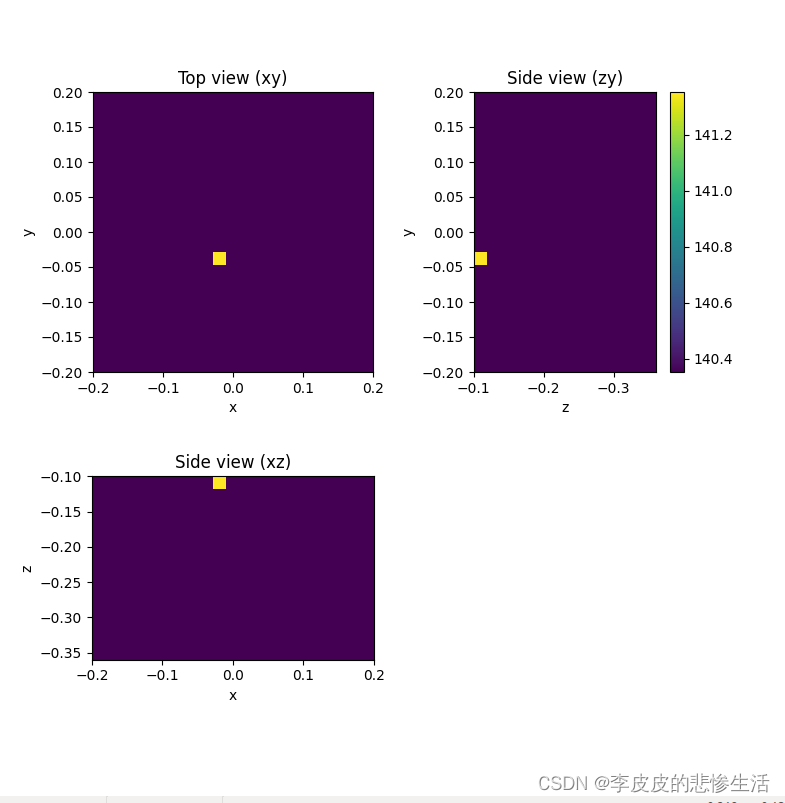
三维定位(三维定位要慢一些)改xml,h5路径。还有分辨率,分贝范围可以调节
# -*- coding: utf-8 -*-
"""
Example "3D beamforming" for Acoular library.

Demonstrates a 3D beamforming setup with point sources.

Simulates data on 64 channel array,
subsequent beamforming with CLEAN-SC on 3D grid.

Copyright (c) 2019 Acoular Development Team.
All rights reserved.
"""
from os import path

# imports from acoular
import acoular
from acoular import __file__ as bpath, L_p, MicGeom, PowerSpectra,\
RectGrid3D, BeamformerBase, BeamformerCleansc, \
SteeringVector, WNoiseGenerator, PointSource, SourceMixer

# other imports
from numpy import mgrid, arange, array, arccos, pi, cos, sin, sum
import mpl_toolkits.mplot3d
from pylab import figure, show, scatter, subplot, imshow, title, colorbar,\
xlabel, ylabel

#===============================================================================
# First, we define the microphone geometry.
#===============================================================================

micgeofile = path.join('/home/sunshine/桌面/code_C_PY_2022/py/7.acoular库mvdr实现音源定位/array_6.xml')
# generate test data, in real life this would come from an array measurement
m = MicGeom( from_file=micgeofile )

#===============================================================================
# Now, the sources (signals and types/positions) are defined.
#===============================================================================
# sfreq = 51200
# duration = 1
# nsamples = duration*sfreq

# n1 = WNoiseGenerator( sample_freq=sfreq, numsamples=nsamples, seed=1 )
# n2 = WNoiseGenerator( sample_freq=sfreq, numsamples=nsamples, seed=2, rms=0.5 )
# n3 = WNoiseGenerator( sample_freq=sfreq, numsamples=nsamples, seed=3, rms=0.25 )
# p1 = PointSource( signal=n1, mics=m,  loc=(-0.1,-0.1,0.3) )
# p2 = PointSource( signal=n2, mics=m,  loc=(0.15,0,0.17) )
# p3 = PointSource( signal=n3, mics=m,  loc=(0,0.1,0.25) )
# pa = SourceMixer( sources=[p1,p2,p3])


#===============================================================================
# the 3D grid (very coarse to enable fast computation for this example)
#===============================================================================

g = RectGrid3D(x_min=-0.2, x_max=0.2,
               y_min=-0.2, y_max=0.2,
               z_min=0.1, z_max=0.36,
               increment=0.02)

#===============================================================================
# The following provides the cross spectral matrix and defines the CLEAN-SC beamformer.
# To be really fast, we restrict ourselves to only 10 frequencies
# in the range 2000 - 6000 Hz (5*400 - 15*400)
#===============================================================================
pa = acoular.TimeSamples( name='memory.h5' ) #读h5
f = PowerSpectra(time_data=pa,
                 window='Hanning',
                 overlap='50%',
                 block_size=128,
                 ind_low=5, ind_high=16)
st = SteeringVector(grid=g, mics=m, steer_type='true location')
b = BeamformerCleansc(freq_data=f, steer=st)

#===============================================================================
# Calculate the result for 4 kHz octave band
#===============================================================================

map = b.synthetic(2000,2)#

#===============================================================================
# Display views of setup and result.
# For each view, the values along the repsective axis are summed.
# Note that, while Acoular uses a left-oriented coordinate system,
# for display purposes, the z-axis is inverted, plotting the data in
# a right-oriented coordinate system.
#===============================================================================

fig=figure(1,(8,8))

# plot the results

subplot(221)
map_z = sum(map,2)
mx = L_p(map_z.max())
imshow(L_p(map_z.T), vmax=mx, vmin=mx-1, origin='lower', interpolation='nearest',
       extent=(g.x_min, g.x_max, g.y_min, g.y_max))
xlabel('x')
ylabel('y')
title('Top view (xy)' )

subplot(223)
map_y = sum(map,1)
imshow(L_p(map_y.T), vmax=mx, vmin=mx-1, origin='upper', interpolation='nearest',
       extent=(g.x_min, g.x_max, -g.z_max, -g.z_min))
xlabel('x')
ylabel('z')
title('Side view (xz)' )

subplot(222)
map_x = sum(map,0)
imshow(L_p(map_x), vmax=mx, vmin=mx-1, origin='lower', interpolation='nearest',
       extent=(-g.z_min, -g.z_max,g.y_min, g.y_max))
xlabel('z')
ylabel('y')
title('Side view (zy)' )
colorbar()


# plot the setup

# ax0 = fig.add_subplot((224), projection='3d')
# ax0.scatter(m.mpos[0],m.mpos[1],-m.mpos[2])
# source_locs=array([p1.loc,p2.loc,p3.loc]).T
# ax0.scatter(source_locs[0],source_locs[1],-source_locs[2])
# ax0.set_xlabel('x')
# ax0.set_ylabel('y')
# ax0.set_zlabel('z')
# ax0.set_title('Setup (mic and source positions)')

# only display result on screen if this script is run directly
if __name__ == '__main__': show()
