之前在网上搜,找不到好的保存方法,这里介绍一下:
# seaborn中文乱码解决方案
from matplotlib.font_manager import FontProperties
myfont=FontProperties(fname=r'C:\Windows\Fonts\simhei.ttf',size=20)
sns.set(font=myfont.get_name(), color_codes=True)
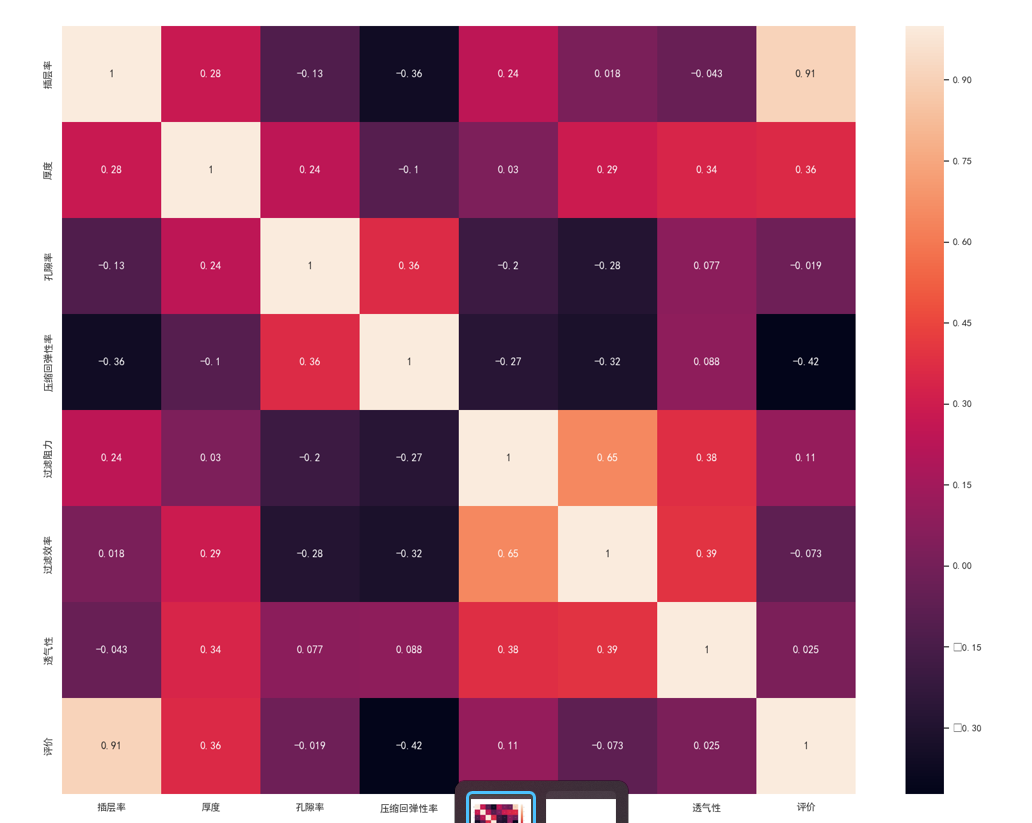
chazhi66_corr = chazhi66.corr(method="spearman")#计算相关性系数
plt.figure(figsize=(20,15))#figsize可以规定热力图大小
fig=sns.heatmap(chazhi66_corr,annot=True,fmt='.2g')#annot为热力图上显示数据;fmt='.2g'为数据保留两位有效数字
fig
fig.get_figure().savefig('chazhi66_corr.png')#保留图片
保存图片的核心话语:
fig.get_figure().savefig('chazhi66_corr.png')#保留图片
生成的图片: