php-fpm监控需要通过nginx服务。因此需要开启相关配置。
php-fpm如果是yum安装的,那么在/etc/php-fpm.d/www.config中编辑如下选项:
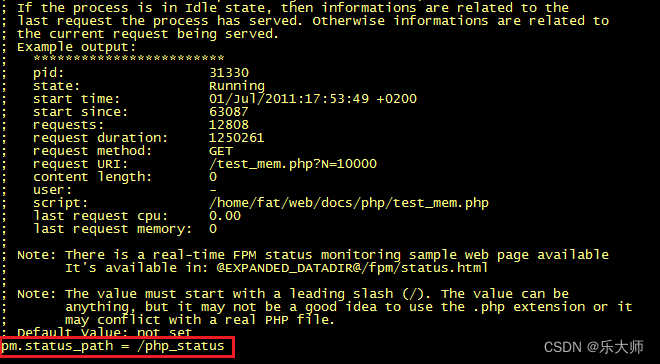
pm.status_path = /php_status
保存并退出编辑。重启php-fpm服务。
接下来编辑nginx配置项。编辑如下:
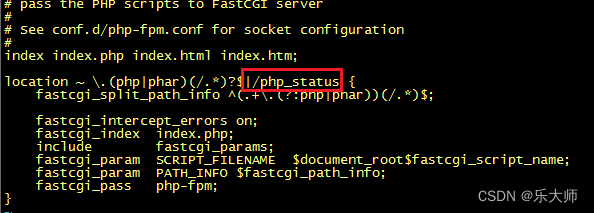
location ~ \.(php|phar)(/.*)?$|/php_status {
... ...
}
红字部分是新增部分,如果之前php已经在nginx 中配置。
保存退出,并重启nginx服务。
使用curl命令看看php-fpm输出的状态,命令如下:
curl http://127.0.0.1/php_status
注:命令运行在php和nginx运行的主机内。

从输出内容看,给出的状态值并不丰富。如果想要获得更丰富的数据,只需要稍作修改。如下:
curl http://127.0.0.1/php_status?full
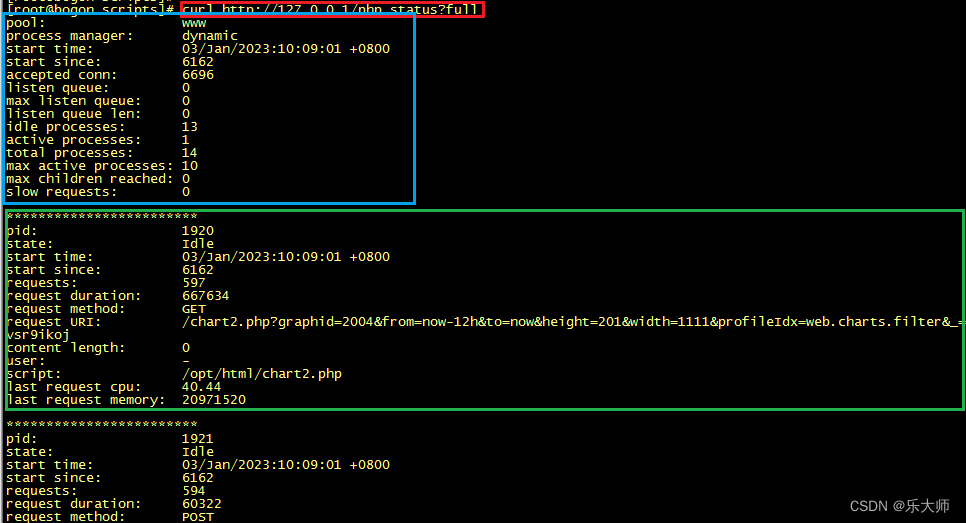
从图中,我们看到,除了之前的状态值,还输出了每个pid中运行时的一些状态。
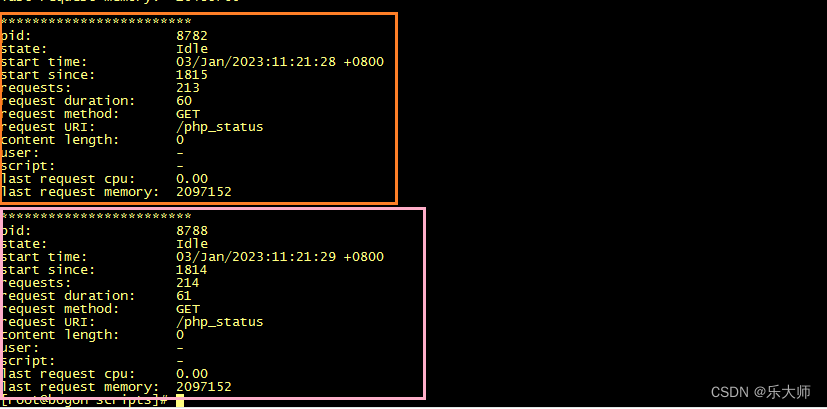
看最后输出的部分,可以得知最后执行的内容就是我们刚才调取php-fpm状态的URI。
服务配置完毕,下一步是编写脚本。
这里给出一个脚本范例。
#!/bin/bash
php_status_fun(){
NGINX_PORT=$1
NGINX_COMMAND=$2
php_active(){
/usr/bin/curl "http://127.0.0.1:"$NGINX_PORT"/php_status" 2> /dev/null | grep 'active processes' |head -1 | awk '{print $3}'
}
php_total(){
/usr/bin/curl "http://127.0.0.1:"$NGINX_PORT"/php_status" 2> /dev/null | grep 'total processes' | awk '{print $3}'
}
php_max(){
/usr/bin/curl "http://127.0.0.1:"$NGINX_PORT"/php_status" 2> /dev/null | grep 'max active processes' | awk '{print $4}'
}
php_children(){
/usr/bin/curl "http://127.0.0.1:"$NGINX_PORT"/php_status" 2> /dev/null | grep 'max children reached' | awk '{print $4}'
}
php_listen(){
/usr/bin/curl "http://127.0.0.1:"$NGINX_PORT"/php_status" 2> /dev/null | grep 'listen queue len'| awk '{print $4}'
}
php_maxlisten(){
/usr/bin/curl "http://127.0.0.1:"$NGINX_PORT"/php_status" 2> /dev/null | grep 'max listen queue' | awk '{print $4}'
}
php_accepted(){
/usr/bin/curl "http://127.0.0.1:"$NGINX_PORT"/php_status" 2> /dev/null | grep 'accepted conn' | awk '{print $3}'
}
php_slow(){
/usr/bin/curl "http://127.0.0.1:"$NGINX_PORT"/php_status" 2> /dev/null | grep 'slow requests' | awk '{print $3}'
}
case $NGINX_COMMAND in
active)
php_active;
;;
total)
php_total;
;;
maxactive)
php_max;
;;
children)
php_children;
;;
listen)
php_listen;
;;
maxlisten)
php_maxlisten;
;;
accepted)
php_accepted;
;;
slow)
php_slow;
;;
*)
echo "$NGINX_COMMAND"
;;
esac
}
main (){
case $1 in
php_status)
php_status_fun $2 $3;
;;
*)
echo $"Usage: $0 {php_status key}"
esac
}
main $1 $2 $3
这个脚本与之前编写监控nginx服务的脚本类似。
下一步修改zabbix_agent.conf,添加如下:
UserParameter=php_status[*],/bin/bash /opt/scripts/php_status.sh $1 $2 $3
保存退出。登录zabbix管理平台,编辑模板以及item,graphs。
之前写过mysql监控制作模板、item、graphs。这里简化只给出一个item制作的截图示例。
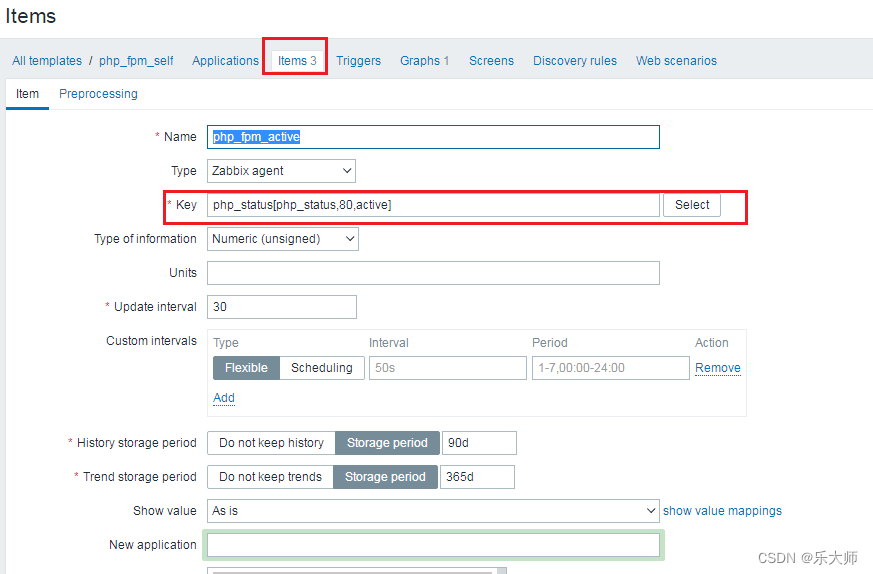
最后模板添加到主机内,大功告成。