在github上下载了一个项目:安装debug版本会产生两个apk,一个是apk本身,一个是Leaks
release版本就正常 不会产生这个问题,百思不得其解,第一次遇到这个问题。
看到这篇博客豁然开朗:在build.gradle.kts 里有如下配置:
// memory leak analysis
debugImplementation("com.squareup.leakcanary:leakcanary-android:2.10")
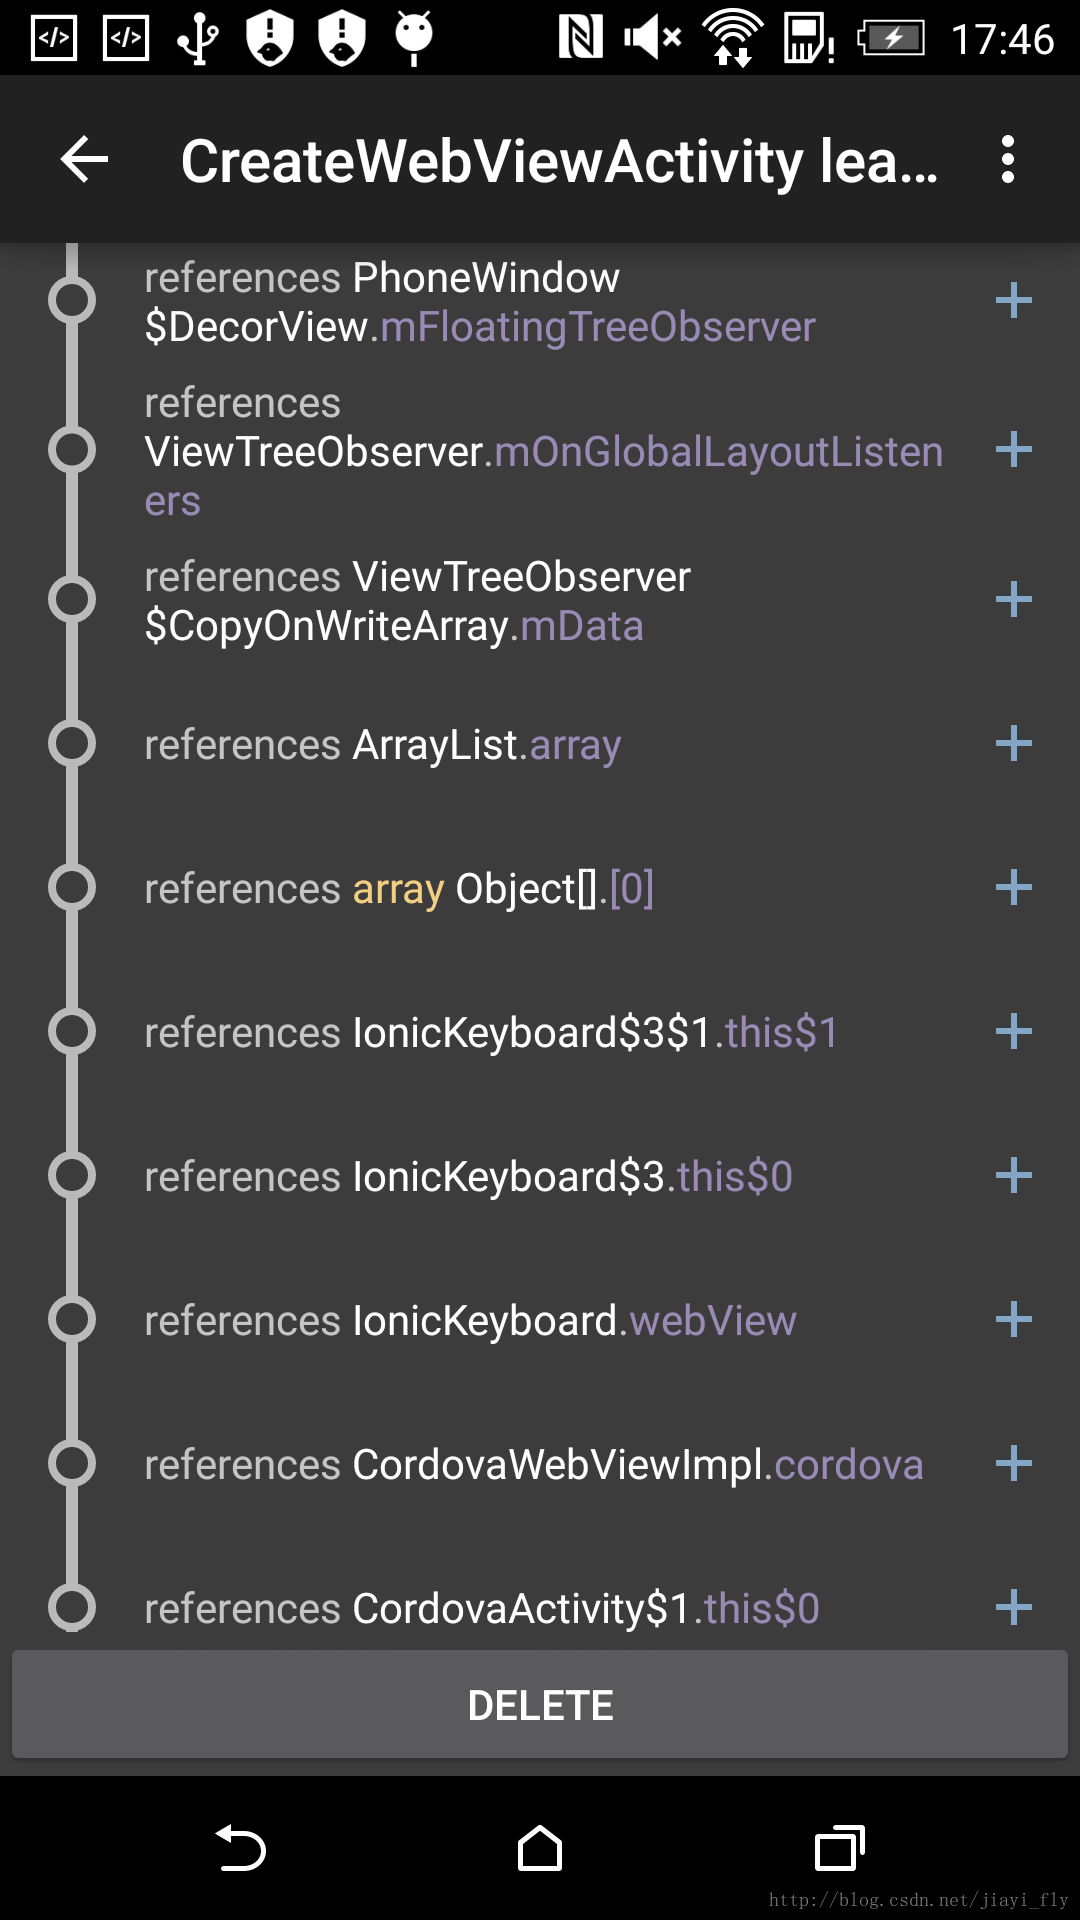
当安装包为debug包时,Leakcanary会自动运行, 如果出现内存泄漏的情况,会在页面有提示, 点开桌面上Leaks图标,可以看到内存泄漏详情,会显示具体哪个Acitivity发生泄漏
前文:
在软件开发中,最头疼一件事就是内存了,有时候几个问题掌握不好就会报出OOM的错误,所以推荐给大家一个监测OOM的方法。
用法:
1、gradle:
dependencies {
    debugCompile 'com.squareup.leakcanary:leakcanary-android:1.5.1'
    releaseCompile 'com.squareup.leakcanary:leakcanary-android-no-op:1.5.1'
    testCompile 'com.squareup.leakcanary:leakcanary-android-no-op:1.5.1'
        }
2、Application -> onCreate:
if (LeakCanary.isInAnalyzerProcess(this)) {
  // This process is dedicated to LeakCanary for heap analysis.
  // You should not init your app in this process.
   return;
}
LeakCanary.install(this);
3、运行程序,(在桌面上会产生一个leaks的一个应用,这里记录着内存溢出的记录日志)在程序退出或退出某个界面的时候,如果有内存溢出的话会自动弹框提示或者也可以去leaks里去看。注意在发布应用的时候取消这项功能哟!
效果如图:
4、具体请移步官方:https://github.com/square/leakcanary;
Q: https://github.com/square/leakcanary/wiki/FAQ
Ps:这个只能测试版Debug的时候时候,等到了正式发版的时候记的取消了。
我自己测试的时候,页面开几个手机 发烫的就不行。或者打开应用放那不动也是,一会儿就开始发烫了,占用cpu太多,耗电极大。如果有用过的朋友欢迎交流。