主要分析的类
com.alibaba.csp.sentinel.dashboard.metric.MetricFetcher
在sentinel监控数据db持久化中,更换了MetricController的存储实现,可以发现com.alibaba.csp.sentinel.dashboard.repository.metric.MetricsRepository原来只有com.alibaba.csp.sentinel.dashboard.repository.metric.repository.InMemoryMetricsRepository实现
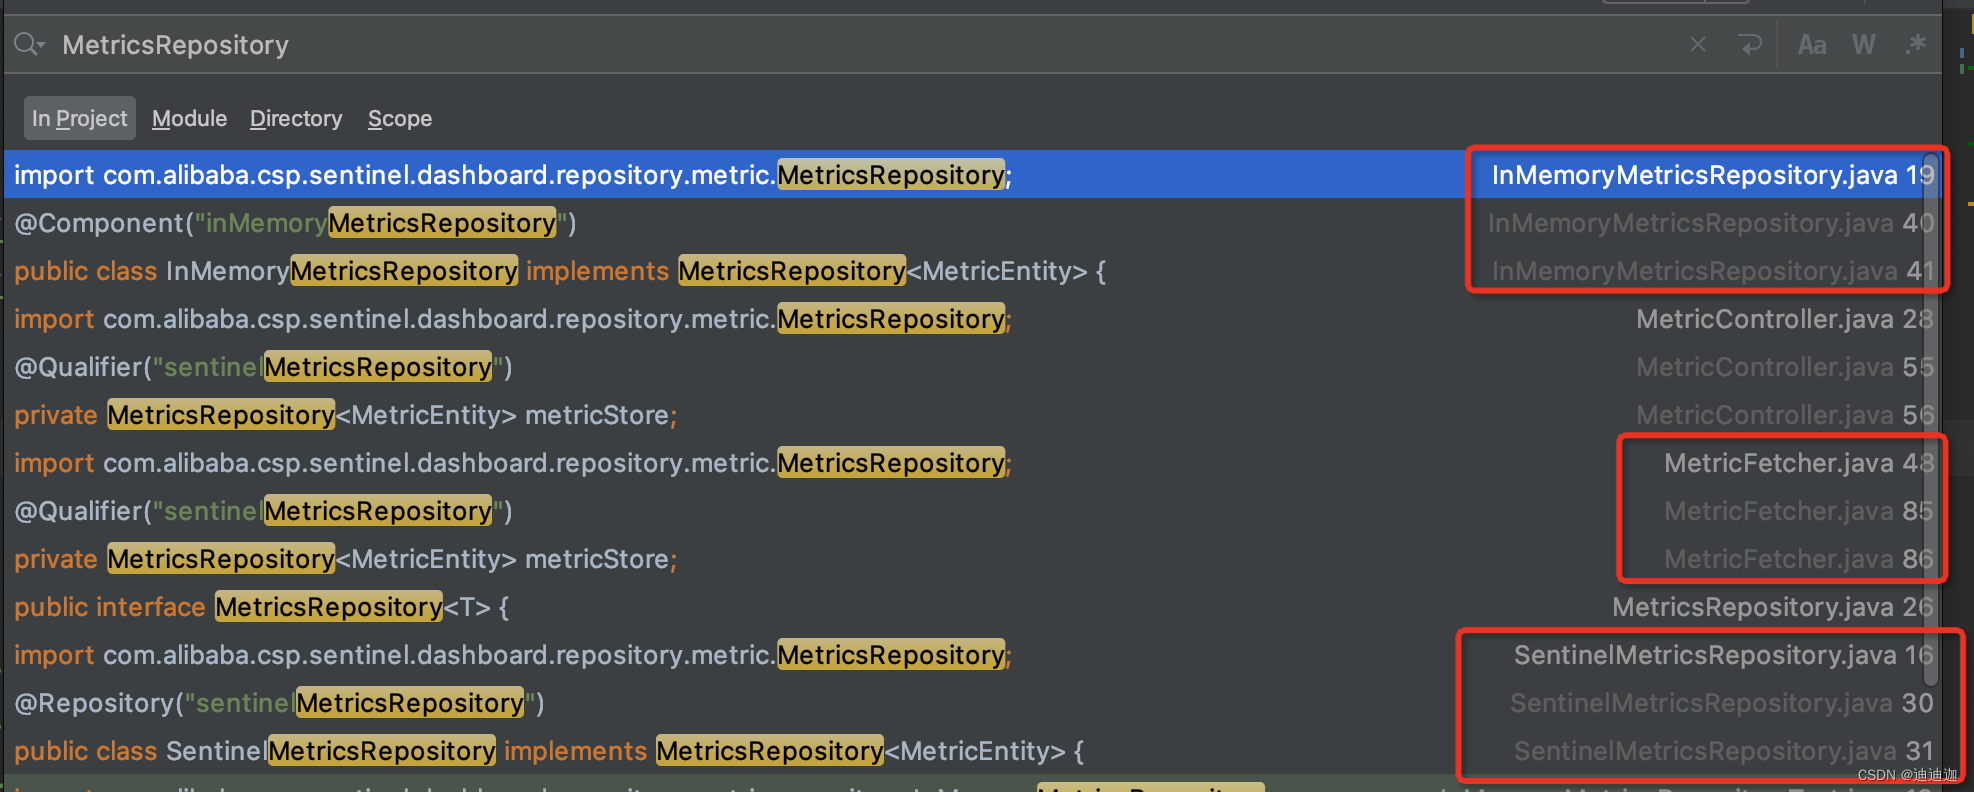
从全局可知,用到MetricsRepository的类原有的也就只有
com.alibaba.csp.sentinel.dashboard.repository.metric.repository.InMemoryMetricsRepository     监控数据的内存实现
com.alibaba.csp.sentinel.dashboard.metric.MetricFetcher    监控数据抓取器
com.alibaba.csp.sentinel.dashboard.controller.MetricController    dashboard获取监控数据入口
可以猜测监控数据获取实现的地方是在com.alibaba.csp.sentinel.dashboard.metric.MetricFetcher
还有一种方法不用猜的方式,在我们实现了dashboard的监控数据db存储后,发现
com.alibaba.csp.sentinel.dashboard.repository.metric.repository.SentinelMetricsRepository#saveAll
只要看哪里调用了存储的方法,就可以知道数据是怎么获取从而存储的。
com.alibaba.csp.sentinel.dashboard.metric.MetricFetcher#writeMetric
com.alibaba.csp.sentinel.dashboard.metric.MetricFetcher#fetchOnce
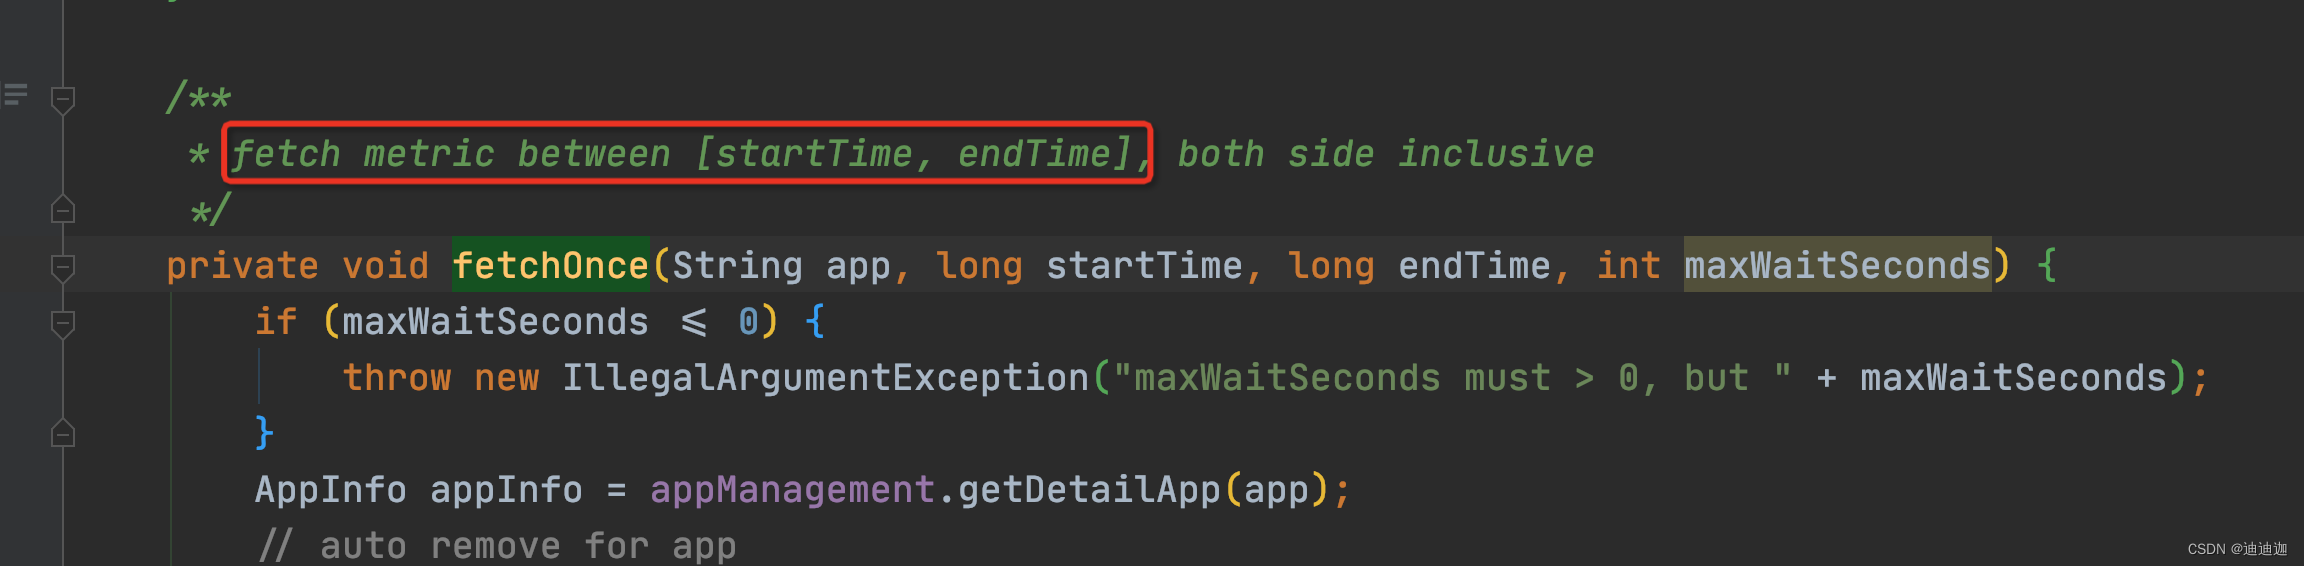
/**
     * fetch metric between [startTime, endTime], both side inclusive
     */
    private void fetchOnce(String app, long startTime, long endTime, int maxWaitSeconds) {


        if (maxWaitSeconds <= 0) {


            throw new IllegalArgumentException("maxWaitSeconds must > 0, but " + maxWaitSeconds);
        }
        //获取应用的基本信息
        AppInfo appInfo = appManagement.getDetailApp(app);
        // auto remove for app
        if (appInfo.isDead()) {


            logger.info("Dead app removed: {}", app);
            appManagement.removeApp(app);
            return;
        }
        //查看应用的机器信息(比如ip)
        Set<MachineInfo> machines = appInfo.getMachines();
        logger.debug("enter fetchOnce(" + app + "), machines.size()=" + machines.size()
            + ", time intervalMs [" + startTime + ", " + endTime + "]");
        if (machines.isEmpty()) {


            return;
        }
        final String msg = "fetch";
        AtomicLong unhealthy = new AtomicLong();
        final AtomicLong success = new AtomicLong();
        final AtomicLong fail = new AtomicLong();

        long start = System.currentTimeMillis();
        /** app_resource_timeSecond -> metric */
        final Map<String, MetricEntity> metricMap = new ConcurrentHashMap<>(16);
        final CountDownLatch latch = new CountDownLatch(machines.size());
        for (final MachineInfo machine : machines) {


            // 机器不正常 auto remove
            if (machine.isDead()) {


                latch.countDown();
                appManagement.getDetailApp(app).removeMachine(machine.getIp(), machine.getPort());
                logger.info("Dead machine removed: {}:{} of {}", machine.getIp(), machine.getPort(), app);
                continue;
            }
            if (!machine.isHealthy()) {


                latch.countDown();
                unhealthy.incrementAndGet();
                continue;
            }
            //机器正常的情况下
            final String url = "http://" + machine.getIp() + ":" + machine.getPort() + "/" + METRIC_URL_PATH
                + "?startTime=" + startTime + "&endTime=" + endTime + "&refetch=" + false;
            final HttpGet httpGet = new HttpGet(url);
            httpGet.setHeader(HTTP.CONN_DIRECTIVE, HTTP.CONN_CLOSE);
            httpclient.execute(httpGet, new FutureCallback<HttpResponse>() {


                @Override
                public void completed(final HttpResponse response) {


                    try {


                        handleResponse(response, machine, metricMap);
                        success.incrementAndGet();
                    } catch (Exception e) {


                        logger.error(msg + " metric " + url + " error:", e);
                    } finally {


                        latch.countDown();
                    }
                }

                @Override
                public void failed(final Exception ex) {


                    latch.countDown();
                    fail.incrementAndGet();
                    httpGet.abort();
                    if (ex instanceof SocketTimeoutException) {


                        logger.error("Failed to fetch metric from <{}>: socket timeout", url);
                    } else if (ex instanceof ConnectException) {


                        logger.error("Failed to fetch metric from <{}> (ConnectionException: {})", url, ex.getMessage());
                    } else {


                        logger.error(msg + " metric " + url + " error", ex);
                    }
                }

                @Override
                public void cancelled() {


                    latch.countDown();
                    fail.incrementAndGet();
                    httpGet.abort();
                }
            });
        }
        try {


            latch.await(maxWaitSeconds, TimeUnit.SECONDS);
        } catch (Exception e) {


            logger.info(msg + " metric, wait http client error:", e);
        }
        //long cost = System.currentTimeMillis() - start;
        //logger.info("finished " + msg + " metric for " + app + ", time intervalMs [" + startTime + ", " + endTime
        //    + "], total machines=" + machines.size() + ", dead=" + dead + ", fetch success="
        //    + success + ", fetch fail=" + fail + ", time cost=" + cost + " ms");
        writeMetric(metricMap);
    }
final String url = "http://" + machine.getIp() + ":" + machine.getPort() + "/" + METRIC_URL_PATH
                + "?startTime=" + startTime + "&endTime=" + endTime + "&refetch=" + false;
            final HttpGet httpGet = new HttpGet(url);
这里是调用机器的**“metric”**接口获取数据。
metric接口位于sentinel-transport【sentinel通信包】下
com.alibaba.csp.sentinel.command.handler.SendMetricCommandHandler
com.alibaba.csp.sentinel.node.metric.MetricSearcher
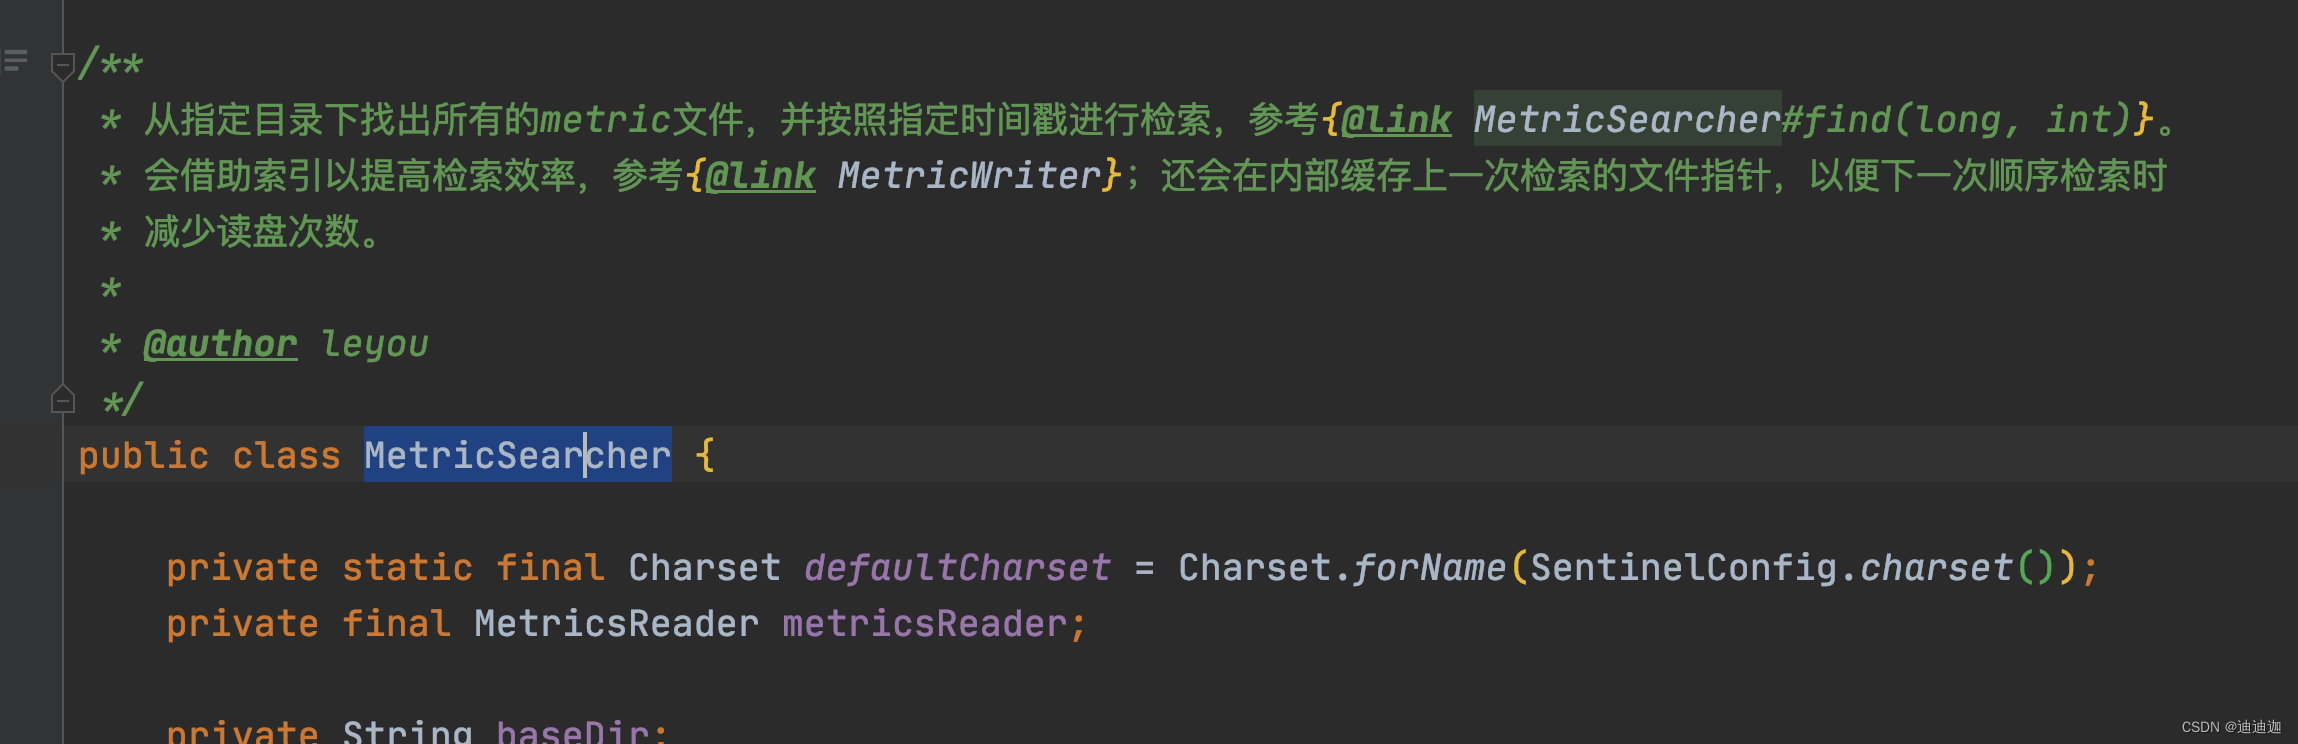
注释写的已经很清楚了,通过MetricSearcher查询机器的监控数据文件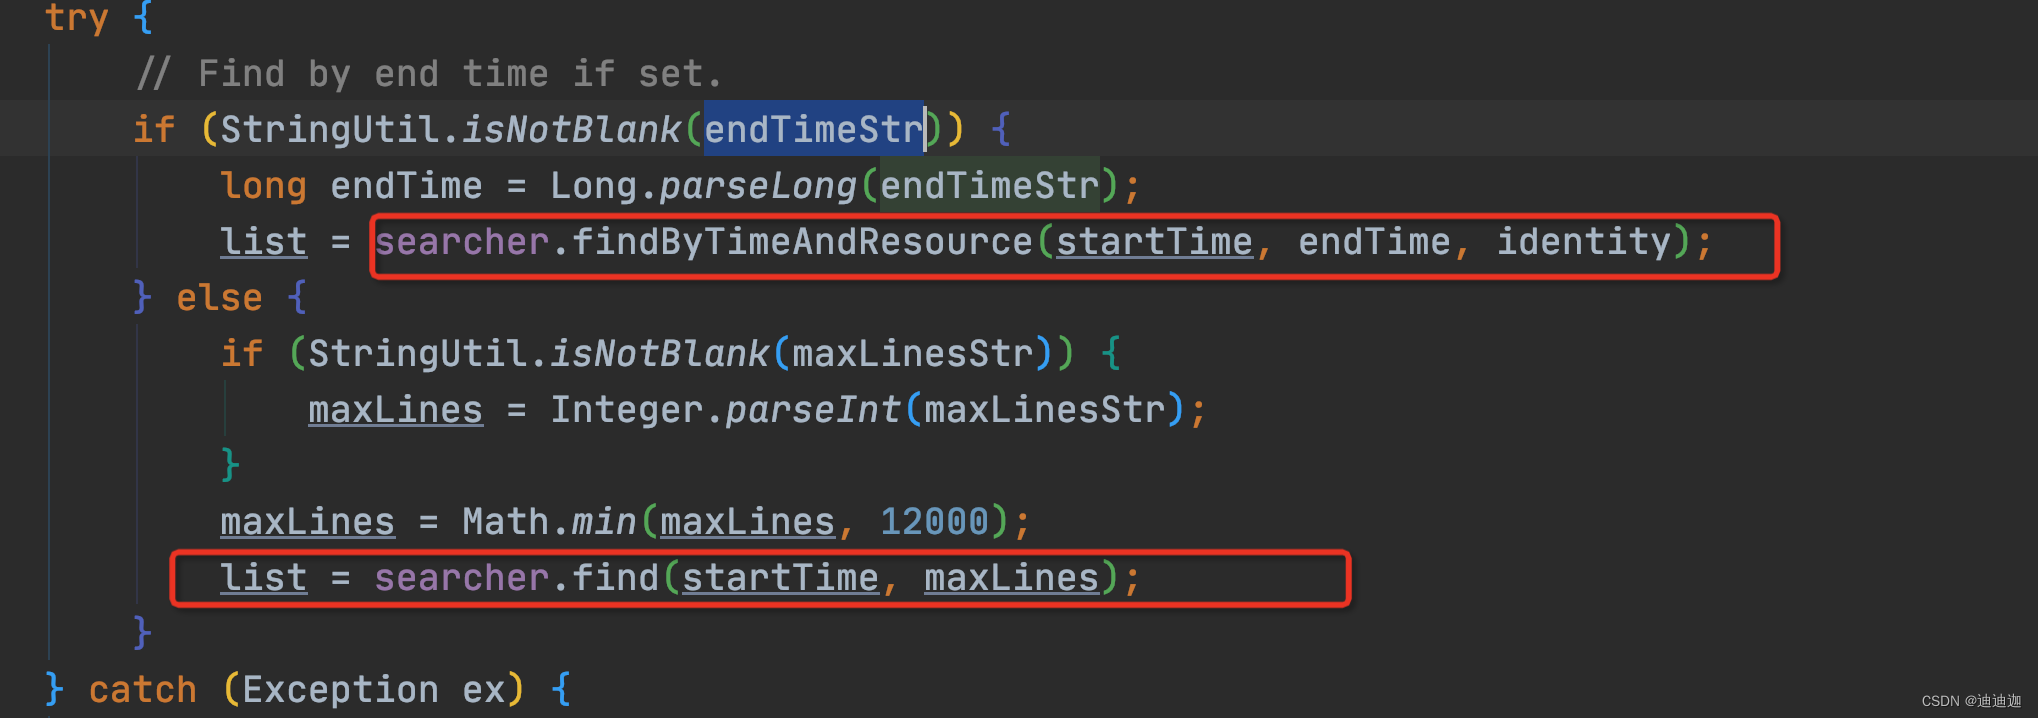
com.alibaba.csp.sentinel.node.metric.MetricWriter#listMetricFiles
此方法是获取应用机器下的监控文件的。
知道了dashboard怎么获取的监控数据,那监控数据是怎么写到应用机器的磁盘?
com.alibaba.csp.sentinel.n`在这里插入代码片`ode.metric.MetricWriter#listMetricFiles
所属的类com.alibaba.csp.sentinel.node.metric.MetricWriter从命名就可以看出是写监控数据的。
com.alibaba.csp.sentinel.node.metric.MetricWriter#write
查看write方法的调用
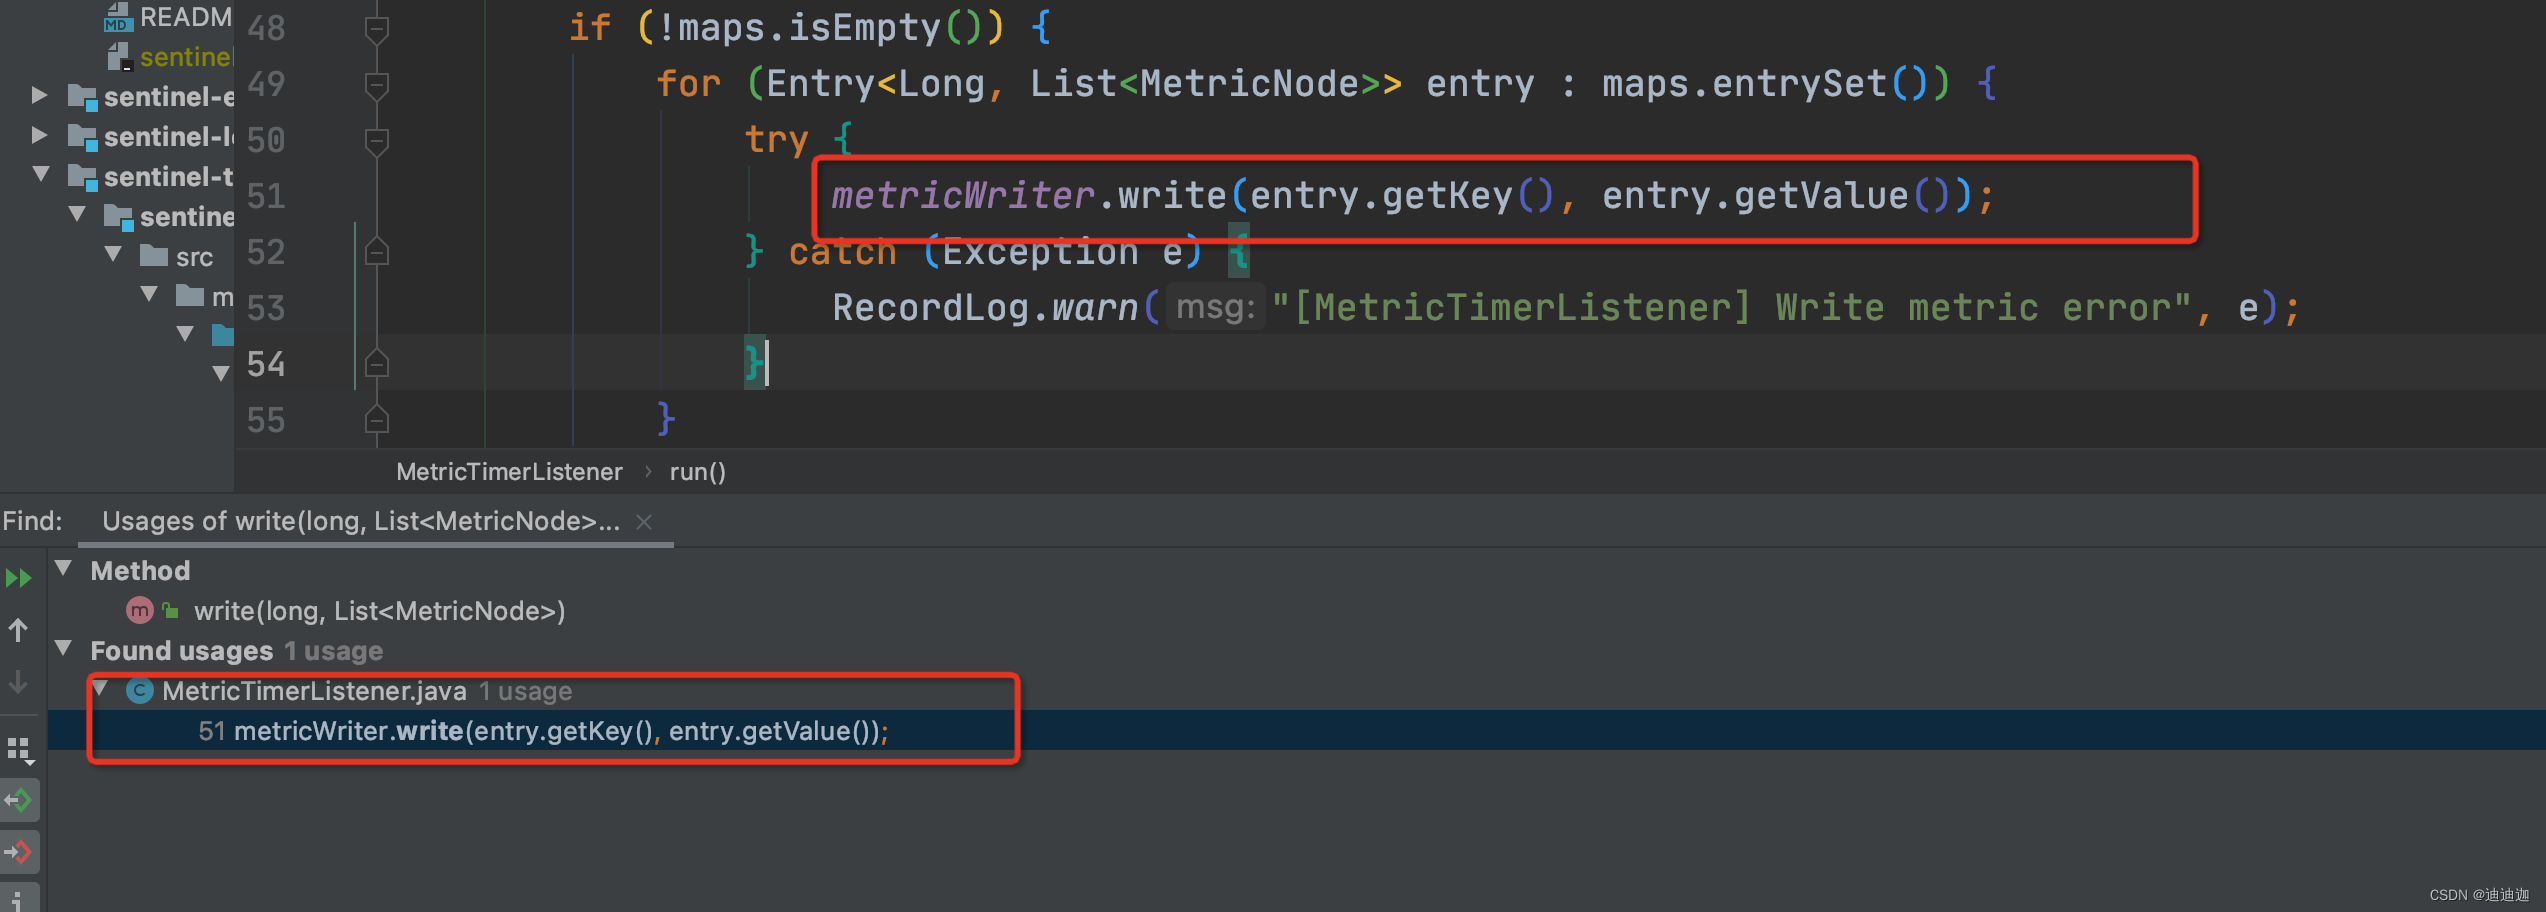
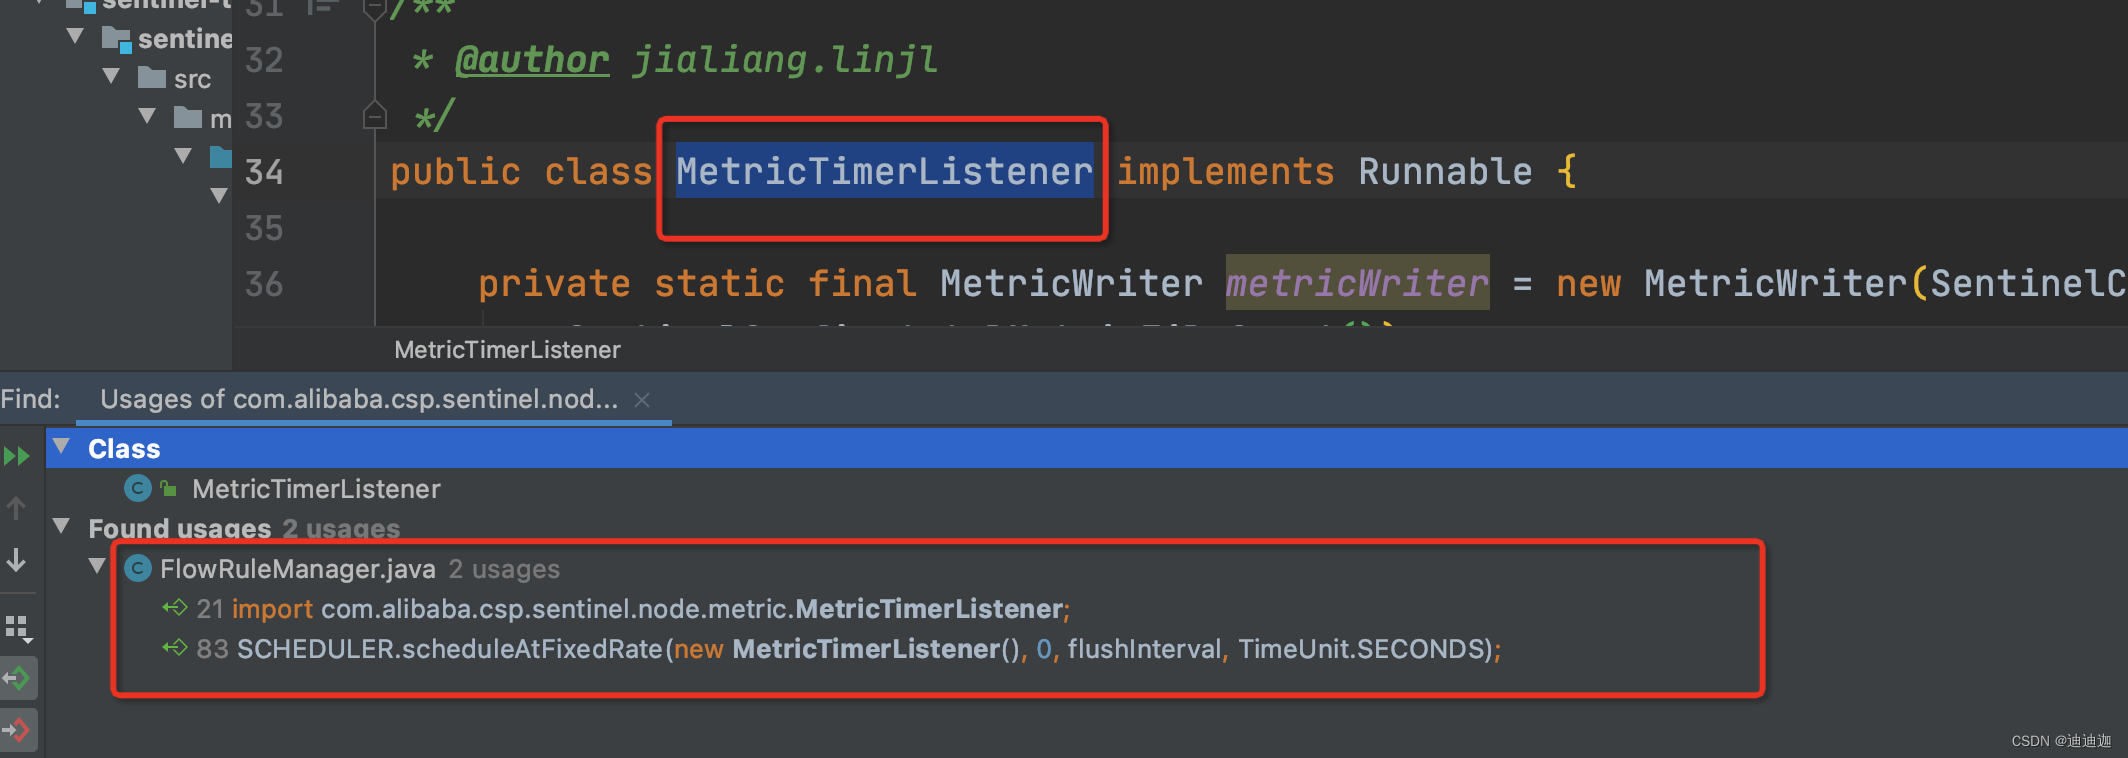
com.alibaba.csp.sentinel.slots.block.flow.FlowRuleManager
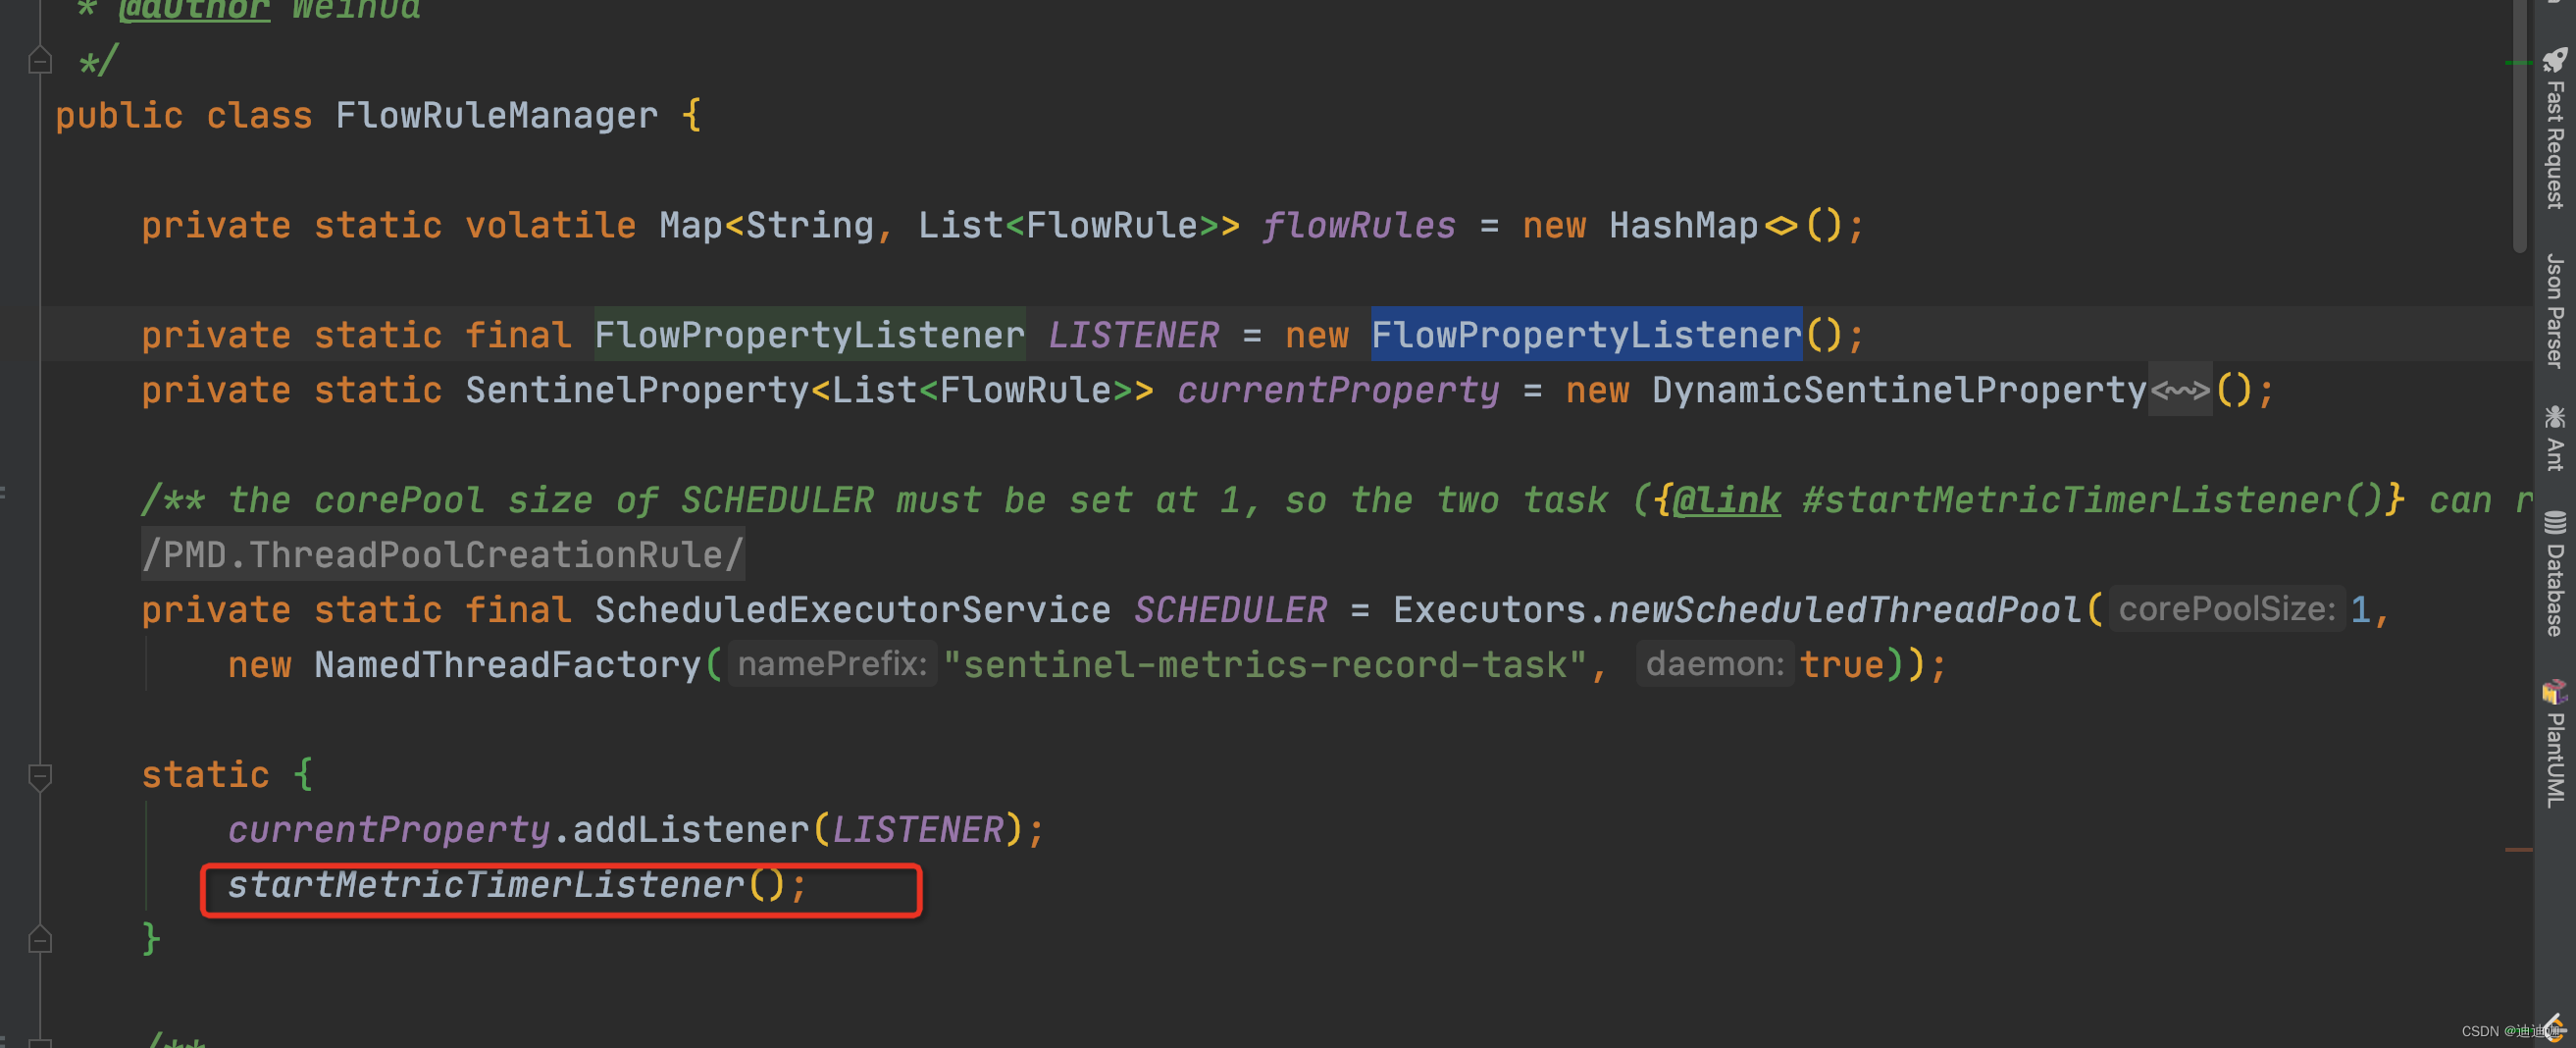
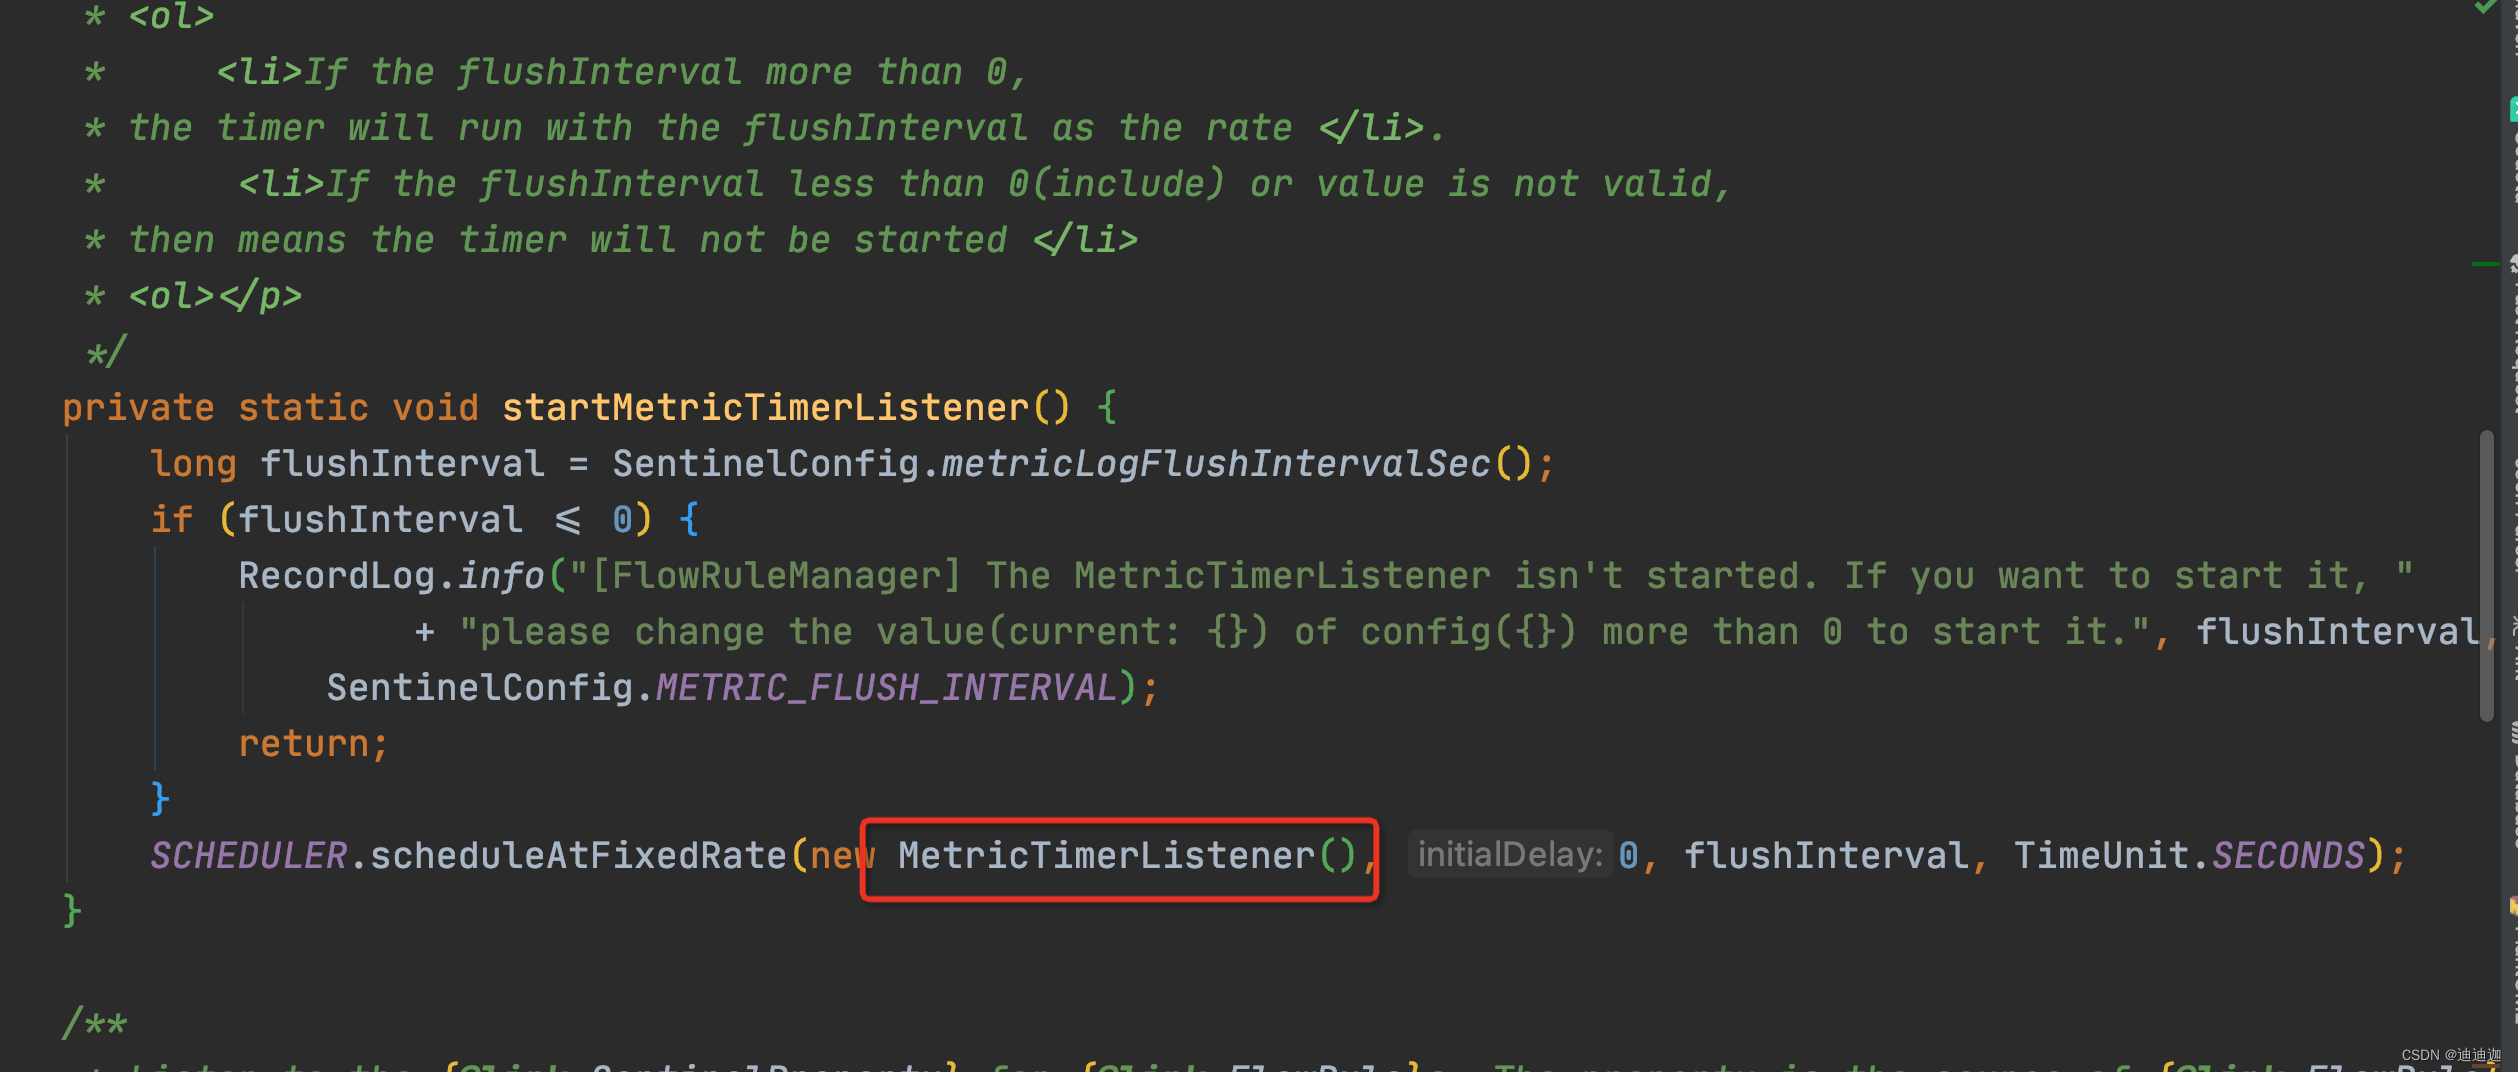
在应用启动的时候FlowRuleManager会注册监听配置项的变化,同时也会注册MetricTimerListener,通过MetricTimerListener将监控数据写到应用所在的磁盘上,dashborad通过ip+port+方法名+参数调用获取应用磁盘上文件的监控数据。