前置知识:
Flume 数据流监控
Ganglia 的安装与部署
Ganglia 由 gmond、gmetad 和 gweb 三部分组成。
- gmond(Ganglia Monitoring Daemon)是一种轻量级服务,安装在每台需要收集指标数据的节点主机上。使用 gmond,你可以很容易收集很多系统指标数据,如 CPU、内存、磁盘、网络和活跃进程的数据等。
- gmetad(Ganglia Meta Daemon)整合所有信息,并将其以 RRD 格式存储至磁盘的服务。
- gweb(Ganglia Web)Ganglia 可视化工具,gweb 是一种利用浏览器显示 gmetad 所存储数据的 PHP 前端。在 Web 界面中以图表方式展现集群的运行状态下收集的多种不同指标数据
安装规划
首先在hadoop102,hadoop103,hadoop104上安装epel-release:sudo yum -y install epel-release
epel:Extra Packages for Enterprise Linux ,包含一些额外的软件包,用于增强系统的功能和性能
hadoop102:gweb gmetad gmod
sudo yum -y install ganglia-gmetad
sudo yum -y install ganglia-web
sudo yum -y install ganglia-gmond
好像在安装gmetad的时候,会为了解决依赖问题自动安装gweb和gmond

hadoop103:gmod
sudo yum -y install ganglia-gmond
hadoop104:gmod
sudo yum -y install ganglia-gmond
配置文件
hadoop102上:
1.修改ganglia的配置文件:sudo vim /etc/httpd/conf.d/ganglia.conf
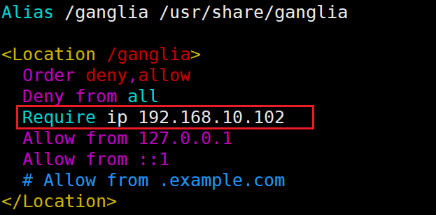
通过 windows 访问 ganglia , 需要配置 Linux 对应的主机(windows)ip 地址
2.修改gmetad的配置文件:sudo vim /etc/ganglia/gmetad.conf

hadoop102、103、104上:
修改gmod的配置文件:sudo vim /etc/ganglia/gmond.conf

name与gmetad中配置的一致;

数据发送给hadoop102

接收来自任意连接的数据
在hadoo102上关闭防火墙:sudo vim /etc/selinux/config
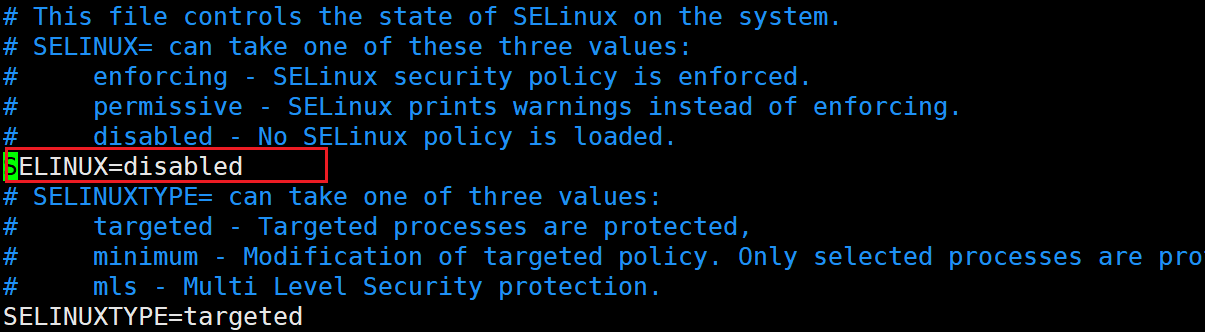
重启后生效,也可通过
sudo setenforce 0使其临时生效
ganglia启动
如果出现权限不足的错误:
sudo chmod -R 777 /var/lib/ganglia
然后在hadoop102、103、104上启动gmod:sudo systemctl start gmond
sudo systemctl restart gmond
sudo systemctl status gmond
sudo systemctl stop gmond
在hadoop102上:sudo systemctl start httpd
sudo systemctl restart httpd
sudo systemctl status httpd
sudo systemctl stop httpd
httpd启动的时候可能会报错:
httpd[2574]: AH00558: httpd: Could not reliably determine the se...age遇到这种情况,打开httpd的配置文件:sudo vim /etc/httpd/conf/httpd.conf
然后找到Servername,将#ServerName www.example.com:80改为ServerName localhost:80即可
centos系统使用yum安装的http的配置文件路径为/etc/httpd/conf/httpd.conf,其余操作系统和安装方式路径可能有差别;
sudo systemctl start gmetad
sudo systemctl restart gmetad
sudo systemctl status gmetad
sudo systemctl stop gmetad
如果问题还是不能解决,修改/etc/httpd/conf.d/ganglia.conf
将其余内容全部注释掉,添加Require all granted

Flume监控测试
启动Flume任务
bin/flume-ng agent \
-c conf/ \
-n a1 \
-f job/net-flume-logger.conf \
-Dflume.root.logger=INFO,console \
-Dflume.monitoring.type=ganglia \
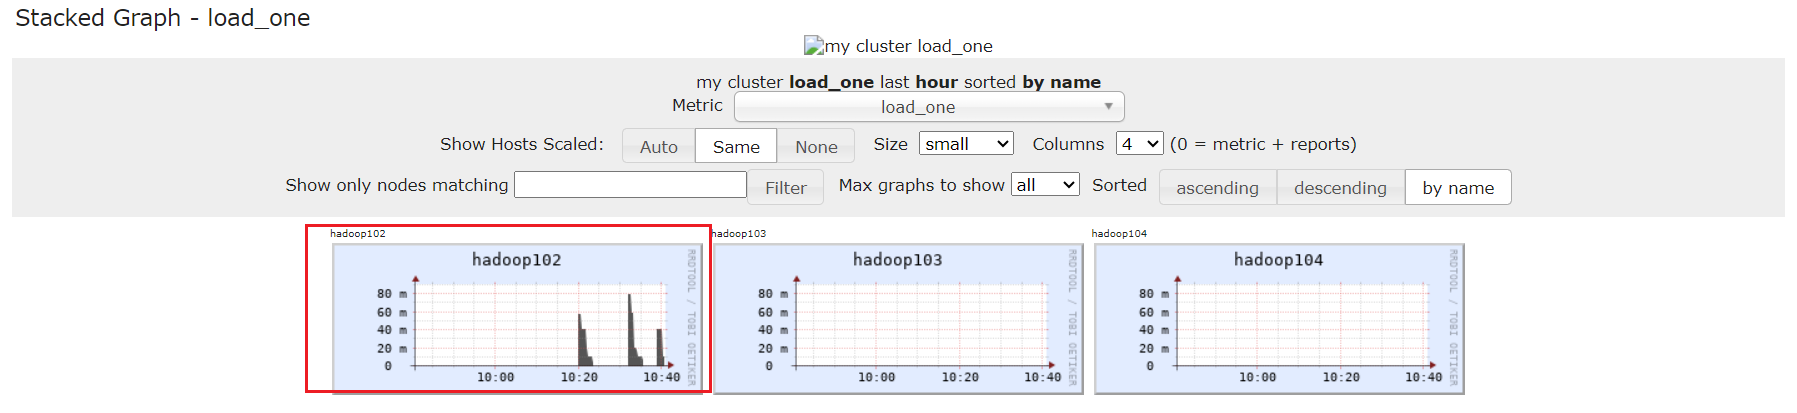
-Dflume.monitoring.hosts=hadoop102:8649选择集群:

可以看到内存、CPU、网络连接等状况:

最下方点击hadoop102节点,去查看flume任务的执行情况:
向下找到flume metrics,可以查看flume相关指标
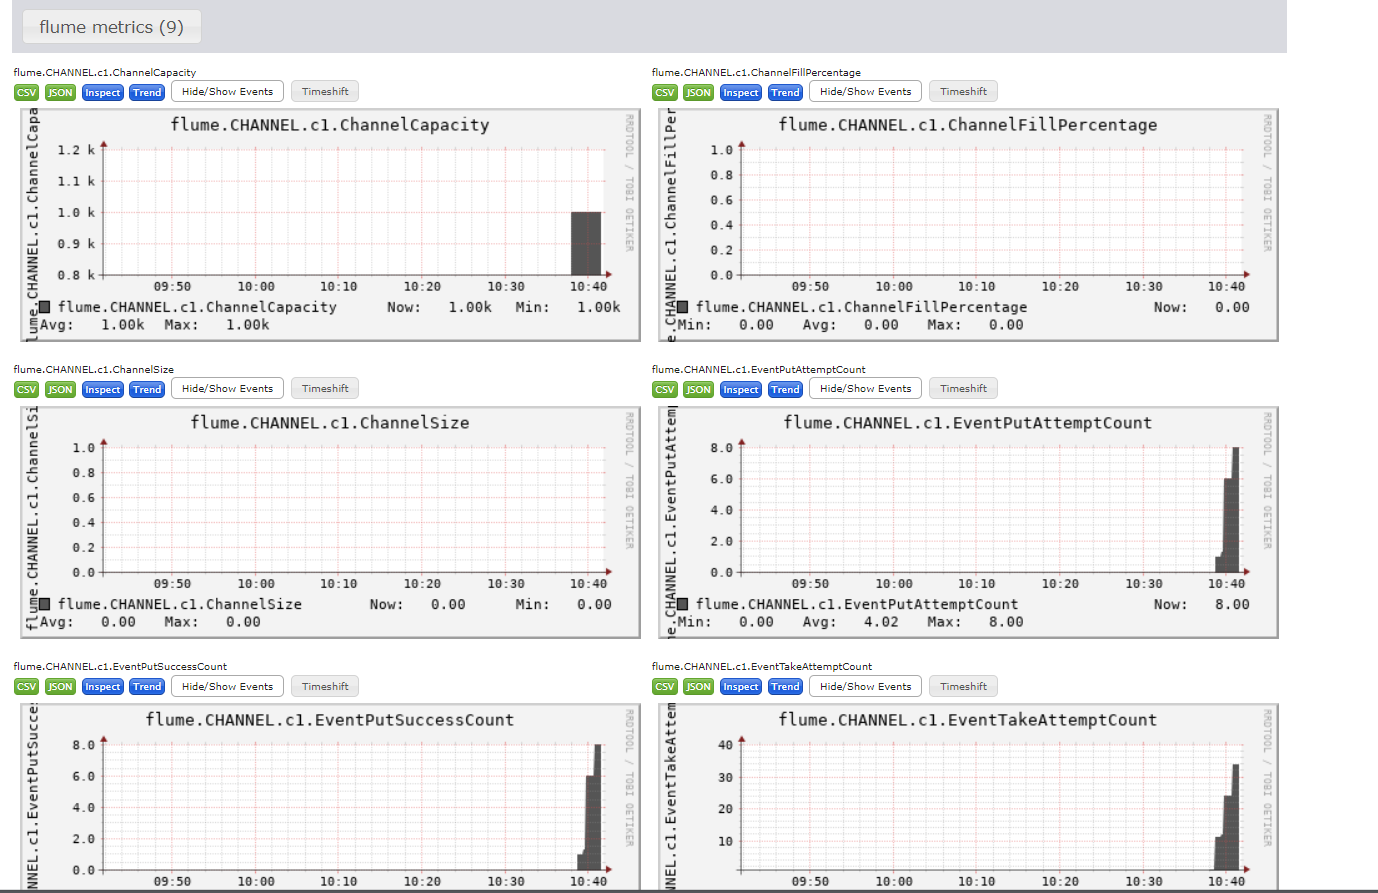
具体含义如下
EventPutAttemptCount :source 尝试写入 channel 的事件总数量
EventPutSuccessCount :成功写入 channel 且提交的事件总数量
EventTakeAttemptCount :sink 尝试从 channel 拉取事件的总数量。
EventTakeSuccessCount :sink 成功读取的事件的总数量
StartTime :channel 启动的时间(毫秒)
StopTime :channel 停止的时间(毫秒)
ChannelSize :目前 channel 中事件的总数量
ChannelFillPercentage :channel 占用百分比
ChannelCapacity :channel 的容量
图表的更新可能有一定的延迟