1.安装普罗米修斯
按照以下步骤进行操作:
- 首先,打开普罗米修斯的官方网站(https://prometheus.io)。
- 在网站顶部的菜单中,选择"Downloads"(下载)选项。
- 在下载页面中,找到适用于您系统的最新版本的压缩包,然后点击下载。
- 下载完成后,将压缩包解压到您希望安装普罗米修斯的目录中。
- 在解压后的目录中,您将找到一个名为
prometheus的可执行文件,这是普罗米修斯服务器的主要组件。 - 创建一个用于存储配置文件和数据的目录。可以在解压后的目录中创建一个名为
data的文件夹。 - 在存储配置文件的目录中创建一个名为
prometheus.yml的文件,并在其中定义您要监控的目标和指标。请参考普罗米修斯文档以获取更多详细信息和示例配置。
# my global config
global:
  scrape_interval: 15s # Set the scrape interval to every 15 seconds. Default is every 1 minute.
  evaluation_interval: 15s # Evaluate rules every 15 seconds. The default is every 1 minute.
  # scrape_timeout is set to the global default (10s).

# Alertmanager configuration
alerting:
  alertmanagers:
    - static_configs:
        - targets:
          # - alertmanager:9093

# Load rules once and periodically evaluate them according to the global 'evaluation_interval'.
rule_files:
  # - "first_rules.yml"
  # - "second_rules.yml"

# A scrape configuration containing exactly one endpoint to scrape:
# Here it's Prometheus itself.
scrape_configs:
  # The job name is added as a label `job=<job_name>` to any timeseries scraped from this config.
  - job_name: "prometheus"

    # metrics_path defaults to '/metrics'
    # scheme defaults to 'http'.

    static_configs:
      - targets: ["10.0.0.219:9090"]
  - job_name: 'pushgateway'
    static_configs:
      - targets: ['10.0.0.219:9091','10.0.0.218:9091']
        labels:
            instance: pushgateway
# 添加 Node Exporter 监控配置
  - job_name: 'node exporter'
    static_configs:
      - targets: ['10.0.0.219:9100', '192.168.4.241:9100', '192.168.4.240:9100']
#持久化
remote_write:
 - url: "http://10.0.0.218:8087/receive"
- 打开终端,并导航到解压后的目录。
- 运行以下命令启动普罗米修斯服务器:
./prometheus --config.file=prometheus.yml --storage.tsdb.path=data
- 等待一段时间,使服务器启动和初始化。
- 现在,您可以通过访问
http://10.0.0.219:9090来访问普罗米修斯的Web界面。
2.安装和部署自定义采集器Pushgateway
- 首先,打开Pushgateway的GitHub仓库页面(https://github.com/prometheus/pushgateway/releases)。
- 在仓库页面中,下载Pushgateway。
- 下载完成后,解压缩代码到您希望安装Pushgateway的目录中。
- 运行以下命令启动Pushgateway服务器:
nohup ./pushgateway &
- 现在,您可以通过访问
http://localhost:9091来访问Pushgateway的Web界面。
3.安装和部署Grafana
1.下载页面https://grafana.com/grafana/download?pg=get
2.解压
tar -zxvf grafana-enterprise-10.2.3.linux-amd64.tar.gz
3.修改邮箱告警配置文件
/azhangjs/grafana/conf/defaults.ini
[smtp]
enabled = true
host = smtp.sina.com:25
user = [email protected]
# If the password contains # or ; you have to wrap it with triple quotes. Ex """#password;"""
password = 11221222
;cert_file =
;key_file =
;skip_verify = true
from_address = [email protected]
from_name = Grafana
ehlo_identity =
startTLS_policy =
4.启动命令
nohup ./grafana-server >1.txt &
5.访问 http://10.0.0.58:3000 账号 admin 密码默认 admin
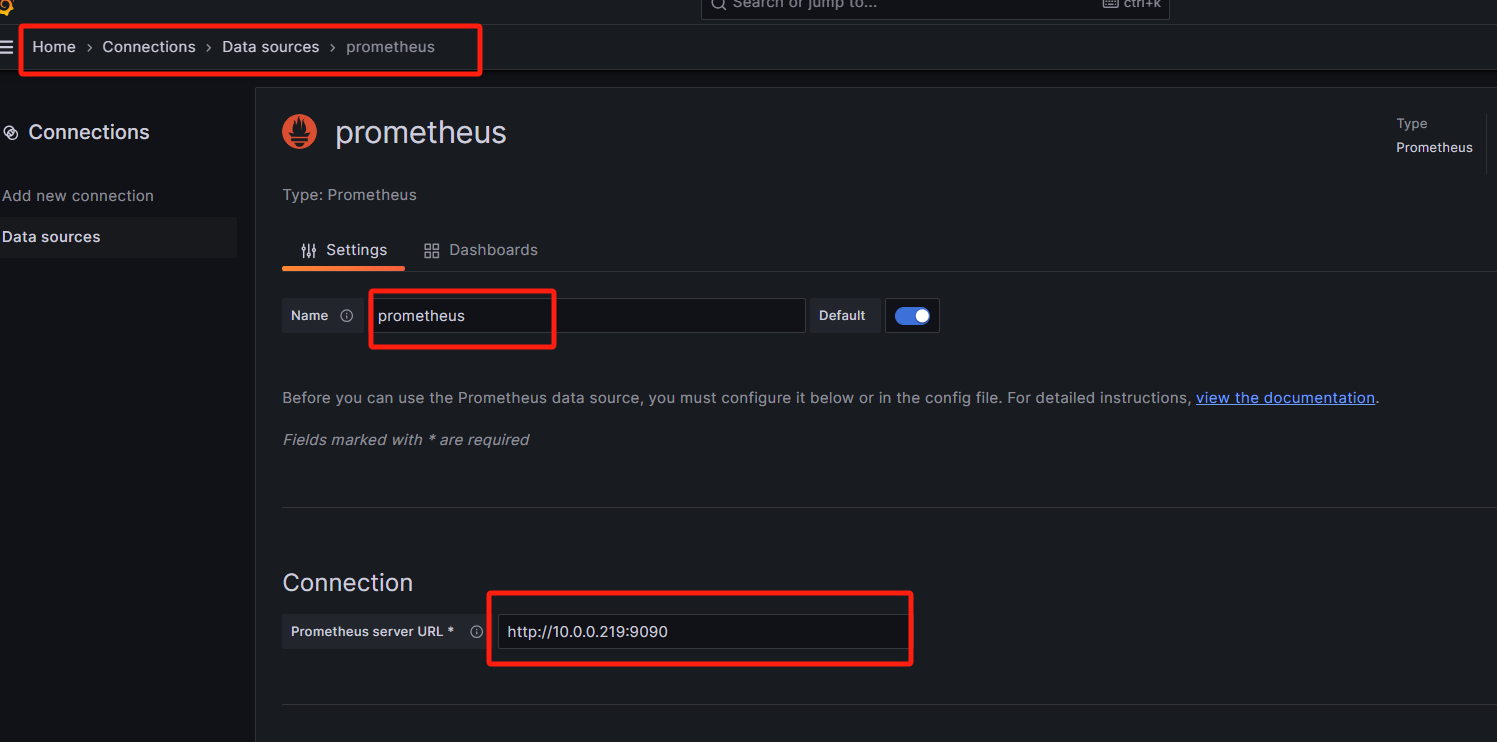
6.配置普罗米修斯数据源
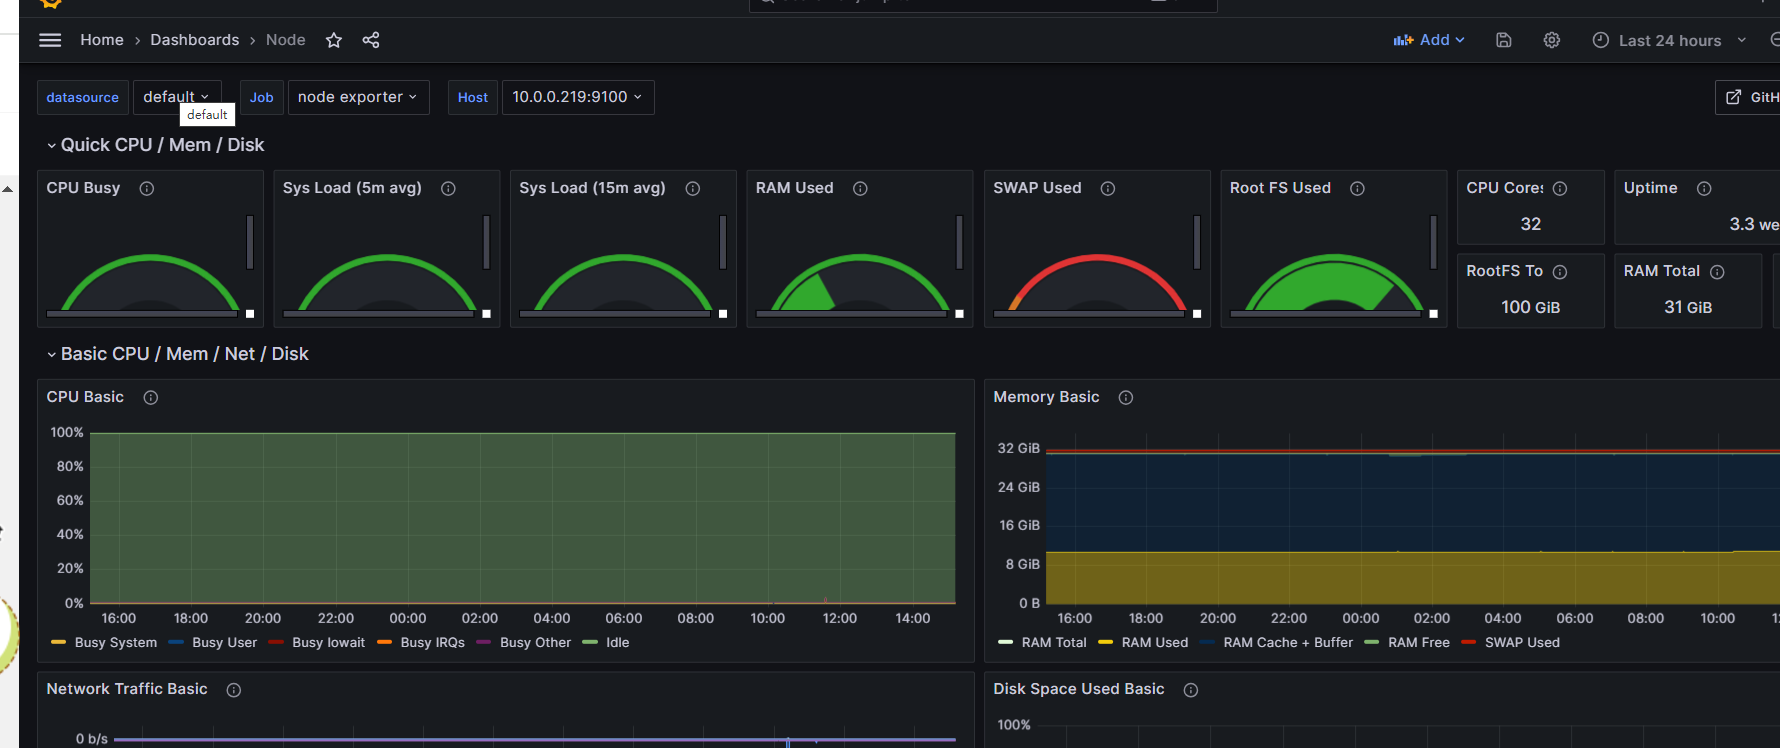
7.下载dashboards模板,导入dashboards
附录:
常用dashboards
https://grafana.com/grafana/dashboards/
4.安装InfluxDB 2.x(持久化)
远程存储方案主要有哪些?
来自官方文档: https://prometheus.io/docs/operating/integrations/#remote-endpoints-and-storage
优势
InfluxDB相比其他时序数据库具有以下优势:
- 设计用于时序数据:InfluxDB专门为高效处理和存储时序数据而设计。它使用了一种称为"TSDB"(时间序列数据库)的数据结构,可以快速地写入和查询大量时序数据。与传统的关系型数据库相比,InfluxDB在时序数据的存储和查询性能方面表现更出色。
- 高性能:InfluxDB采用了多级索引和压缩算法,以提供高性能的数据写入和查询。它支持批量写入和高并发读取,并且能够轻松地扩展以处理大规模的数据流。这使得InfluxDB成为处理实时监控、传感器数据、日志数据等具有高吞吐量和频繁更新的应用的理想选择。
- 灵活的查询语言:InfluxDB提供了一种名为InfluxQL的查询语言,用于灵活地查询和聚合时序数据。InfluxQL支持常见的SQL操作,如选择、过滤、排序、分组和聚合,同时还提供了针对时序数据优化的特定函数和操作符。这使得用户可以轻松地进行复杂的时序数据分析和可视化。
- 内置的数据保留策略:InfluxDB内置了数据保留策略,可以根据时间或空间等条件自动删除旧数据。这使得用户可以轻松地管理和控制数据的保留期限,避免数据无限增长导致的存储问题。
- 生态系统和集成:InfluxDB拥有丰富的生态系统和广泛的集成支持。它与多个监控和数据可视化工具(如Grafana、Prometheus)紧密集成,可以方便地进行数据展示和分析。此外,InfluxDB还提供了多个客户端库和API,支持多种编程语言和平台。
总之,InfluxDB在时序数据处理方面具有出色的性能和灵活性,适用于大规模的实时监控、传感器数据、日志数据等应用场景,并且具有丰富的生态系统和集成支持。
安装
按照以下步骤进行操作:
- 下载 InfluxDB 2.x 的安装包。你可以在 InfluxDB 官方网站(https://www.influxdata.com/downloads/)的下载页面上找到适用于你操作系统的安装包。
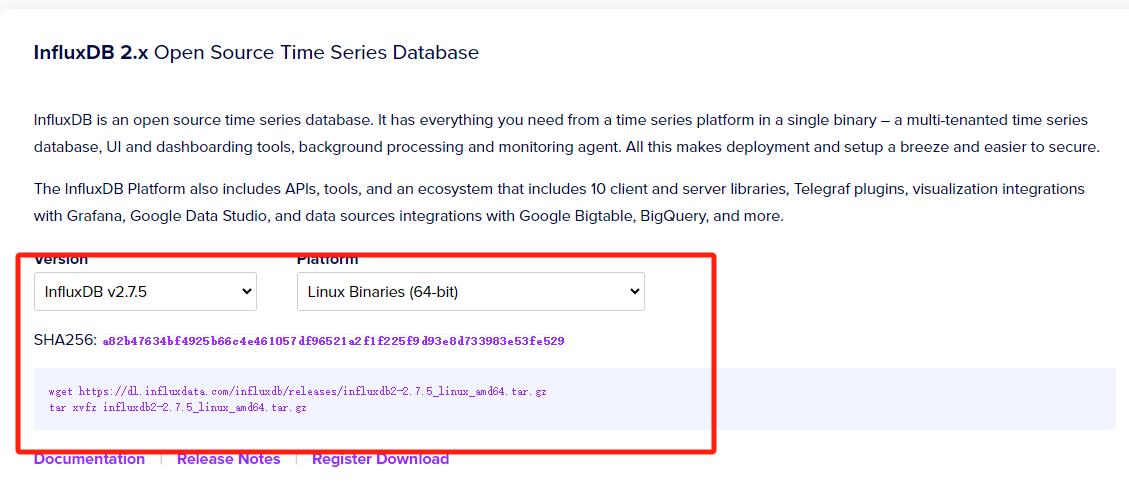
wget https://dl.influxdata.com/influxdb/releases/influxdb2-2.7.5_linux_amd64.tar.gz
- 解压安装包。根据你下载的安装包类型,执行相应的解压命令。
tar xvfz influxdb2-2.7.5_linux_amd64.tar.gz
- 启动 InfluxDB。在终端或命令提示符中,进入 InfluxDB 解压后的目录,执行启动命令。根据你的操作系统和安装包类型,启动命令可能会不同。
nohup ./influxdb2-2.7.4/usr/bin/influxd >1.txt &
- 验证安装。使用浏览器访问 InfluxDB 的管理界面,默认地址为
[http://10.0.0.218:8086/](http://10.0.0.218:8086/)。如果成功打开了管理界面,则说明 InfluxDB 安装成功。
5.安装Telgraf
按照以下步骤进行操作:
- 下载 Telegraf 的安装包。你可以在 Telegraf 官方网站的下载页面上找到适用于你操作系统的安装包。
wget https://dl.influxdata.com/telegraf/releases/telegraf-1.29.2_linux_amd64.tar.gz
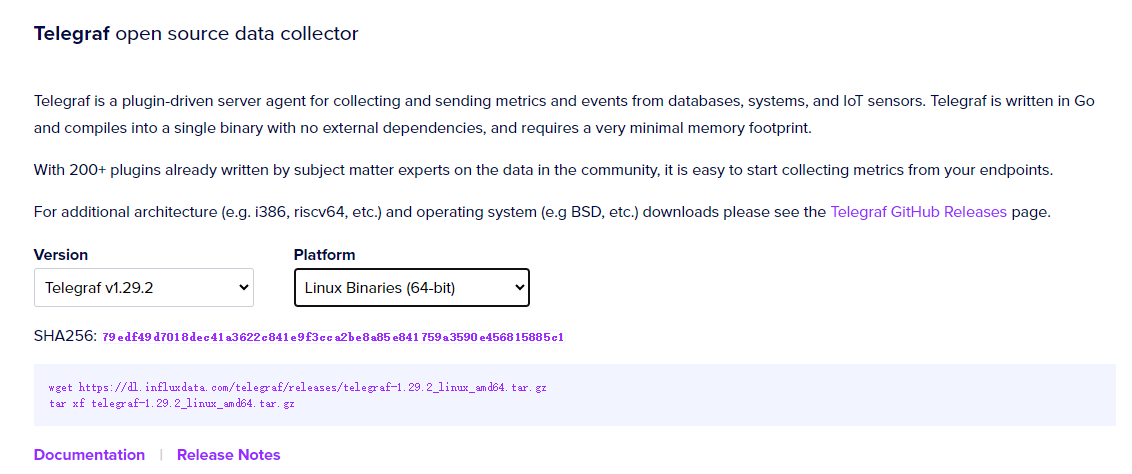
- 解压安装包。根据你下载的安装包类型,执行相应的解压命令。
tar xf telegraf-1.29.2_linux_amd64.tar.gz
- 配置 Telegraf。在解压后的目录中,找到并编辑 /etc/telegraf/
telegraf.conf文件,根据你的需求进行配置。你可以设置数据收集的插件、输出目标、认证方式等等。
###############################################################################
#                            OUTPUT PLUGINS                                   #
###############################################################################

# Configuration for sending metrics to InfluxDB 2.0
# 配置将指标输出到 InfluxDB 2.0
[[outputs.influxdb_v2]]
  # 这里的 urls 指向 InfluxDB 的地址,可以是多个
  urls = ["http://127.0.0.1:8086"]
  # 这里的 Token 为 InfluxDB 中创建的 Token
  # 推荐使用环境变量的方式传入,本例为了方便直接把 token 写到配置文件中了
  #token = "$INFLUX_TOKEN"
  token = "asdfghjkxxxxxxxxxxxxxxxxxxxxxx=="
  # InfluxDB 的 organization 名称
  organization = "abc"
  # 数据要输出到的 bucket 名称
  bucket = "telegraf"

# 配置监听端口和path,使之可以接收数据,这里会应用到Prometheus的配置文件中
[[inputs.http_listener_v2]]
 ## Address and port to host HTTP listener on
 # 监听端口
 service_address = ":8087"
 ## Path to listen to.
 # 设置接收数据的path,对应的HTTP地址为 http://ip:8087/receive
 path = "/receive"
 ## Data format to consume.
 # 接收从Prometheus中出入过来的格式数据
 data_format = "prometheusremotewrite"

# Read metrics from one or many prometheus clients
# 读取 Prometheus 这个服务自身的指标数据(跟 Prometheus 写入数据到 InfluxDB 没有关系)
[[inputs.prometheus]]
  ## An array of urls to scrape metrics from.
  # 采集一下 prometheus 这个服务的指标数据,可以观察是否能正常写入数据到 bucket 中
  # 该 url 为本例安装的 Prometheus 服务的指标地址,数组格式可以是多个
  urls = ["http://10.0.0.219:9090/metrics"]

# Telegraf 提供了很多 inputs.xxxx 获取服务指标的插件可以直接使用,详见官网
# 以下配置随便获取一些本机数据
[[inputs.cpu]]
  percpu = true
  totalcpu = true
  collect_cpu_time = false
  report_active = false
[[inputs.disk]]
  ignore_fs = ["tmpfs", "devtmpfs", "devfs", "iso9660", "overlay", "aufs", "squashfs"]
[[inputs.diskio]]
  fieldpass = ["read_bytes","write_bytes","reads","writes"]
[[inputs.mem]]
  fieldpass = ["available","total","available_percent","cached","buffered"]
[[inputs.net]]
  interfaces = ["eth*"]
  fieldpass = ["bytes_recv","bytes_sent"]
[[inputs.processes]]
  interval = "10m"
  fielddrop = ["wait","idle","unknown"]
[[inputs.swap]]
  # no configuration
[[inputs.system]]
  interval = "2m"
  fielddrop = ["uptime_format"]
- 启动 Telegraf。在终端或命令提示符中,进入 Telegraf 解压后的目录,执行启动命令。根据你的操作系统和安装包类型,启动命令可能会不同。
nohup ./telegraf --config ../../etc/telegraf/telegraf.conf &
- 验证安装。确认 Telegraf 是否成功运行,并开始收集和发送数据(http://10.0.0.218:9273/metrics)。你可以查看日志文件或使用其他工具来验证数据的收集和传输情况。
6.Java传输数据
 <!-- The client -->
        <dependency>
            <groupId>io.prometheus</groupId>
            <artifactId>simpleclient</artifactId>
            <version>0.15.0</version>
        </dependency>
        <!-- Hotspot JVM metrics-->
        <dependency>
            <groupId>io.prometheus</groupId>
            <artifactId>simpleclient_hotspot</artifactId>
            <version>0.15.0</version>
        </dependency>
        <!-- Exposition HTTPServer-->
        <dependency>
            <groupId>io.prometheus</groupId>
            <artifactId>simpleclient_httpserver</artifactId>
            <version>0.15.0</version>
        </dependency>
        <!-- Pushgateway exposition-->
        <dependency>
            <groupId>io.prometheus</groupId>
            <artifactId>simpleclient_pushgateway</artifactId>
            <version>0.15.0</version>
        </dependency>
package com.abc.push.controller;

import com.influxdb.client.InfluxDBClient;
import com.influxdb.client.InfluxDBClientFactory;
import com.influxdb.client.WriteApiBlocking;
import com.influxdb.client.domain.WritePrecision;
import com.influxdb.client.write.Point;
import io.prometheus.client.CollectorRegistry;
import io.prometheus.client.Gauge;
import io.prometheus.client.exporter.PushGateway;
import org.springframework.web.bind.annotation.GetMapping;
import org.springframework.web.bind.annotation.RestController;

import java.io.IOException;
import java.time.Instant;
import java.util.HashMap;
import java.util.Map;
import java.util.Random;
@RestController
public class MyController {

    @GetMapping("/my-endpoint")
    public void myEndpoint() throws IOException, InterruptedException {
        // 业务逻辑代
        CollectorRegistry registry = new CollectorRegistry();
        Gauge durationM = Gauge.build().name("azhangjs_cpu_used").help("服务的cpu、内存等使用率指标").labelNames("l").register(registry);
        Gauge durationDb = Gauge.build().name("azhangjs_aff_db_connect").help("数据库的最大连接数、当前连接数指标").labelNames("l").register(registry);
        // 创建一个Random对象
        Random random = new Random();
        Boolean flag = true;
        while(true) {
            try {
                //db
            int randomInRange3 = random.nextInt(1000) + 1;
            int randomInRange4 = random.nextInt(1000) + 1;
            durationDb.labels("max_connections").set(randomInRange3);
            durationDb.labels("max_used_connections").set(randomInRange4);
            float randomInRange1 = random.nextInt(100) + random.nextFloat();
            float randomInRange2 = random.nextInt(100) + random.nextFloat();
            durationM.labels("192.168.0.100").set(randomInRange1);
            durationM.labels("192.168.0.101").set(randomInRange2);
            System.out.println("------"+randomInRange3+"------"+randomInRange4+"------"+randomInRange1+"------"+randomInRange2);

            } finally {

                if(flag) {
                    PushGateway pg = new PushGateway("10.0.0.219:9091");
                    //按照instance推送
                    Map<String, String> insMap = new HashMap<>();
                    insMap.put("instance", "scheduler219");
                    pg.pushAdd(registry, "azhangjs_monitor", insMap);
                    flag = false;
                }else {
                    PushGateway pg = new PushGateway("10.0.0.218:9091");
                    //按照instance推送
                    Map<String, String> insMap = new HashMap<>();
                    insMap.put("instance", "scheduler218");
                    pg.pushAdd(registry, "azhangjs_monitor", insMap);
                    flag = true;
                }
                Thread.sleep(100);
            }
        }
    }
}