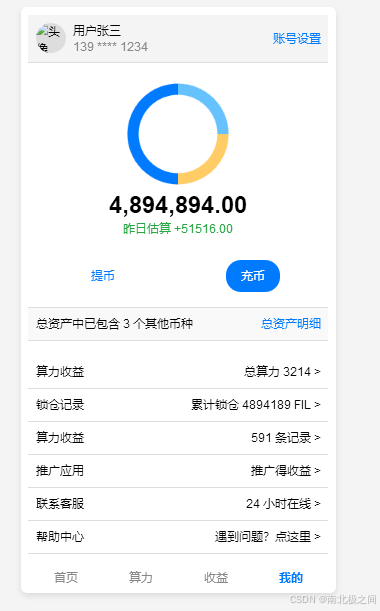
效果图
教程目录
- 简介
- 开发环境准备
- 搭建基本页面结构
- 样式布局与设计
- 添加 Vue 数据绑定
- 集成 ECharts 实现环形图
- 实现交互功能
- 总结与代码回顾
正文教程
1. 简介
在本教程中,我们将学习如何使用 Vue 和 ECharts 创建一个简单的资产管理页面。该页面展示了用户的资产余额、操作按钮、详细信息及图表。通过本教程,您将了解如何结合 Vue 的数据绑定和 ECharts 的图表功能来构建一个功能完善的页面。
2. 开发环境准备
在开始之前,请确保您已经安装了以下开发工具:
- 一个现代浏览器(如 Chrome)
- 一个代码编辑器(如 VS Code)
在页面中,我们将使用外部的 Vue 和 ECharts 库,无需单独下载,直接通过 <script> 标签引入。
3. 搭建基本页面结构
我们先创建一个基本的 HTML 页面结构。在 <body> 中,我们会添加一个 #app 容器,这是 Vue 的挂载点。然后在该容器内添加各个页面部分,包括头部、资产显示、操作按钮、详细信息和底部导航栏。
<!DOCTYPE html>
<html>
<head>
  <meta charset="utf-8">
  <title>我的资产页面 - Vue 示例</title>
  <script src="https://cdn.staticfile.net/vue/2.7.0/vue.min.js"></script>
  <script src="https://cdn.staticfile.net/echarts/5.0.0/echarts.min.js"></script>
</head>
<body>
<div id="app">
  <!-- 头部、资产显示、操作按钮、详细信息、底部导航 -->
</div>
<script>
  new Vue({


    el: '#app',
    mounted() {


      this.initAssetChart();
    },
    methods: {


      initAssetChart() {


        // 初始化图表
      }
    }
  });
</script>
</body>
</html>
4. 样式布局与设计
接下来我们编写 CSS 以实现页面的布局和设计。这里我们定义了背景、字体、布局样式,以及头部、按钮、图表区域等的样式。以下是一些主要的样式代码:
<style>
  body {


    font-family: Arial, sans-serif;
    background-color: #f4f4f4;
    margin: 0;
    padding: 0;
  }
  #app {


    max-width: 400px;
    margin: 20px auto;
    padding: 10px;
    background-color: #fff;
    border-radius: 8px;
    box-shadow: 0 4px 8px rgba(0, 0, 0, 0.1);
  }
  /* 其他样式... */
</style>
5. 添加 Vue 数据绑定
在页面中,我们将通过 Vue 的 data 选项来定义页面中需要的数据,比如用户名、余额、记录等。在模板中,我们可以通过 {
{ }} 插值来绑定数据内容。
new Vue({


  el: '#app',
  data: {


    userName: '用户张三',
    phone: '139 **** 1234',
    totalBalance: 4894894.00,
    yesterdayEstimate: '+51516.00'
  },
  mounted() {


    this.initAssetChart();
  },
  methods: {


    // 图表初始化方法
  }
});
在 HTML 中,可以通过 {
{ userName }} 等方式显示这些数据。
<div class="info">
  <div>{

   { userName }}</div>
  <div style="color: #888;">{

   { phone }}</div>
</div>
<div class="amount">{

   { totalBalance }}</div>
<div class="estimate">昨日估算 {

   { yesterdayEstimate }}</div>
6. 集成 ECharts 实现环形图
接下来是教程的重点:如何使用 ECharts 在页面上添加一个环形图。
- 在
mounted钩子函数中调用initAssetChart()方法,确保页面加载完毕后渲染图表。 - 使用 ECharts 的
setOption()配置环形图的数据和样式。
methods: {


  initAssetChart() {


    const chart = echarts.init(this.$refs.assetChart);
    const option = {


      series: [
        {


          type: 'pie',
          radius: ['70%', '90%'],
          avoidLabelOverlap: false,
          label: {

     show: false },
          labelLine: {

     show: false },
          data: [
            {

     value: 25, name: '质押锁仓', itemStyle: {

     color: '#66c2ff' } },
            {

     value: 25, name: '折合', itemStyle: {

     color: '#ffcc66' } },
            {

     value: 50, name: '资产运作中', itemStyle: {

     color: '#007bff' } }
          ]
        }
      ]
    };
    chart.setOption(option);
  }
}
7. 实现交互功能
为了增强用户体验,我们可以添加一些交互元素,比如 “提币” 和 “充币” 按钮,通过事件绑定为按钮添加点击事件。在页面底部的导航栏部分也可以添加 active 类实现样式切换。
<div class="actions">
  <button class="withdraw" @click="withdraw">提币</button>
  <button class="deposit" @click="deposit">充币</button>
</div>
在 methods 中添加 withdraw 和 deposit 方法,模拟点击事件响应:
methods: {


  withdraw() {


    alert("提币功能待实现");
  },
  deposit() {


    alert("充币功能待实现");
  },
  // 其他方法...
}
8. 总结与代码回顾
通过以上步骤,我们完成了一个 Vue 和 ECharts 集成的个人资产页面,用户可以查看资产详情、账户余额以及通过环形图展示资产构成。以下是完整的代码汇总。
这个教程让新手可以通过 Vue 的数据绑定和 ECharts 的图表集成来构建一个功能页面。希望能帮助到新手了解如何使用这些技术实现复杂的界面布局与数据展示。
完整代码
<!DOCTYPE html>
<html>
<head>
  <meta charset="utf-8">
  <title>我的资产页面 - Vue 示例</title>
  <script src="https://cdn.staticfile.net/vue/2.7.0/vue.min.js"></script>
  <script src="https://cdn.staticfile.net/echarts/5.0.0/echarts.min.js"></script>
  <style>
    body {


      font-family: Arial, sans-serif;
      background-color: #f4f4f4;
      margin: 0;
      padding: 0;
    }
    #app {


      max-width: 400px;
      margin: 20px auto;
      padding: 10px;
      background-color: #fff;
      border-radius: 8px;
      box-shadow: 0 4px 8px rgba(0, 0, 0, 0.1);
    }
    .header {


      display: flex;
      align-items: center;
      padding: 10px;
      background-color: #f4f4f4;
      border-bottom: 1px solid #ddd;
    }
    .header img {


      width: 40px;
      height: 40px;
      border-radius: 50%;
      margin-right: 10px;
      background-color: #ddd;
    }
    .header .info {


      flex: 1;
    }
    .header .settings {


      color: #007bff;
      cursor: pointer;
    }
    .balance-section {


      text-align: center;
      padding: 20px;
    }
    .balance-section .amount {


      font-size: 32px;
      font-weight: bold;
    }
    .balance-section .estimate {


      color: #28a745;
      font-size: 16px;
    }
    .actions {


      display: flex;
      justify-content: space-around;
      margin-top: 10px;
    }
    .actions button {


      padding: 10px 20px;
      border-radius: 20px;
      border: none;
      font-size: 16px;
      cursor: pointer;
    }
    .withdraw {


      background-color: #fff;
      color: #007bff;
      border: 1px solid #007bff;
    }
    .deposit {


      background-color: #007bff;
      color: #fff;
    }
    .details-section {


      margin-top: 20px;
      padding: 10px;
      background-color: #f9f9f9;
      border-top: 1px solid #ddd;
      border-bottom: 1px solid #ddd;
      display: flex;
      justify-content: space-between;
    }
    .info-section {


      margin-top: 20px;
    }
    .info-section .info-item {


      display: flex;
      justify-content: space-between;
      padding: 10px;
      border-bottom: 1px solid #ddd;
    }
    .footer {


      display: flex;
      justify-content: space-around;
      margin-top: 20px;
    }
    .footer div {


      text-align: center;
      color: #888;
    }
    .footer div.active {


      color: #007bff;
      font-weight: bold;
    }
  </style>
</head>
<body>
<div id="app">
  <!-- Header Section -->
  <div class="header">
    <img alt="头像" />
    <div class="info">
      <div>用户张三</div>
      <div style="color: #888;">139 **** 1234</div>
    </div>
    <div class="settings">账号设置</div>
  </div>

  <!-- Balance Section -->
  <div class="balance-section">
    <div ref="assetChart" style="width: 100%; height: 150px;"></div>
    <div class="amount">4,894,894.00</div>
    <div class="estimate">昨日估算 +51516.00</div>
  </div>

  <!-- Action Buttons -->
  <div class="actions">
    <button class="withdraw">提币</button>
    <button class="deposit">充币</button>
  </div>

  <!-- Details Section -->
  <div class="details-section">
    <span>总资产中已包含 3 个其他币种</span>
    <span style="color: #007bff; cursor: pointer;">总资产明细</span>
  </div>

  <!-- Info Section -->
  <div class="info-section">
    <div class="info-item">
      <span>算力收益</span>
      <span>总算力 3214 ></span>
    </div>
    <div class="info-item">
      <span>锁仓记录</span>
      <span>累计锁仓 4894189 FIL ></span>
    </div>
    <div class="info-item">
      <span>算力收益</span>
      <span>591 条记录 ></span>
    </div>
    <div class="info-item">
      <span>推广应用</span>
      <span>推广得收益 ></span>
    </div>
    <div class="info-item">
      <span>联系客服</span>
      <span>24 小时在线 ></span>
    </div>
    <div class="info-item">
      <span>帮助中心</span>
      <span>遇到问题?点这里 ></span>
    </div>
  </div>

  <!-- Footer Navigation -->
  <div class="footer">
    <div>首页</div>
    <div>算力</div>
    <div>收益</div>
    <div class="active">我的</div>
  </div>
</div>

<script>
  new Vue({


    el: '#app',
    mounted() {


      this.initAssetChart();
    },
    methods: {


      initAssetChart() {


        const chart = echarts.init(this.$refs.assetChart);
        const option = {


          series: [
            {


              type: 'pie',
              radius: ['70%', '90%'],
              avoidLabelOverlap: false,
              label: {

       show: false },
              labelLine: {

       show: false },
              data: [
                {

       value: 25, name: '质押锁仓', itemStyle: {

       color: '#66c2ff' } },
                {

       value: 25, name: '折合', itemStyle: {

       color: '#ffcc66' } },
                {

       value: 50, name: '资产运作中', itemStyle: {

       color: '#007bff' } }
              ]
            }
          ]
        };
        chart.setOption(option);
      }
    }
  });
</script>
</body>
</html>