Sklearn数据处理技巧
探索 10 个您可能未见过的 Sklearn 功能,它们可以优雅地替代手动执行的常见操作。
查看Sklearn 的API 参考 (https://scikit-learn.org/stable/modules/classes.html#api-reference),最常用的模型和函数只是该库所能实现的一小部分。
我发现许多估算器、转换器和实用函数可以实现数据处理的绝大多数常见操作。
1. 协方差EllipticEnvelope
数据分布中存在异常值是常见的情况。许多算法都能处理异常值,EllipticEnvelope 是 Sklearn 内置的一个优秀示例。该算法在检测正态分布(高斯)特征中的异常值方面表现出色。下面是一个示例,展示了如何使用 EllipticEnvelope 来检测异常值:
import numpy as np
from sklearn.covariance import EllipticEnvelope

# Create a sample normal distribution
X = np.random.normal(loc=5, scale=2, size=50).reshape(-1, 1)

# Fit the estimator
ee = EllipticEnvelope(random_state=0)
_ = ee.fit(X)

# Test
test = np.array([6, 8, 20, 4, 5, 6, 10, 13]).reshape(-1, 1)
ee.predict(test)
array([ 1, 1, -1, 1, 1, 1, -1, -1])
2. 特征选择 RFECV
选择最有助于预测的特征是对抗过拟合和降低模型复杂性的必要步骤。Sklearn 提供的递归特征消除 (RFECV) 是其中一个强大的工具。它使用交叉验证自动找到最重要的特征并丢弃其余特征。以下是合成数据集上的示例:
from sklearn.datasets import make_regression
from sklearn.feature_selection import RFECV
from sklearn.linear_model import Ridge

# Build a synthetic dataset
X, y = make_regression(n_samples=10000, n_features=15, n_informative=10)

# Init/fit the selector
rfecv = RFECV(estimator=Ridge(), cv=5)
_ = rfecv.fit(X, y)

# Transform the feature array
rfecv.transform(X).shape
(10000, 10)
假数据集有 15 个特征,其中 10 个是有用的,其余的是多余的。
调用向.shape我们展示了成功删除了所有 5 个不必要的特征。
3. 简单分类器/回归器ExtraTreesRegressor
虽然随机森林非常强大,但过拟合风险也很高。Sklearn 提供了一种名为 ExtraTrees 的替代方案,具有更多随机性,可以降低方差但会略微增加偏差。以下是 ExtraTreesRegressor 与其他模型的比较:
from sklearn.ensemble import ExtraTreesRegressor, RandomForestRegressor
from sklearn.model_selection import cross_val_score
from sklearn.tree import DecisionTreeRegressor

X, y = make_regression(n_samples=10000, n_features=20)

# Decision trees
clf = DecisionTreeRegressor(max_depth=None, min_samples_split=2, random_state=0)
scores = cross_val_score(clf, X, y, cv=5)
scores.mean()
0.6908002345849636
# Random Forest
clf = RandomForestRegressor(
    n_estimators=10, max_depth=None, min_samples_split=2, random_state=0
)
scores = cross_val_score(clf, X, y, cv=5)
scores.mean()
0.8738017209916411
# ExtraTrees
clf = ExtraTreesRegressor(
    n_estimators=10, max_depth=None, min_samples_split=2, random_state=0
)
scores = cross_val_score(clf, X, y, cv=5)
scores.mean()
0.8914278722893796
如您所见,ExtraTreesRegressor 在合成数据集上的表现优于随机森林。
4. 数据插补impute.IterativeImputer和KNNImputer
对于更强大和先进的插补技术,Sklearn 提供了 KNNImputer 和 IterativeImputer。
KNNImputer 使用 k-Nearest-Neighbors 算法找到缺失值的最佳替代:
from sklearn.impute import KNNImputer
import numpy as np

X = [[1, 2, np.nan], [3, 4, 3], [np.nan, 6, 5], [8, 8, 7]]
imputer = KNNImputer(n_neighbors=2)
print(imputer.fit_transform(X))
array([[1. , 2. , 4. ],
       [3. , 4. , 3. ],
       [5.5, 6. , 5. ],
       [8. , 8. , 7. ]])
IterativeImputer 更加稳健,通过将每个具有缺失值的特征建模为其余特征的函数来查找缺失值:
from sklearn.experimental import enable_iterative_imputer
from sklearn.impute import IterativeImputer

imp = IterativeImputer(max_iter=10, random_state=0)
print(imp.fit_transform(X))
array([[1. , 2. , 3.989],
       [3. , 4. , 3. ],
       [5.5, 6. , 5. ],
       [8. , 8. , 7. ]])
5. 黑盒可视化tree.plot_tree
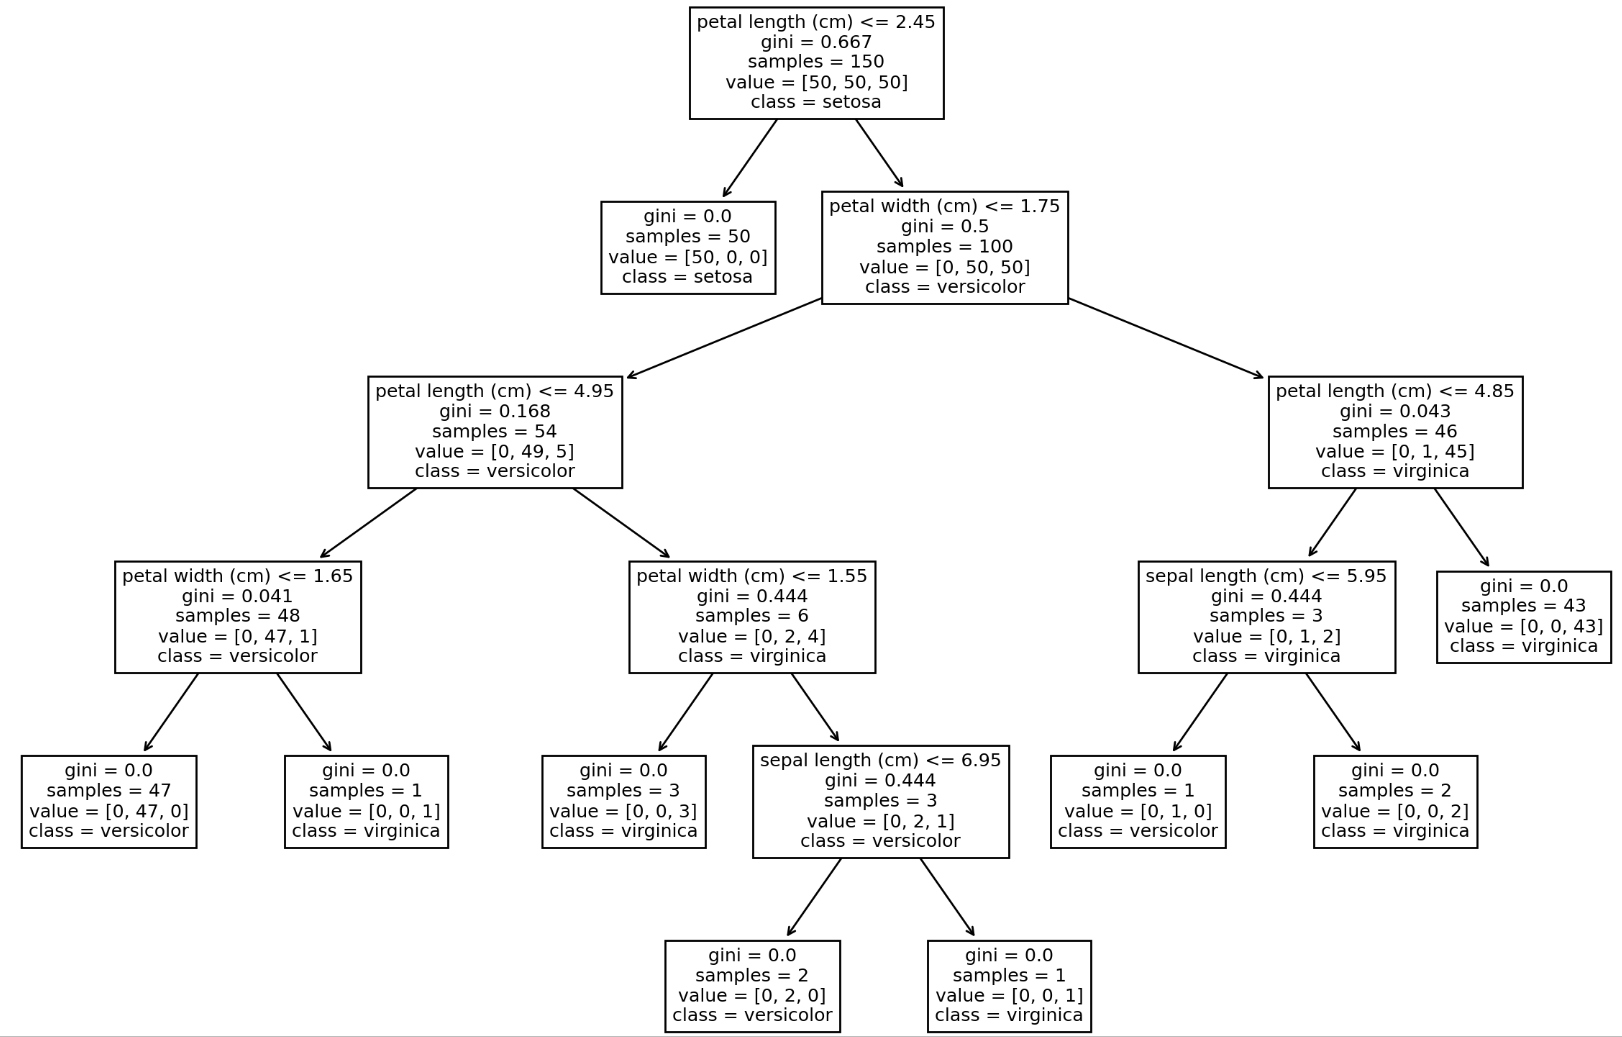
Sklearn 允许你使用 plot_tree 函数绘制单个决策树的结构,对于刚开始学习基于树模型的初学者来说非常有用:
from sklearn.datasets import load_iris
from sklearn.tree import DecisionTreeClassifier, plot_tree
import matplotlib.pyplot as plt

iris = load_iris()
X, y = iris.data, iris.target
clf = DecisionTreeClassifier()
clf = clf.fit(X, y)

plt.figure(figsize=(15, 10), dpi=200)
plot_tree(clf, feature_names=iris.feature_names, class_names=iris.target_names)
plt.show()
6. 线性模型感知机Perceptron
Perceptron 是一个简单的线性二元分类器,适用于大规模学习:
from sklearn.datasets import make_classification
from sklearn.linear_model import Perceptron

# Create a large dataset
X, y = make_classification(n_samples=100000, n_features=20, n_classes=2)

# Init/Fit/Score
clf = Perceptron()
_ = clf.fit(X, y)
clf.score(X, y)
0.97345
特征选择 SelectFromModel
Sklearn 提供的 SelectFromModel 是另一种基于模型的特征选择估计器,对于大数据集非常有效:
from sklearn.feature_selection import SelectFromModel

# Make a dataset with 40 uninformative features
X, y = make_regression(n_samples=int(1e4), n_features=50, n_informative=10)

# Init the selector and transform feature array
selector = SelectFromModel(estimator=ExtraTreesRegressor()).fit(X, y)

selector.transform(X).shape
(10000, 7)
混淆矩阵 ConfusionMatrixDisplay
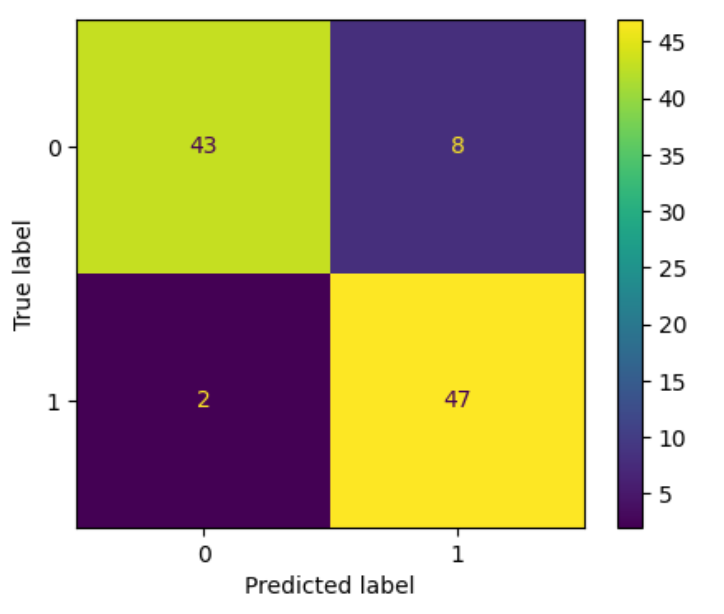
混淆矩阵是分类问题的圣杯,Sklearn 允许您计算和绘制混淆矩阵:
from sklearn.metrics import ConfusionMatrixDisplay
from sklearn.model_selection import train_test_split
import sklearn

# Make a binary classification problem
X, y = make_classification(n_samples=200, n_features=5, n_classes=2)
X_train, X_test, y_train, y_test = train_test_split(
    X, y, test_size=0.5, random_state=1121218
)

clf = sklearn.tree.ExtraTreeClassifier().fit(X_train, y_train)

fig, ax = plt.subplots(figsize=(5, 4), dpi=100)
ConfusionMatrixDisplay.from_estimator(clf, X_test, y_test, ax=ax);
9. 数据预处理 PowerTransformer
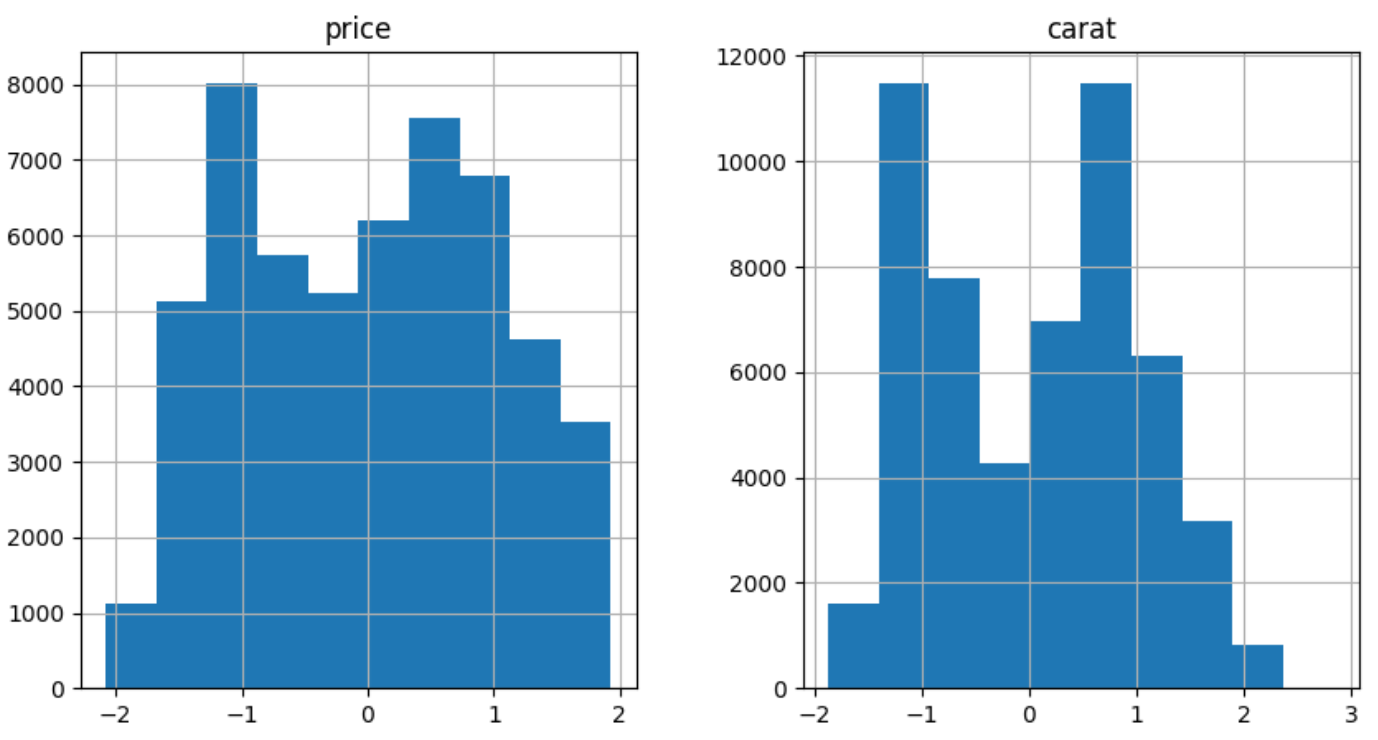
对于高偏态数据,Sklearn 实现了 PowerTransformer,使用对数变换将倾斜特征转换为正态分布:
import seaborn as sns
import pandas as pd
diamonds = pd.read_csv("../data/diamonds.csv")
diamonds[["price", "carat"]].hist(figsize=(10, 5));
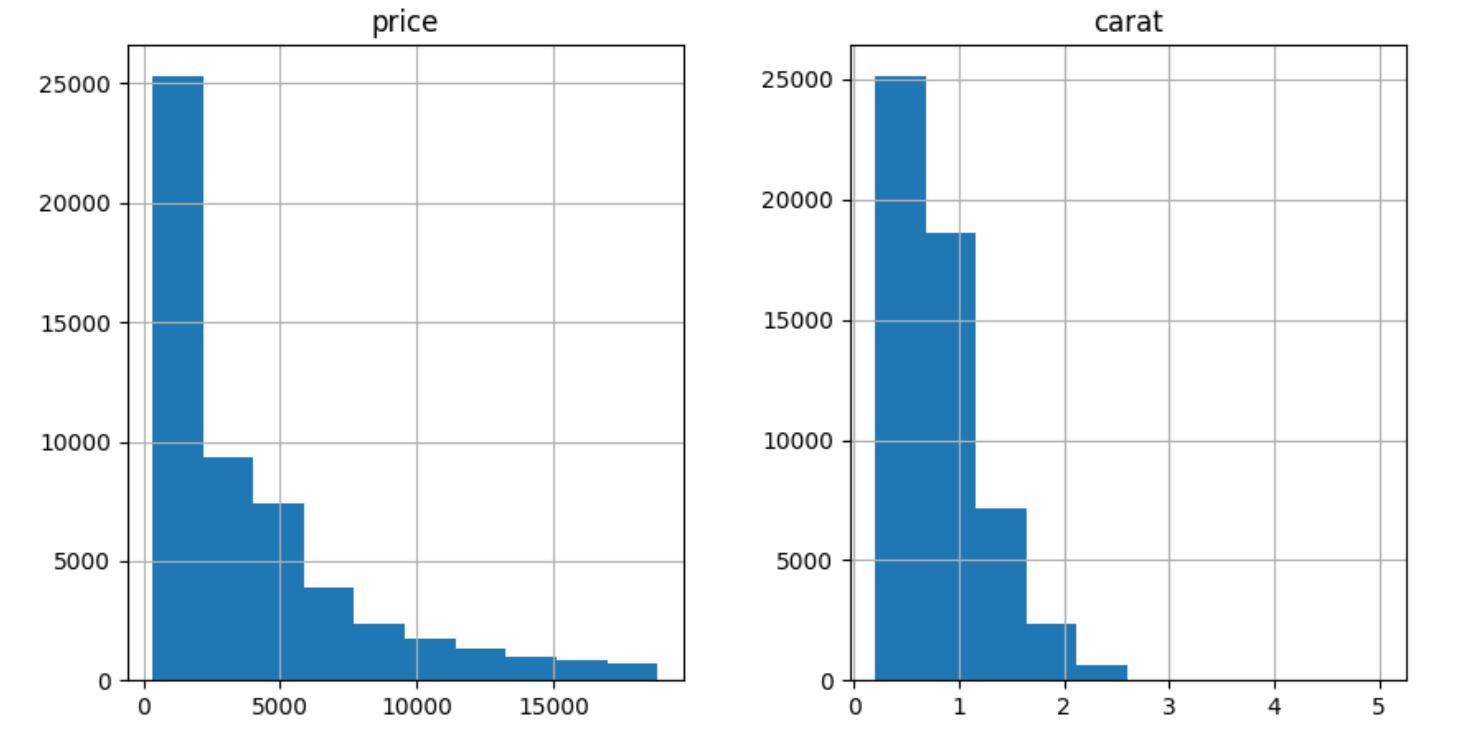
两者都严重倾斜。让我们使用对数变换来解决这个问题:
from sklearn.preprocessing import PowerTransformer

pt = PowerTransformer()
diamonds.loc[:, ["price", "carat"]] = pt.fit_transform(diamonds[["price", "carat"]])

diamonds[["price", "carat"]].hist(figsize=(10, 5));
10. 模型组合make_pipeline
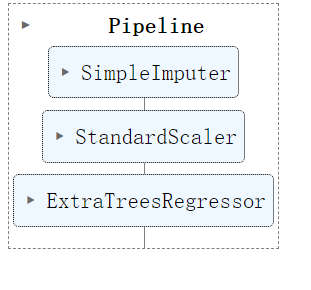
在 Sklearn 中,有一种使用make_pipeline函数创建 Pipeline 实例的简写方法。该函数无需命名每个步骤,也无需让代码变得冗长,只需接受转换器和估算器并完成其工作:
from sklearn.impute import SimpleImputer
from sklearn.pipeline import make_pipeline
from sklearn.preprocessing import StandardScaler
from sklearn.ensemble import ExtraTreesRegressor, RandomForestRegressor

pipeline = make_pipeline(SimpleImputer(), StandardScaler(), ExtraTreesRegressor())

pipeline
通过掌握这些 Sklearn 工具,您可以大大提高数据处理和模型训练的效率。希望这些技巧对您有所帮助!