K-means聚类算法-python实现简单示例
想搞点有意思的东西,参考[K-means聚类算法(https://www.cnblogs.com/jerrylead/archive/2011/04/06/2006910.html)做了一些实现。记录如下。
代码主要过程:
- 生成数据D(d1,d2,…,di);
- 执行分类:
2.1. 按照group数量,初始化group 中心( u1, u2,…ux);
2.2. 遍历数据,按照di与各个中心的距离distancex,i,选择distancex,i最小的,作为di的类;
2.3. 更新分组中心值。对每个分组,取该组所有成员对应坐标的平均值,形成预期的 分组中心A(ah,bh)。将分组中与A距离最近的点(di),作为分组的新中心;
2.4. 检查所有分组的中心值是否发生变化。如果没有变化,视为训练完成(此处为实现时的逻辑漏洞);如果超过训练次数,则视为训练完成(此处为实现时的逻辑问题,见参考博客,存在严谨的校验方法);
2.5. 从2.2开始继续训练; - 展示分类结果;
实际代码
# coding=UTF-8
import numpy as np
import math
import matplotlib.pyplot as plt
import copy
class Group(object):
''' group structure
1) mainly provide group_center update;
2) pay attention that, all members are public,
no interface is avaliable
'''
center_ar = np.array([0, 0])
members = []
def UpCenter(self):
sum_xy = np.sum(self.members, axis=0)
mean = sum_xy/len(self.members)
pre_center = self.center_ar
shortest_dis = Group.distance(self.center_ar, mean)
for member in self.members:
if Group.distance(member, mean) < shortest_dis:
pre_center = member
shortest_dis = Group.distance(member, mean)
self.center_ar = pre_center
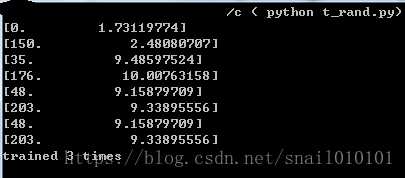
print(self.center_ar)
@staticmethod
def distance(ar_x, ar_y):
''' calculate the distance of array_x and array_y
1) assume that ar_x and ar_y has only one object;
2) assume that ar_x and ar_y should has same dimensional
'''
(a1, ) = np.shape(ar_x)
(a2, ) = np.shape(ar_y)
if a1 != a2:
return 1000
diff_mat = ar_x - ar_y
sq_diff_mat = diff_mat ** 2
sq_distance = np.sum([sq_diff_mat], axis=1)
return (sq_distance ** 0.5)[0]
class K_MEANS(object):
group_num = 1
groups = []
data_arrays = []
def __init__(self, groups = 1, data_ars = [], max_times = 10):
self.group_num = groups
last_centers = []
now_centers = []
for cnt in range(self.group_num):
# make sure no index out of range
cnt = (cnt + len(data_ars)) % len(data_ars)
this_group = Group()
this_group.center_ar = data_ars[cnt]
self.groups.append(this_group)
now_centers.append(this_group.center_ar)
self.data_arrays = data_ars
for time in range(max_times):
last_centers.clear()
last_centers = copy.deepcopy(now_centers)
now_centers.clear()
now_centers = []
self.UpdateOnce()
for cnt in range(len(self.groups)):
now_centers.append(self.groups[cnt].center_ar)
if not K_MEANS.is_changed(now_centers, last_centers):
print("trained %d times" % time)
break
@staticmethod
def is_changed(ars1, ars2):
''' judge if two array lists diff
1) used to judge if each groups' center chagned
'''
change_sum = 0
for cnt in range(len(ars1)):
change_sum += np.sum(ars1[cnt] - ars2[cnt])
return False if change_sum == 0 else True
def UpdateOnce(self):
''' update group info once
'''
for group in self.groups:
group.members.clear()
group.members = []
for data_ar in self.data_arrays:
short_group = self.groups[-1]
short_dist = Group.distance(data_ar, short_group.center_ar)
for group in self.groups:
this_dist = Group.distance(data_ar, group.center_ar)
if this_dist < short_dist:
short_dist = this_dist
short_group = group
short_group.members.append(data_ar)
for group in self.groups:
group.UpCenter()
# try to create two group data
x1 = [x for x in range(100)]
x2 = [x for x in range(150, 250)]
x = x1 + x2
y = [0]*len(x)
ars = []
for i, t in enumerate(x):
np.random.seed(t)
tmp = t % 10 + 1
y[i] = tmp*np.exp(np.random.random())
ars.append(np.array([t, y[i]]))
# use K_means to clarrify data
k_mean = K_MEANS(2, ars)
# show the result
group1 = k_mean.groups[0]
group2 = k_mean.groups[1]
x1 = []; x2 = []; y1 = []; y2 = []
for mem in group1.members:
x1.append(mem[0])
y1.append(mem[1])
cent1_x = [group1.center_ar[0]]
cent1_y = [group1.center_ar[1]]
for mem in group2.members:
x2.append(mem[0])
y2.append(mem[1])
cent2_x = [group2.center_ar[0]]
cent2_y = [group2.center_ar[1]]
# https://matplotlib.org/api/_as_gen/matplotlib.pyplot.figure.html#matplotlib.pyplot.figure
plt.figure(1)
# https://matplotlib.org/api/_as_gen/matplotlib.pyplot.plot.html#matplotlib.pyplot.plot
# show different group in different color, and each groups' center in different type
# for obviously showing, notice the color of group center
plt.plot(x1, y1, 'b.',cent1_x, cent1_y, 'go', x2, y2, 'g.', cent2_x, cent2_y, 'bo')
plt.figure(2)
plt.plot(x, y, '.')
plt.show()运行结果
环境:python-3.6.4 windows
依赖包:numpy, matplotlib

问题记录
- 数据特别稠密的时候,需要引入其他方法处理