版权声明:本文为博主原创文章,未经博主允许不得转载。 https://blog.csdn.net/Waves___/article/details/88389911
1 Grafana安装
1.1 grafana安装 ,我的版本为grafana 6.0
1.2 grafana启动
在命令行输入(我的系统是Ubuntu16):
sudo service grafana-server start1.3 grafana打开
在浏览器里输入: http://localhost:3000/
官网的入门教程: Getting started
grafana的日志文件在 /var/log/grafana/grafana.log
2 Elastic search安装
我的版本为elastic search 6.6
3 开始了
3.1 在elastic search新建一个index
启动elastic search后,在命令行输入:
curl -H "Content-Type: application/json" -X PUT 'localhost:9200/logs_test' -d '
{
  "mappings": {
    "log-info": {
      "properties": {
        "level": {
          "type": "text"
        },
        "desc": {
          "type": "text"
        },
        "local_time": {
          "type": "date",
          "format": "yyyy-MM-dd HH:mm:ss,SSS"
        }
      }
    }
  }
}' | python -m json.tool
查看所有index: curl -X GET 'http://localhost:9200/_cat/indices?v'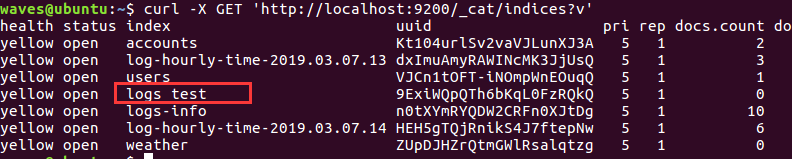
3.2 grafana添加elastic search数据源


3.3 创建dashboard


3.4 向elastic search插入数据
在命令行输入以下指令:
curl -H "Content-Type: application/json" -X POST 'localhost:9200/logs_test/log-info' -d '
{
  "level": "info",
  "desc": "some information",
  "local_time": "2019-03-11 11:30:11,000"
}' | python -m json.tool
注意local_time的具体时间自己修改,最好是当前的时间,在grafana好显示。
我输入了两条记录,命令行输入:
curl 'localhost:9200/logs_test/_search?pretty=true'查看记录: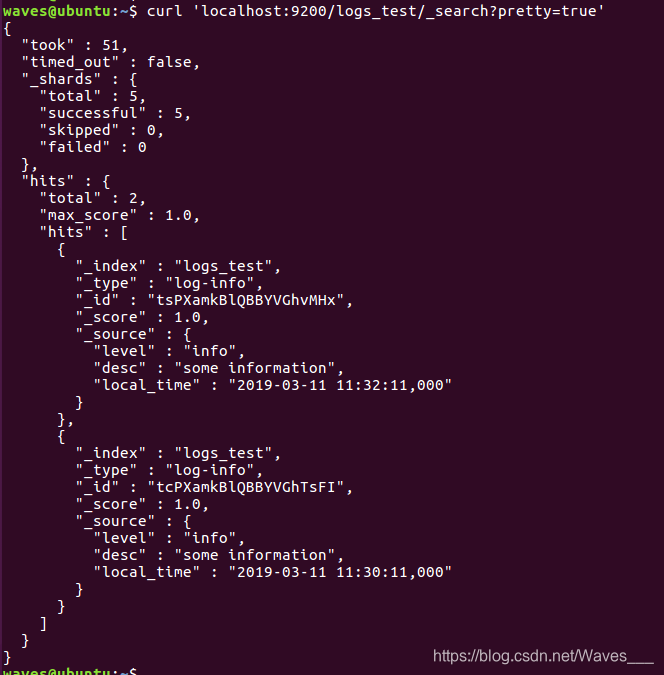
3.5 在grafana查看
由于grafana的系统时间是用的UTC时间,而我的Ubuntu的系统时间是用的CST时间,CST = UTC + 8h,因此在查看结果时要把时间往后移8小时,这个坑搞了我很久。。。

调整好就可以看到结果了:
可以再创建一个dashboard看看效果


最终效果:
