以下是官方说明文档链接
numpy.random.multivariate_normal
- 1.函数定义
numpy.random.multivariate_normal(mean, cov[, size, check_valid, tol]) - 2.参数解释
Parameters:
mean : 1-D array_like, of length N
Mean of the N-dimensional distribution.
cov : 2-D array_like, of shape (N, N)
Covariance matrix of the distribution. It must be symmetric and positive-semidefinite for proper sampling.
size : int or tuple of ints, optional
Given a shape of, for example, (m,n,k), mnk samples are generated, and packed in an m-by-n-by-k arrangement. Because each sample is N-dimensional, the output shape is (m,n,k,N). If no shape is specified, a single (N-D) sample is returned.
check_valid : { ‘warn’, ‘raise’, ‘ignore’ }, optional
Behavior when the covariance matrix is not positive semidefinite.
tol : float, optional
Tolerance when checking the singular values in covariance matrix.
| 1 | 2 |
|---|---|
| mean | 表示高斯分布的均值,mean纬度为N,表示N维高斯分布 |
| conv | 表示高斯分布的协方差矩阵,一维高斯的协方差矩阵纬度为11,二维高斯的协方差矩阵纬度为22... |
| size | mean和conv定义了一个高斯分布,这个函数是用定义好的高斯分布里生成若干个值,如果size为 (m,n,k),则会返回一个 (m,n,k)大小的采样值 |
| check_valid | 检验协方差矩阵,当矩阵不是半正定时,输出警告、忽略、raise..... |
| tol | 对协方差矩阵的奇异值进行检查时的容忍度,应该是在检验协方差矩阵时,对奇异值进行判断的误差 |
- 3.使用
(1)
'''
import numpy as np
import matplotlib.pyplot as plt
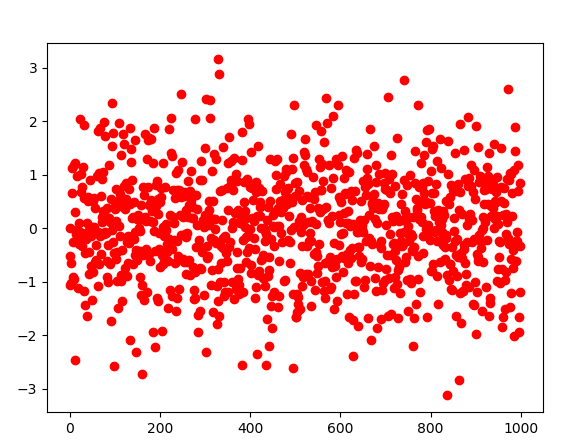
Y = np.random.multivariate_normal([(0)], [[1]], 1000)
plt.plot(Y,'ro')
'''
采集1000个符合0均值,1协方差的高斯分布的点,下图纵轴表示采集到的点的值,横轴表示点的序号,可以看出所有点的值大致是符合N(0,1)分布的。