Preface
Common infectious disease models can be divided into SI, SIS, SIR, SIRS, SEIR models according to the characteristics of specific infectious diseases. The actual meanings of "S", "E", "I", and "R" are as follows:
S (Susceptible), susceptible , refers to a healthy person who lacks immunity and is susceptible to infection after contact with an infected person;
E (Exposed), refers to people who have been in contact with infected people but are not infectious, and can be used for infectious diseases with incubation period;
I (Infectious), sick person , refers to a patient who is infectious and can be transmitted to S, turning it into E or I;
R (Recovered) refers to a person who has immunity after recovery. If it is a lifelong immune infectious disease, it cannot be changed to S, E or I. If the immunity period is limited, it can be changed to S again. And get infected.
2. SIS infectious disease model and matlab code
It is suitable for only susceptible people and sick people, but recurrent diseases. Such as bacillary dysentery and other diseases with low immunity after cure.
Record the total number of people as N, then N=S+E+I+R, which is the quantitative relationship of various groups of people. There is no E and R in the SI model, that is
Let i and s be the ratio of the susceptible person S and the sick person I to the total N,
The relationship between the susceptible person S and the sick person I is that the sick person contacts the susceptible person to convert the susceptible person into the sick person, and the more susceptible people and the more sick people, the more susceptible people become sick people. The more people there are. Remember that a single patient contacts a susceptible person every day , which
is the contact rate, that is, the proportion of susceptible persons that a single patient contacts on average every day.
The ratio of the number of patients cured every day to the total number of patients is the daily cure rate.
Then the rate of increase of sick people every day is
The daily increase in the number of sick people is
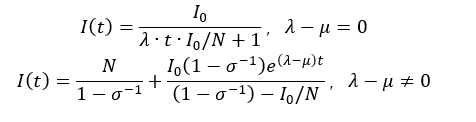
记 σ = λ / μ

Converted into quantity:
The matlab code is as follows
clc;
close all;
clear all;
I=10;
N=10000;
S=N-I;
lemda=0.1;
mu=0.05;
t=1:365;
for i=1:(size(t,2)-1)
    I(1+i)=I(i)+I(i)*(N-I(i))*lemda/N-mu*I(i);
    S(1+i)=N-I(1+i);
end
plot(t,I,t,S)
xlabel('时间')
ylabel('人数')
legend('患病者','易感者')
title('SI传染病模型')
The result is as follows, λ<μ λ>μ

