To use historical data to make business predictions, we must first know what can be predicted, for example:
When a bank makes a loan, it hopes to predict whether the current lender may default?
The insurance company hopes to predict the customer’s claim risk, so as to set premiums more flexibly, with high risks and high charges, low risks and low charges
Banks have many kinds of financial products, hoping to predict which users will buy which products, and conduct sales activities more accurately
In industrial production, companies hope to predict the operating status of equipment and reduce unplanned parking
Shopping malls and supermarkets hope to predict the sales of products, so that they can prepare goods carefully and reduce inventory
Internet financial credit business, hoping to predict the flow of loaned funds and manage cash flow reasonably
……
……
If we have enough historical data at hand, then these tasks are possible. For example, in task 1, we can find a certain rule from the loan information records of the past years. This information includes the income level, debt situation, loan amount, term, interest rate, job position, living conditions, and transportation habits of the lender And so on, in particular, there must be information about whether the loan has defaulted in the past. In this way, when you encounter a new loan customer, you can match the rules according to the customer's various information to determine how likely the current customer is to default. Of course, this kind of prediction does not guarantee 100% accuracy (there are many ways to evaluate its accuracy), so if there is only one target (for example, only one loan) that needs to be predicted, it is meaningless. But usually, we will have a lot of cases to predict, so even if not every case can be predicted correctly, but a certain accuracy rate can be guaranteed, which is still very meaningful. For the loan business, the predicted high-risk customers may not be true, but as long as the accuracy rate is high enough, risks can still be effectively prevented.
Using historical data to make predictions involves three steps: 1 prepare historical data → 2 find out the rules from historical data, which we call building a model → 3 use the established model to make predictions.
1. Prepare historical data
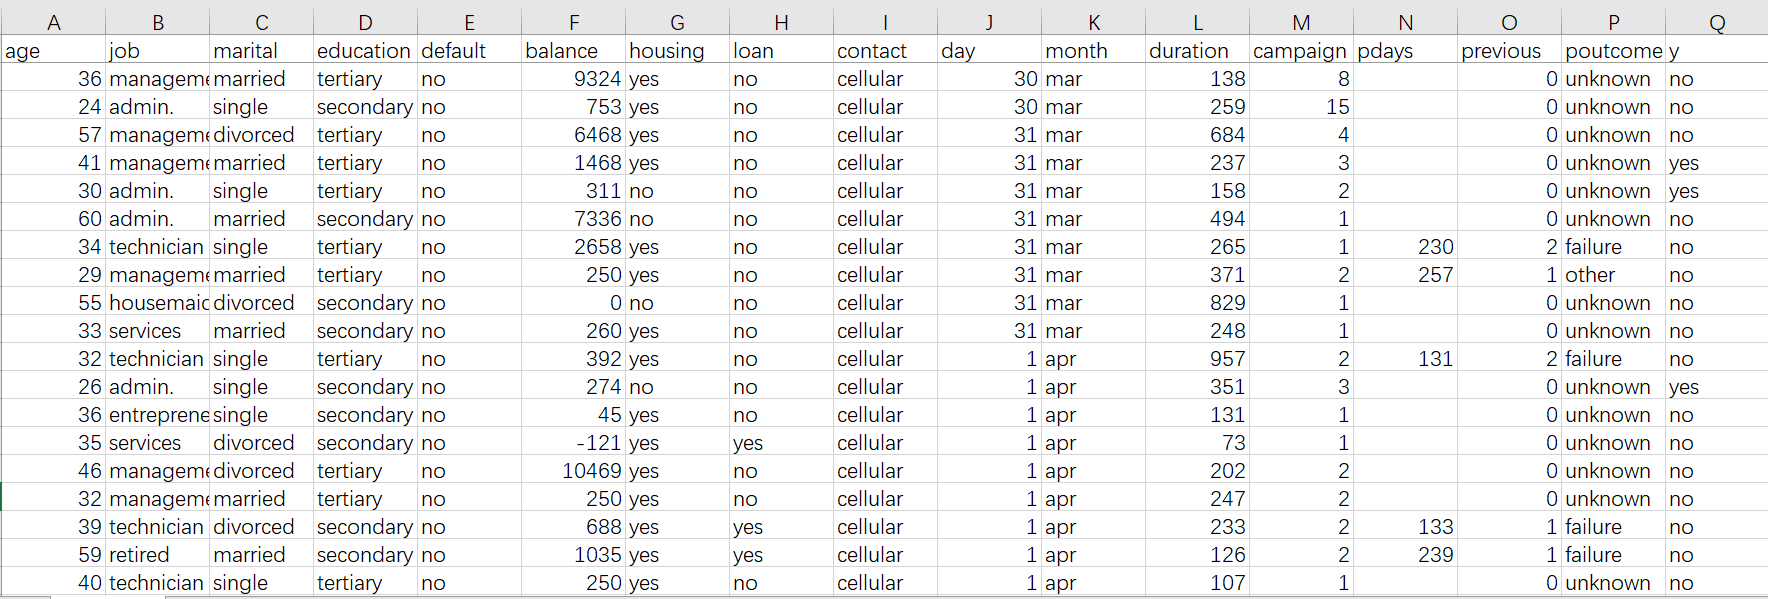
Historical data is usually a wide table as we commonly call it. For example, an Excel table like the following figure: Use some basic information of the user to predict whether a breach of contract will occur
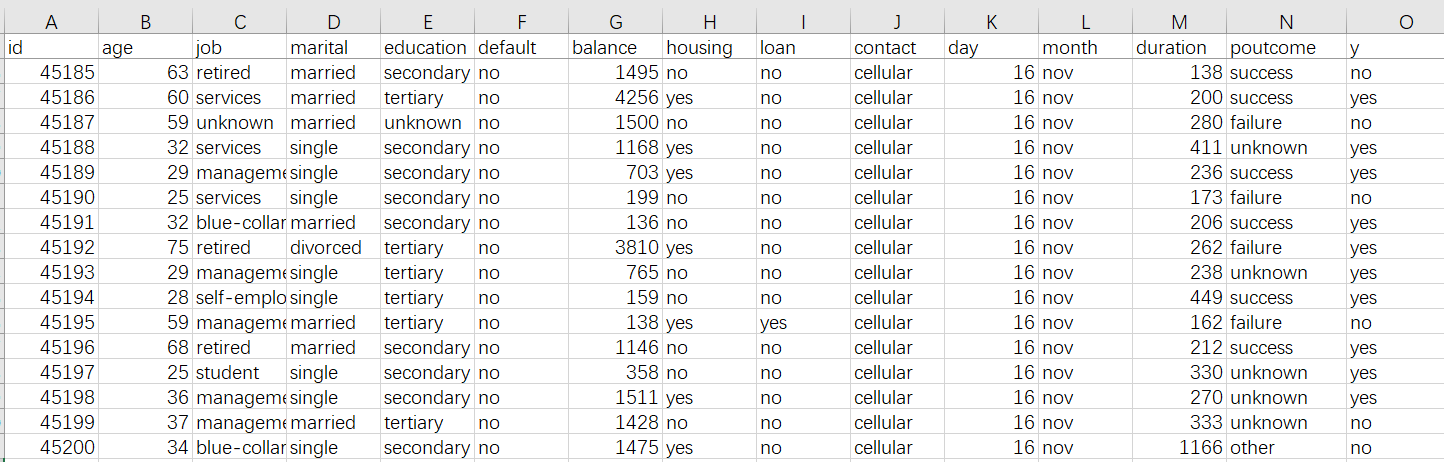
First of all, the wide table must include what we want to predict, which is usually called the prediction target. The prediction target in the above figure is the default behavior of historical users, that is, in the y column in the figure, yes means default and no means no default. The forecast target can also be a numerical value, such as product sales, selling price..., or what kind of prediction it belongs to, such as predicting whether the product quality is excellent, good, qualified, or poor. Sometimes the target is in the original data and can be used directly, and sometimes the target needs to be manually labeled.
In addition to predicting the target, a lot of information is needed here, such as the user’s age, work, real estate, and loan status in the table. Each column here is called a variable , which is information related to whether the lender may default on the contract in the future. Principles The more variables that can be collected, the better. For example, to predict whether a customer will buy a product, you can collect customer behavior information, shopping preferences, product feature information, promotion efforts, etc.; to predict the risk of auto insurance claims, you need insurance policy data, vehicle information, car owner traffic habits, and historical claims, etc. If it is to predict health insurance, it also needs some information about the life habits, physical condition, and medical treatment of the insured; predicting the sales of supermarkets and shopping malls requires historical sales orders, customer information, and product information; predicting bad products, which require production Process parameters, environment, raw material conditions and other data. In short, the more relevant information collected, the better the forecast.
When collecting data, we usually intercept historical data from a certain period to make a wide table. For example, if we want to predict the default of users in July, we can collect data from January to June to build a model. The time range of data collection is not fixed and can be operated flexibly, for example, it can be nearly 1 year or nearly 3 months and so on.
The prepared wide table should be saved in csv format. The first line is the title, and each subsequent line is a history record. You can use Excel to save the data in csv format.
If the company has a well-built information system, you can ask the IT department for the data. Many companies can directly export this data in the BI system (the format may be different and you can use Excel to convert).
2. Use YModel to build a model
After the wide table is ready, you can use YModel to build a model.
YModel is an artifact specially designed for business personnel and beginners without professional background. The operation is very simple and can be downloaded from http://www.raqsoft.com/ymodel-download .
(1) Import data
Click the "New model"  button to import the data (that is, the organized wide table). During the data import process, YModel will automatically detect the data type and automatically calculate various statistics.
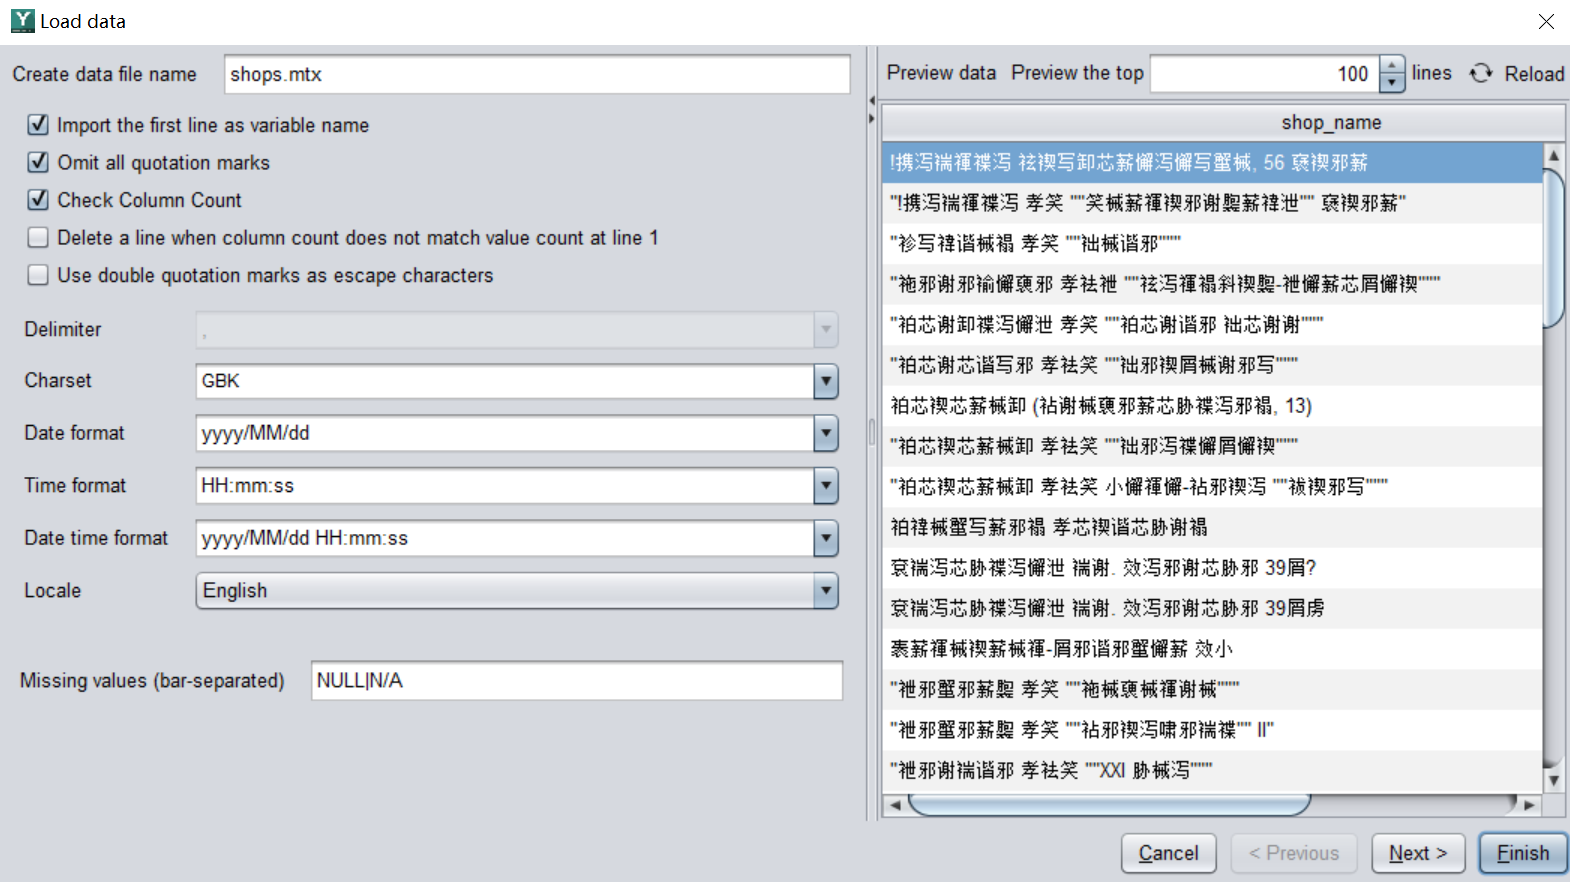
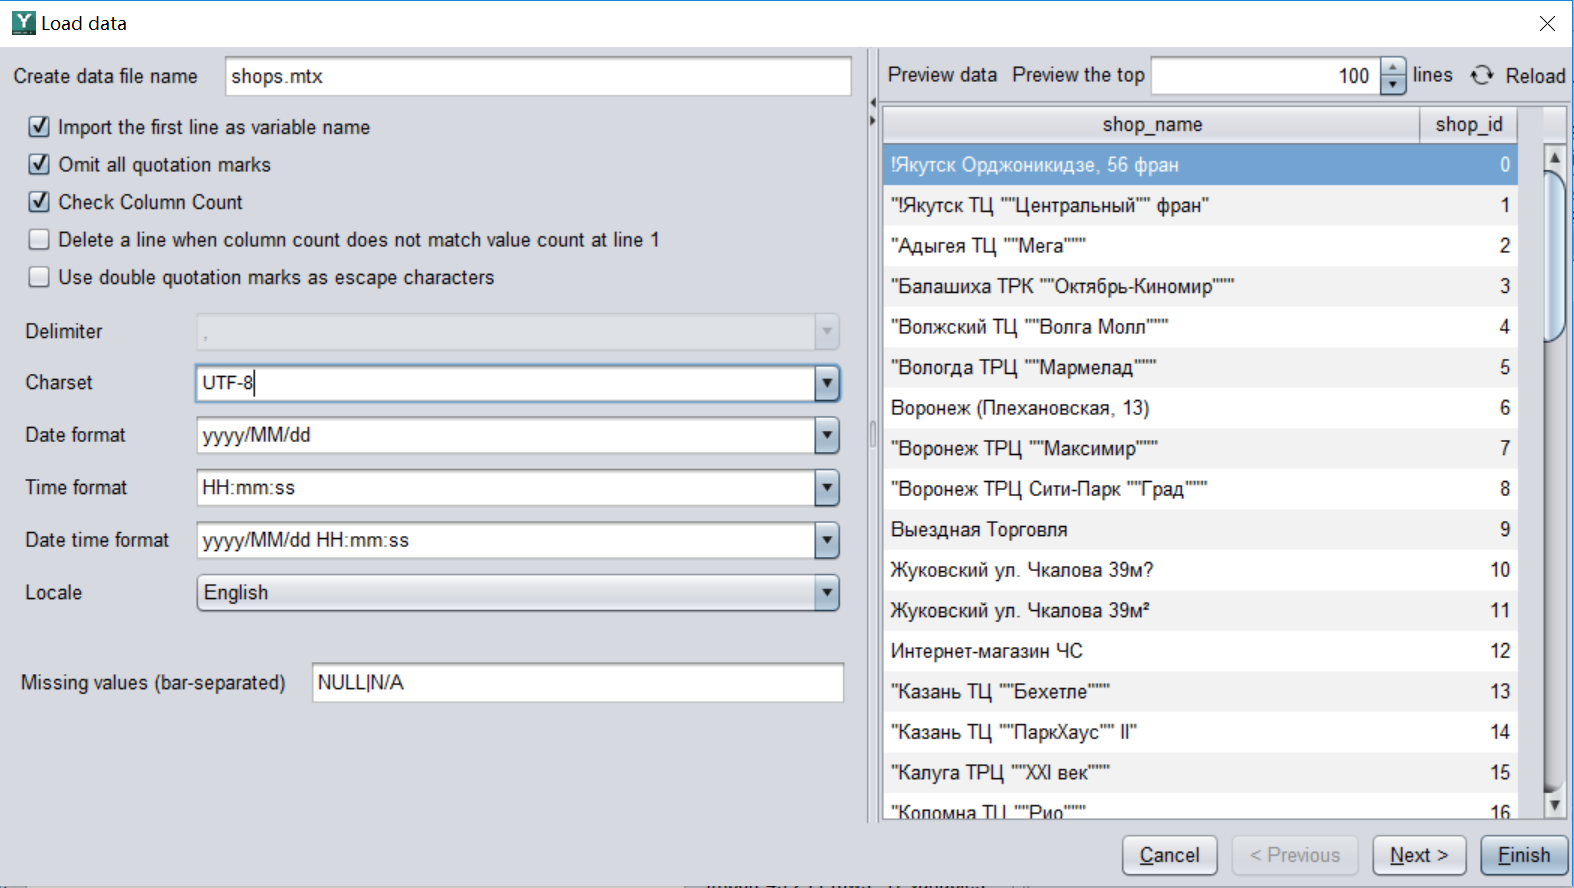
Some errors sometimes occur during the initial import, such as garbled text, incorrect date format, and missing values are not recognized. You only need to go back to the import interface to configure the format, and then import it. For example, in the following two pictures, the "shop_name" column is garbled through the data preview, which is inconsistent with the default character format. Therefore, you need to modify the configuration of the character format, and the text can be recognized normally.
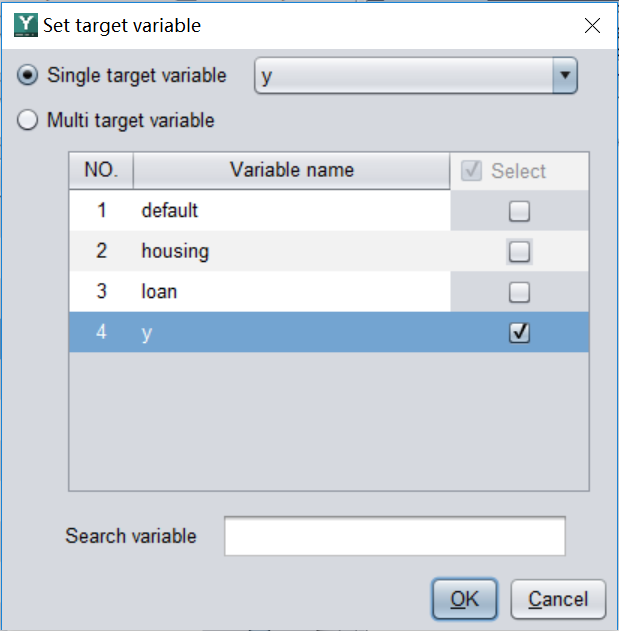
(2) Configure forecast targets
After importing the data, configure the forecast target. Called the target variable .
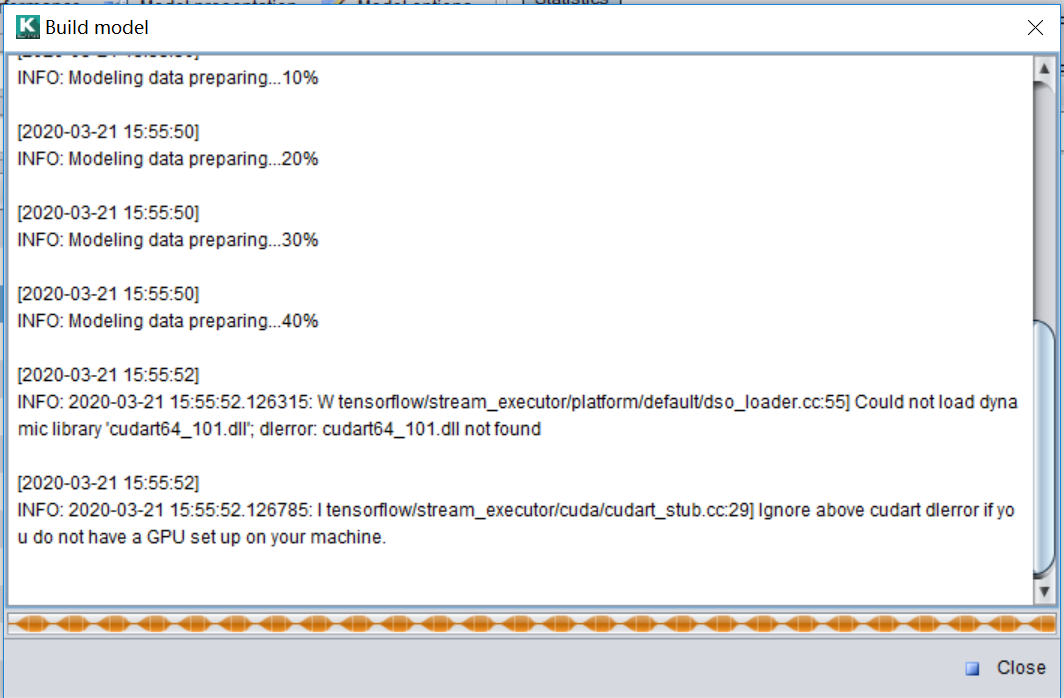
(3) Build a model
Configure the target variables, click the "Modeling"  button, and you're done. The entire data preprocessing and modeling process is carried out automatically without manual operation.
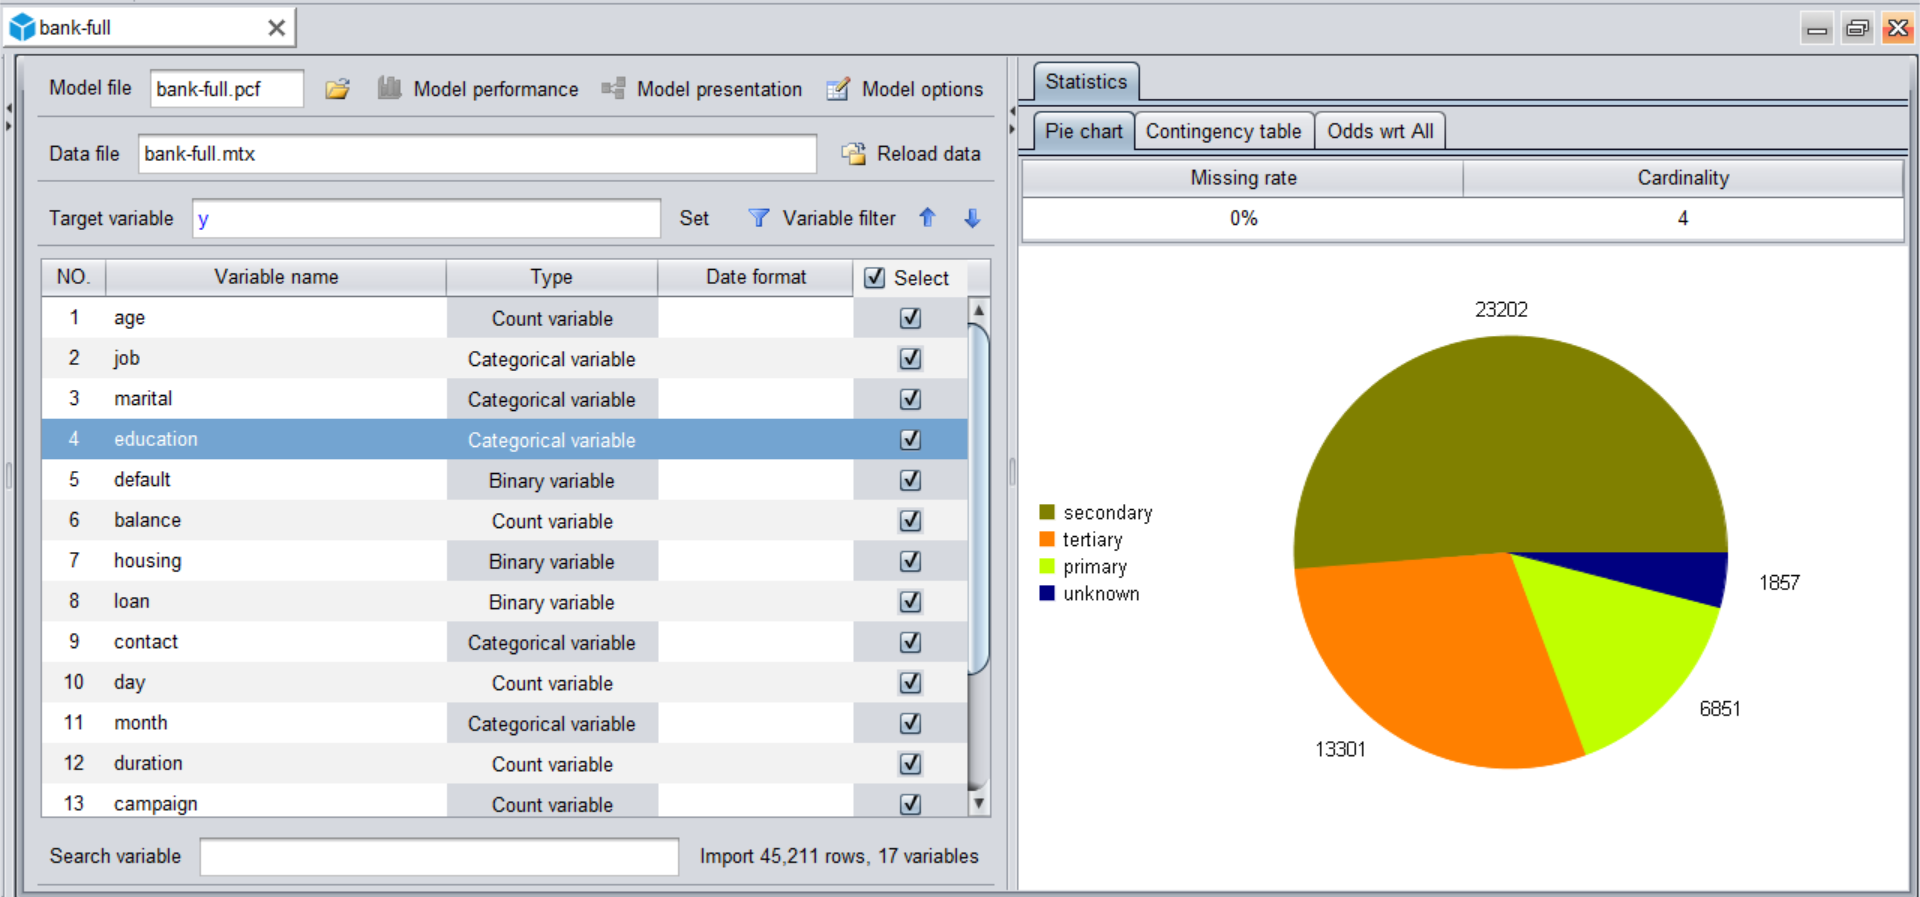
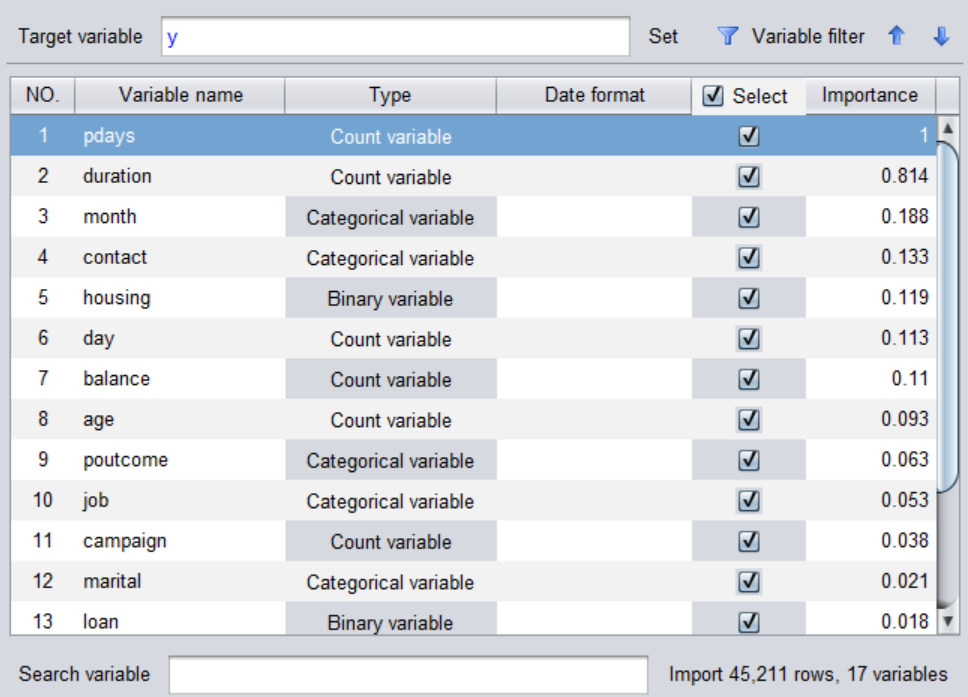
The model can be built in about a few minutes to tens of minutes (sometimes shorter, depending on the amount of data). The interface will return the importance of each variable. The greater the importance, the more the variable can affect the prediction target. Using this function can help us do some business analysis. For example, when the forecast target is sales, we can find some important factors that affect sales.
After the model is built, the system will write out a model file with a .pcf suffix for prediction. If you still need to save the modeling process, you can click the "Save"  button to generate a modeling file with the suffix .mcf. Only the model has no data in the pcf model file, and the mcf file contains data and modeling configuration information.
3. Use YModel to predict
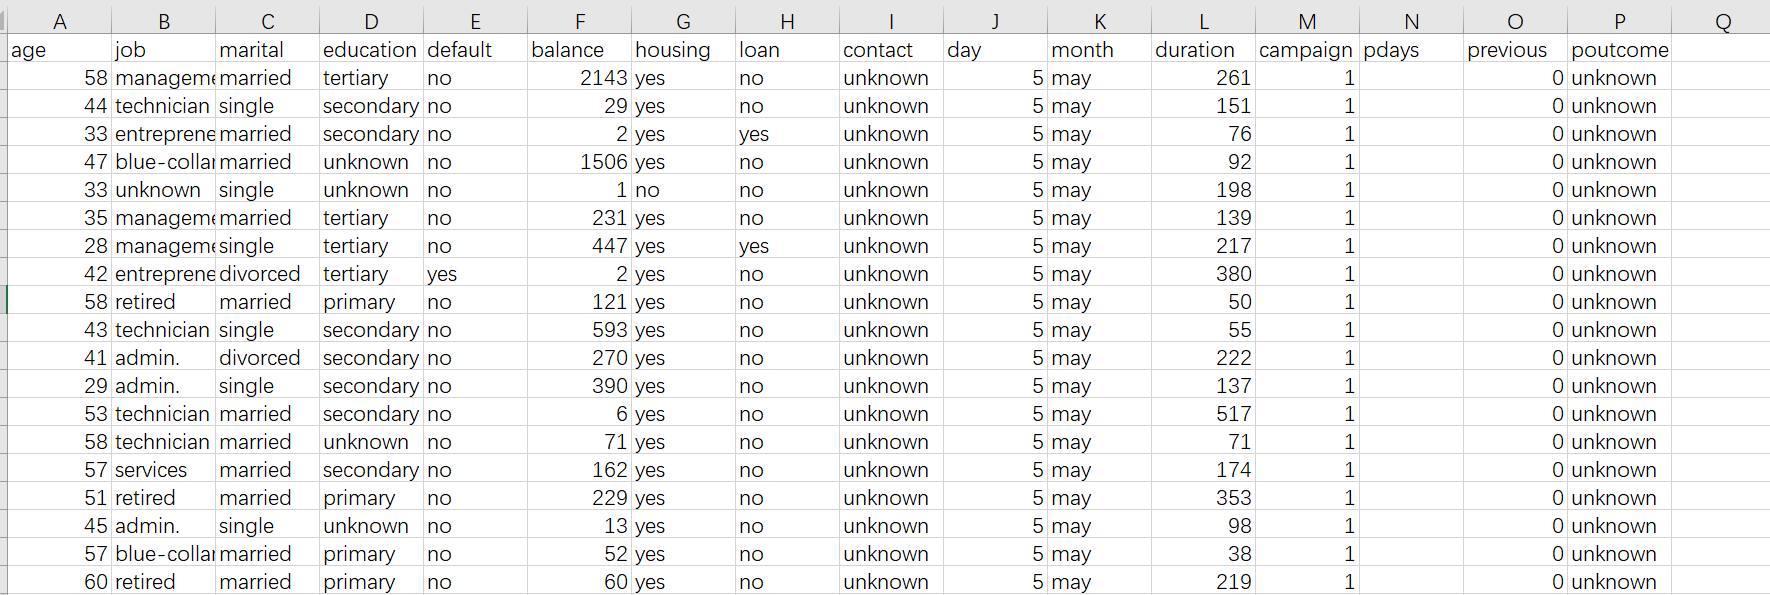
Click the "Scoring"  button at the top left of the YModel interface , open the pcf model file generated in step 2, and import the data set to be predicted (the data is still in csv format, and the variables used for modeling (columns in csv) must be the same, but there is no Forecast target) make predictions, such as the two tables in the figure below, the difference is that one has y and the other does not have y.
After importing, click the "Scoring" button at the top right of the interface to make predictions, and you can get the following interface after completion. The leftmost column is the prediction result. In this example, the percentage represents the probability of a customer defaulting, and the greater the probability of defaulting the customer The higher the risk. We can consider high-risk customers based on the predicted probability of default exceeding a certain threshold (the specific threshold depends on business experience. If you lack experience, you can simply use 50% to calculate it).
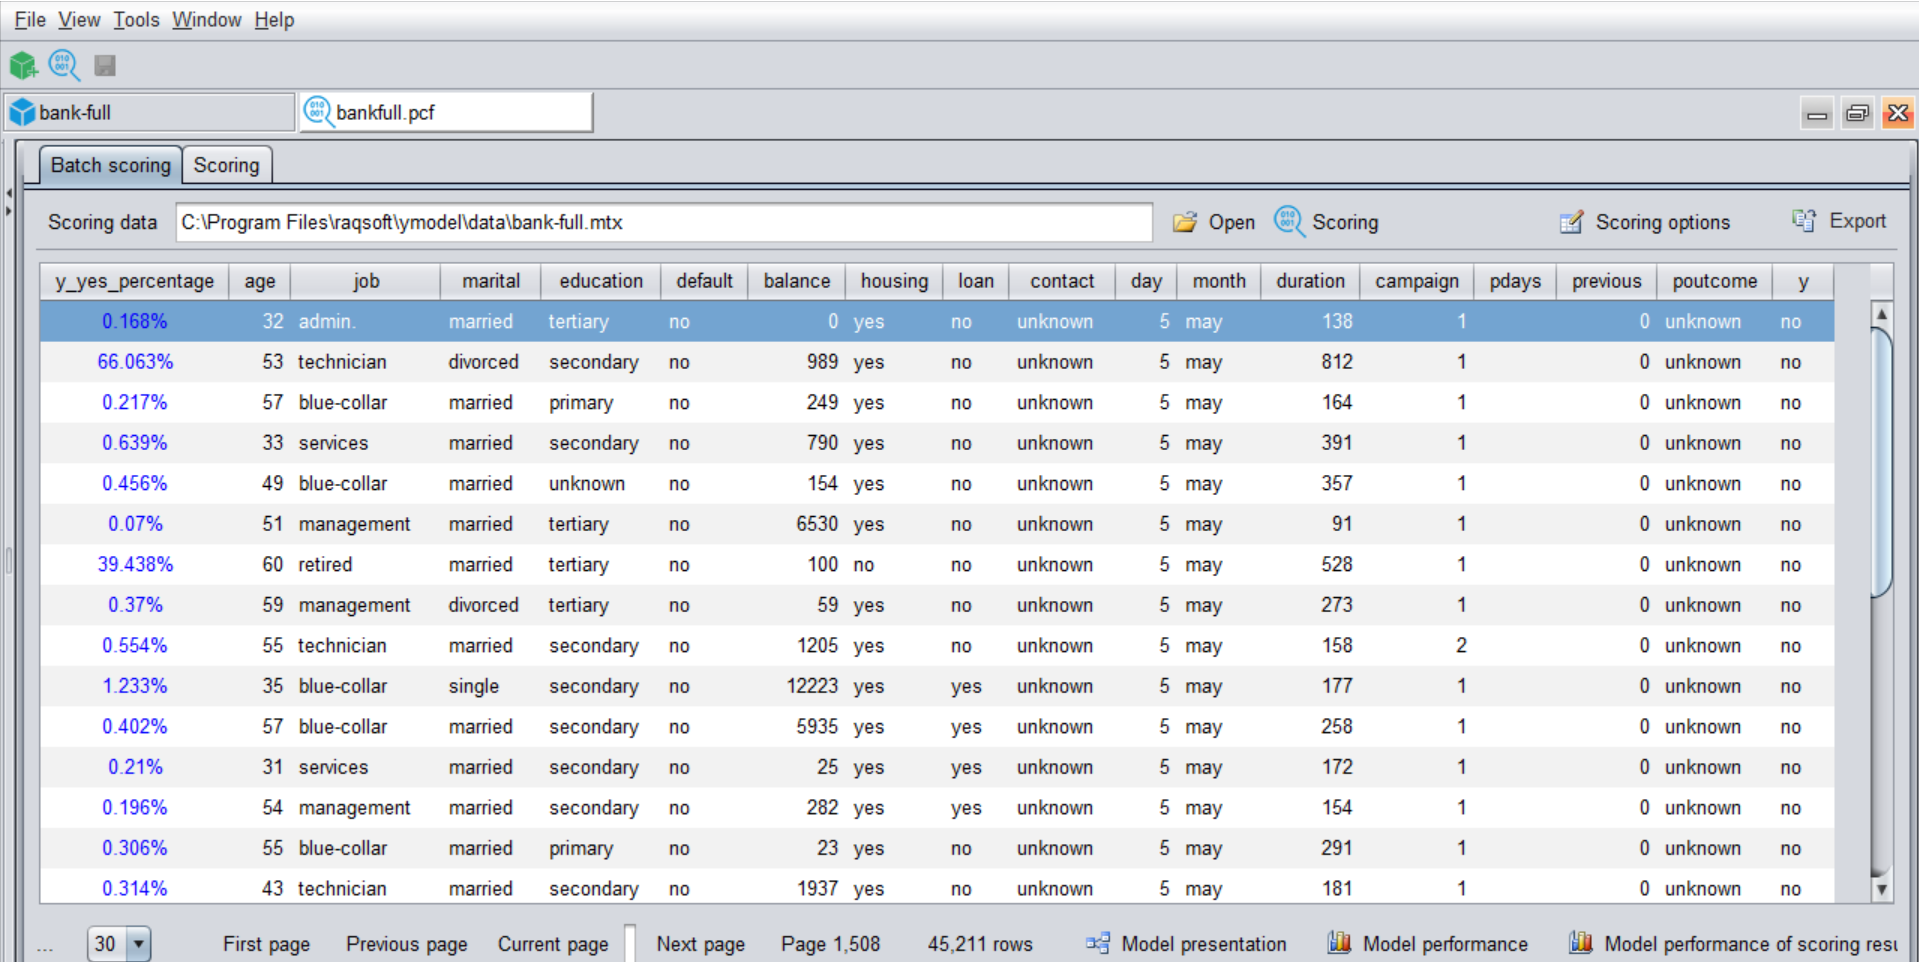
This result can also be exported into csv, xls and other format result files.
At this point, our prediction is complete, and the whole process can be said to be very simple.
4. Model performance
As mentioned earlier, the prediction cannot be 100% accurate, but there must be an accuracy. How do we know?
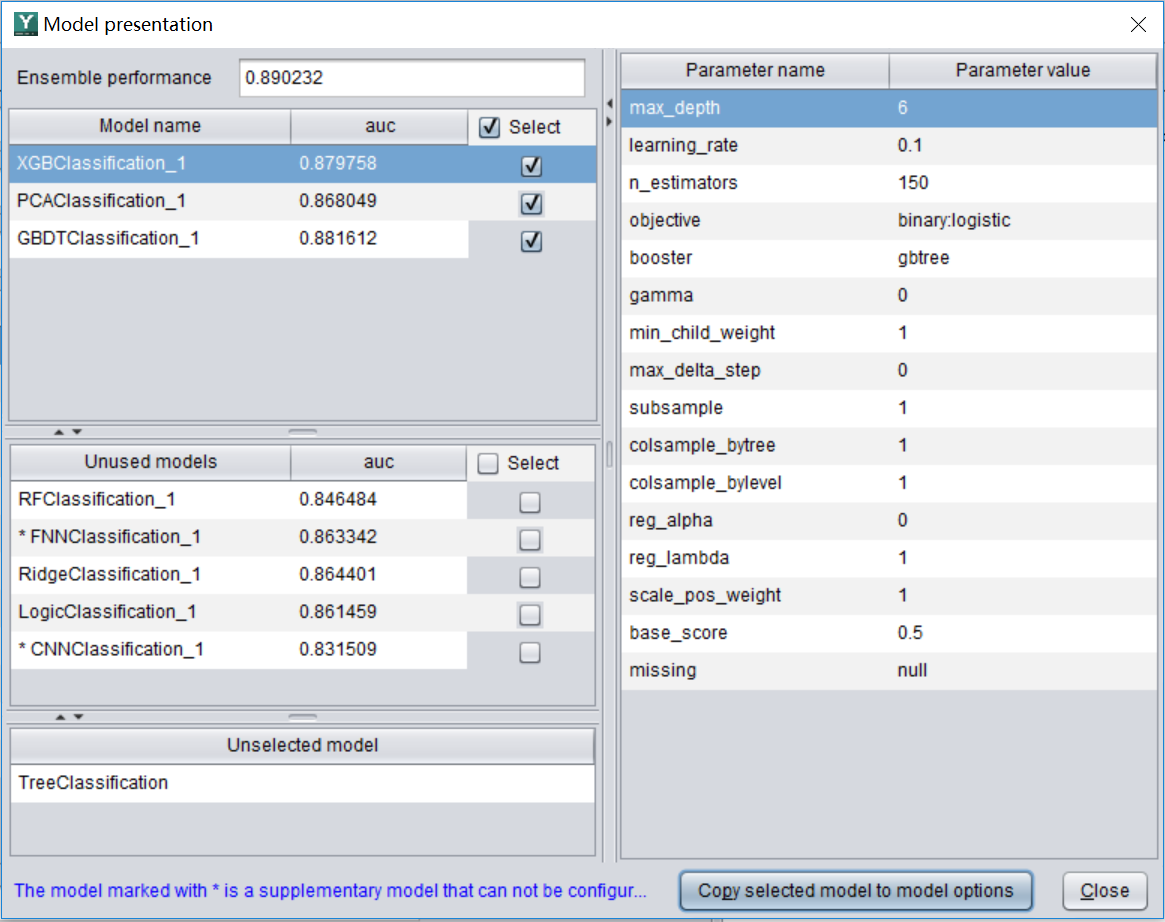
After the model is built in step 2, click the "Model Performance" button  , you can see some information about the model, called model performance, as shown in the figure below.
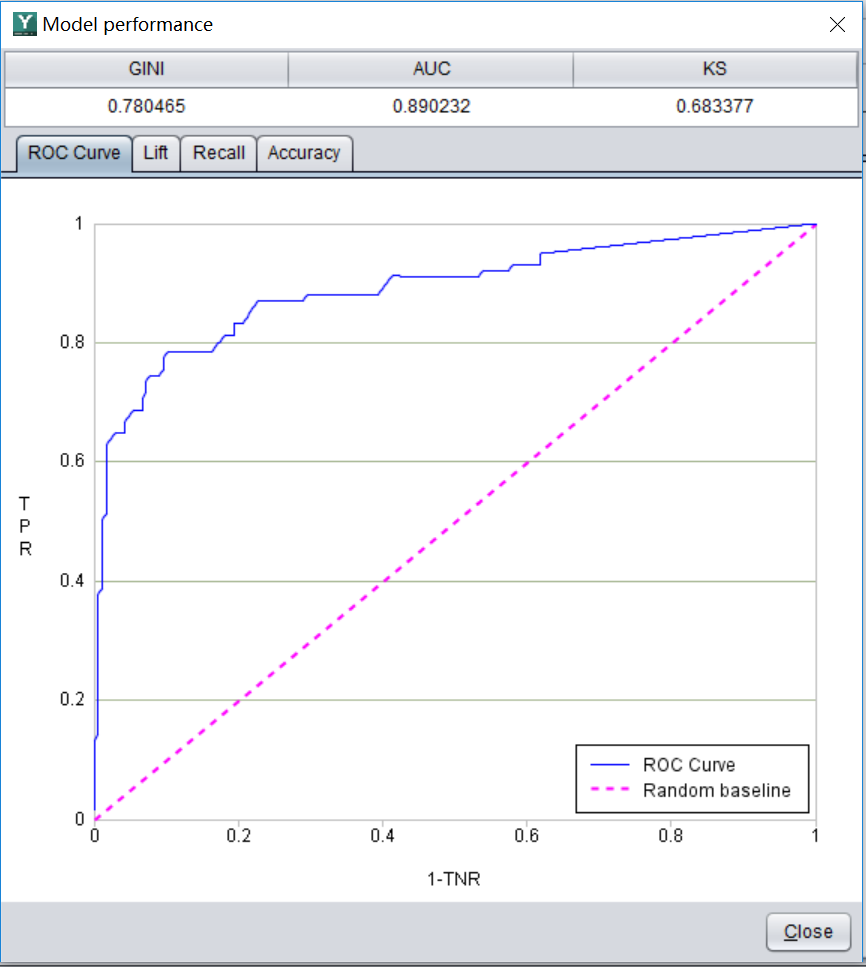
We usually look at this indicator called AUC. The value range is (0.5-1). In principle, the larger the better, the more accurate the model is. For example, the AUC of this model is 0.89, which is considered to be a good model. The reliability of using this model to make predictions is very good. However, this 0.89 does not mean that the accuracy is 89% (the specific prediction accuracy is related to the threshold mentioned earlier, and it cannot be calculated before the threshold is determined). The specific meaning of AUC is more complicated, and interested students can Go to the book on data mining (there is a free e-book http://www.raqsoft.com/html/course-data-mining.html which is easy to understand ).
If AUC is very high, close to 1, does it mean that this model is particularly good? Not necessarily, this may cause the so-called "overfitting" phenomenon. At this time, although the AUC indicator is very good, the accuracy may be very poor when it is actually used for prediction. As for why filtering occurs and how to recognize and avoid it, you can also refer to the above-mentioned books.
to sum up:
Finally, let's summarize the process of using historical data to make business predictions:
The historical data and the data to be predicted are organized into a wide table. The historical data must have target variables, but the data to be predicted does not.
Import historical data into YModel, build model, and generate model file with .pcf suffix
Open the pcf model file, import the data to be predicted, complete the prediction, and generate the result, and then you can decide the business action based on the predicted result (such as the probability of default).