
The title of this article is weird, let me explain.
This is my own experience, that is, when I understand a principle, I always want to see it.
When studying CPU principles, I want to see how the electrical signals in the CPU go when each instruction is executed.
When studying operating system principles, I want to see what changes have actually taken place in the memory layout from the start of the computer to the loading of the operating system.
When studying the principles of Java in the same way, I want to see what machine instructions each Java code is finally translated into, and I want to see what a Java object looks like in memory, etc...
In short, I just want to see!
If you always have this tangle, and do not want to just stop at the Java language level and some online blog by "about" out of principle, I will give you today to share some see Java tips, you can also let Analyze a principle from different levels.
- javap: see bytecode
- strace: see system call
- hsdis+ jitwatch: see the machine code
- openJDK: see native method
- JOL: Seeing the object
- fastthread: see thread
- JProfile: See various states at runtime
javap: see bytecode
This command should be familiar to everyone. After contacting Java for a period of time, you will always be dissatisfied with understanding the principles of the language level. At this time, you need to grasp some of the underlying principles more deeply through bytecode .
At this time javapthe command is very critical, it is actually parse the entire .class file, but we usually use it to analyze the inside of the bytecode instructions .
How to use the command? Please search it online. Here is the most friendly way to study bytecode, which is to use IDEA's plug-in. You can call him the bytecode learning artifact jclasslib .
After downloading the plug-in, there will be one more item in your view menu
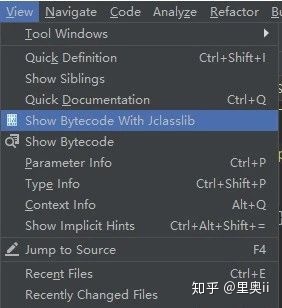
Click it to analyze the bytecode of the current class
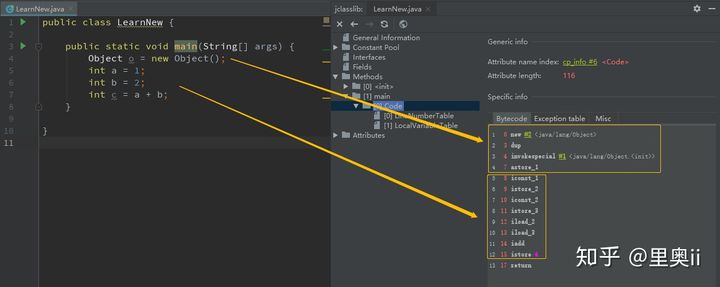
This step crosses the first layer of understanding the underlying principles of Java, and then goes to the bottom~
strace: see system call
When I understand the principle from the JVM level, I may feel that it is not tasteful enough. I want to see how the bottom layer of the JVM is implemented. But you don't want to go directly to the final machine instructions , then there is actually a good middle layer that is the system call .
If you don’t understand system calls, you can review the operating system knowledge first.
strace Commands can view which system calls are initiated during a certain program running process, and this process is real-time.
Let's use this command to look at the traditional BIO server program in Java, which system calls will be made, and from this level to briefly analyze the principle of BIO, you will find that this perspective is a bit of a dimensionality reduction blow to the traditional perspective Up.
Look at the process of a traditional BIO
Step 1 : Write a simple socket server program, open port 8080 and listen
public static void main(String[] args) throws Exception {
    ServerSocket serverSocket = new ServerSocket(8080);
    Socket socket = serverSocket.accept();
    BufferedReader bufferedReader = new BufferedReader(new InputStreamReader(socket.getInputStream()));
    System.out.println(bufferedReader.readLine());}
Step 2 : Use the strace command to view the system calls after the program is started (here we only look at network-related system calls)
[bash ~]# strace -ff -e trace=network java SocketDemo
...[pid 28226] socket(AF_INET6, SOCK_STREAM, IPPROTO_IP) = 5...[pid 28226] bind(5, {sa_family=AF_INET6, sin6_port=htons(8080), inet_pton(AF_INET6, "::", &sin6_addr), sin6_flowinfo=htonl(0), sin6_scope_id=0}, 28) = 0[pid 28226] listen(5, 50) = 0
You can see, in fact, the socket server program, launched linux operating system to three system calls socket , , and bindthen listenAt this time, the Java process does not end, indicating that a block has occurred (specifically, the block is blocked on the accept sentence in the Java code)
Step 3 : Use the nc command to connect to port 8080
[bash ~]# nc localhost 8080
...[pid 28226] socket(AF_INET6, SOCK_STREAM, IPPROTO_IP) = 5...[pid 28226] bind(5, {sa_family=AF_INET6, sin6_port=htons(8080), inet_pton(AF_INET6, "::", &sin6_addr), sin6_flowinfo=htonl(0), sin6_scope_id=0}, 28) = 0[pid 28226] listen(5, 50) = 0[pid 28226] accept(5, {sa_family=AF_INET6, sin6_port=htons(11103), inet_pton(AF_INET6, "::1", &sin6_addr), sin6_flowinfo=htonl(0), sin6_scope_id=0}, [28]) = 6[pid 28226] recvfrom(6,
You can see that TCP connection nc command socket server, the system calls more acceptand recvfrom, they no longer go down, but this time the Java process has not ended, indicating that took place in blocking (blocking this time in the The readline of the Java code corresponds to recvfrom when the system is called)
Step 4 : Continue to pass in a string "hello" in the nc command just now, press enter to send
[bash ~]# nc localhost 8080
hello
...[pid 28226] socket(AF_INET6, SOCK_STREAM, IPPROTO_IP) = 5...[pid 28226] bind(5, {sa_family=AF_INET6, sin6_port=htons(8080), inet_pton(AF_INET6, "::", &sin6_addr), sin6_flowinfo=htonl(0), sin6_scope_id=0}, 28) = 0[pid 28226] listen(5, 50) = 0[pid 28226] accept(5, {sa_family=AF_INET6, sin6_port=htons(11103), inet_pton(AF_INET6, "::1", &sin6_addr), sin6_flowinfo=htonl(0), sin6_scope_id=0}, [28]) = 6[pid 28226] recvfrom(6, "hello\n", 8192, 0, NULL, NULL) = 6hello+++ exited with 0 +++
You can see that the recvfrom function just completed, has a return value, and the entire program is over.
By stracethis command, from the perspective of a more comprehensive understanding of the underlying Java in BIO process, if you also understand the operating system and familiar with the details of the various system calls under linux, it can be said that such a small experiment to help you almost complete Master the principle of BIO. The same is true for NIO . Isn't this a dimensionality reduction blow than simply understanding BIO NIO from the Java level?
Of course, many methods do not use system calls. If the core principle is not composed of system calls, this method is not suitable for research. Here is an ultimate method. If you can read the assembly with the naked eye , you can use the following method" In theory, you can understand all the principles.
HSDIS + JITWATCH: see machine code (assembly)
This is one of the most dimensionality reduction methods. You can directly see which machine instructions the Java code finally executes at the CPU level .
Through this article, you can build this environment well:
https://zhuanlan.zhihu.com/p/158168592?from_voters_page=true
The final effect is as follows
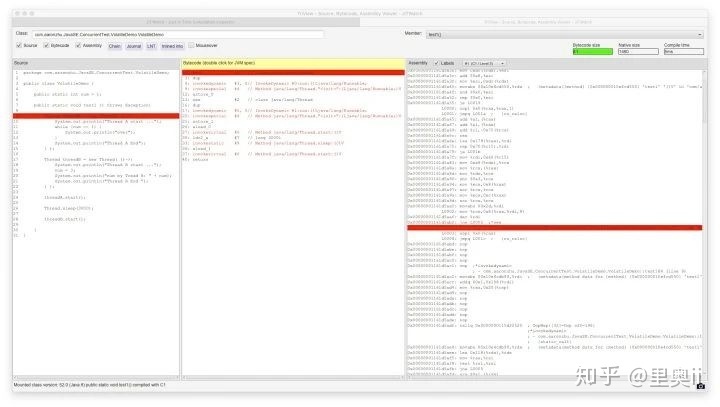
Of course, this method is a bit too in-depth . For current programs and complex JVMs, it is impossible to understand the whole picture by looking at the machine code. It can only be said that you want to deduct the most essential execution details of a certain line of code . At that time, just know that there is this way.
If you want to understand the lowest-level implementation, you don't have to observe the machine code being executed, because we have the source code. For example, the native method, or the virtual machine implementation principle of the sychronized keyword, the following method is suitable for you.
openJDK: see native method
Reading the jdk source code, sometimes when I come to the native method, I am often desperate, because it means that I have been in vain after so long.
public class Object {
    ...
    public native int hashCode();
    ...}
If you really want to understand the underlying implementation of the native method, you can actually download the source code of openJDK : https://github.com/openjdk/jdk
First enter after having the source code ./jdk/src/share/native, you can see the following directory structure
com
common
java
sun
After entering the java directory
io
lang
net
nio
security
util
Have you found that it is basically the same as the jdk directory? Then you basically know how to check it.
For example, if I want to find the hashcode method of the Object class, I can find the directory of its native method according to the directory of Object in jdk
./jdk/src/share/native/java/lang/Object.c
...#include "java_lang_Object.h"static JNINativeMethod methods[] = {
    {"hashCode",    "()I",                    (void *)&JVM_IHashCode},
    {"wait",        "(J)V",                   (void *)&JVM_MonitorWait},
    {"notify",      "()V",                    (void *)&JVM_MonitorNotify},
    {"notifyAll",   "()V",                    (void *)&JVM_MonitorNotifyAll},
    {"clone",       "()Ljava/lang/Object;",   (void *)&JVM_Clone},};...
Follow down again, after nine bends and eighteen bends, this method will be followed openjdk\hotspot\src\share\vm\runtime\synchronizer.cpp --> FastHashCode. The following code omits 100,000 lines...
intptr_t ObjectSynchronizer::FastHashCode (Thread * Self, oop obj) {
  ...
  hash = mark->hash();
  if (hash == 0) {
    hash = get_next_hash(Self, obj);
    temp = mark->copy_set_hash(hash); // merge hash code into header    ...
  }
  ...
  // We finally get the hash  return hash;
There are a lot of C++ codes in the native method, so if you really want to understand the underlying implementation of native by reading the source code yourself, you can learn the basic syntax of C++.
Of course, you can also look at some openJDK realization of the principle of virtual machines, such as look sychronizedto achieve keywords in the virtual machine level, there is not carried out.
JOL: Seeing the object
Interviews always ask about the layout of an object in memory. Is there an intuitive way to directly see the memory layout of an object? And I can continue to experiment to observe the changes in the data in the memory of an object.
Of course there is, and it is official, it is the official tool JOL provided by openJDK
It is very simple to use, just need to be introduced by maven
<dependency>
    <groupId>org.openjdk.jol</groupId>
    <artifactId>jol-core</artifactId>
    <version>put-the-version-here</version></dependency>
Then the code can be called directly ClassLayout.parseInstance(o).toPrintable(), as follows
public static void main(String[] args) {
    Object o = new Object();
    System.out.println(ClassLayout.parseInstance(o).toPrintable());}
Looking at the console output, you can directly see the binary representation of the object header . Since Object has no member variables, member variables are not reflected.
java.lang.Object object internals:
 OFFSET  SIZE   TYPE DESCRIPTION                               VALUE
      0     4        (object header)                           01 00 00 00 (00000001 00000000 00000000 00000000) (1)
      4     4        (object header)                           00 00 00 00 (00000000 00000000 00000000 00000000) (0)
      8     4        (object header)                           e5 01 00 f8 (11100101 00000001 00000000 11111000) (-134217243)
     12     4        (loss due to the next object alignment)Instance size: 16 bytesSpace losses: 0 bytes internal + 4 bytes external = 4 bytes total
Is it very intuitive? Since the lock information is stored in the object header, we can use this tool to see the process of lock upgrade . After doing it yourself, the lock upgrade becomes intuitive.
Look at the process of lock upgrade
Because the information is recorded in the lock of the object head of Mark Word, the so by their own experiments, prints out the information at different stages, you can see the process of lock escalation.
Here I wrote a piece of code. It’s a bit long and won’t be pasted. If it’s stuck, you won’t even click to open it.
I only typed the output result, there was too much information, only the information indicating the lock type was taken
- Just started new:
001(no lock) - Wait five seconds for new:
101(anonymous bias lock) - The main thread adds a lock (:
101bias lock) - The main thread releases the lock:
101bias lock) - A new thread locks:
00(lightweight lock) - The new thread releases the lock and ends:
001(no lock) - Two threads grab the lock:
10(heavyweight lock) - Both threads end:
10(heavyweight lock) - Wait a second:
001(no lock)
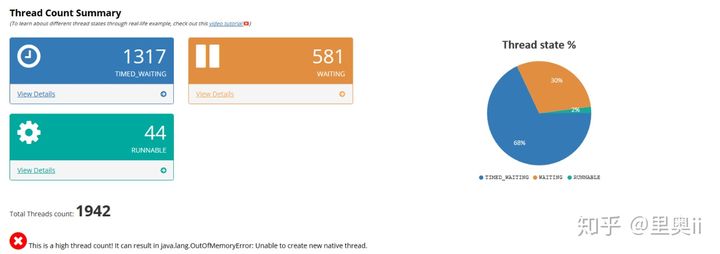
fastthread: see thread
We know that with the jstackcommand snapshot of the current thread the JVM can dump into one file.
But this file is not intuitive enough, a bunch of text, there are many tools to visualize it, but the most handy and beautiful visualization tool I use is fastthread , and more convenient is that it is a web page .

Anyway, when I first visited this website, it was so beautiful. From the official website, it is very technological and very interesting, making people want to upload a dump file for analysis and analysis.
I uploaded a dump file generated by jstack, after a period of analysis, I can see a very beautiful page
View the overall situation of the thread
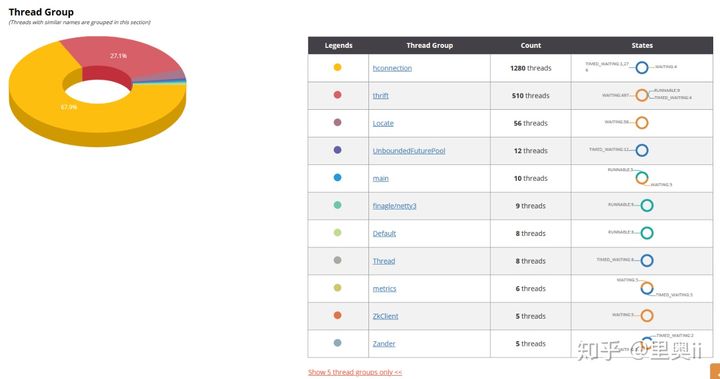
View thread grouping
View thread details
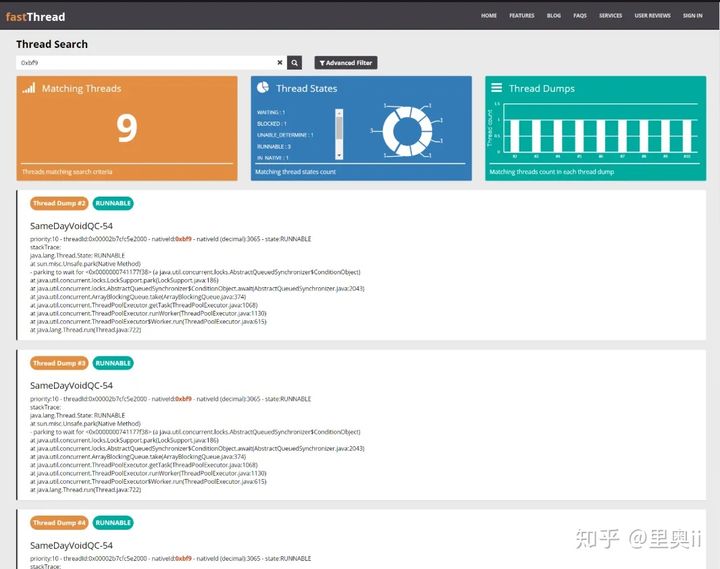
There are many more, so I won’t demonstrate them one by one. The official website is very friendly, so you can go shopping~
JProfile: See various states at runtime
Seeing the real-time status of the JVM is very helpful for us to understand the running process of the program from the system level. I wonder if you have used the visualization tool JConsole that comes with jdk.
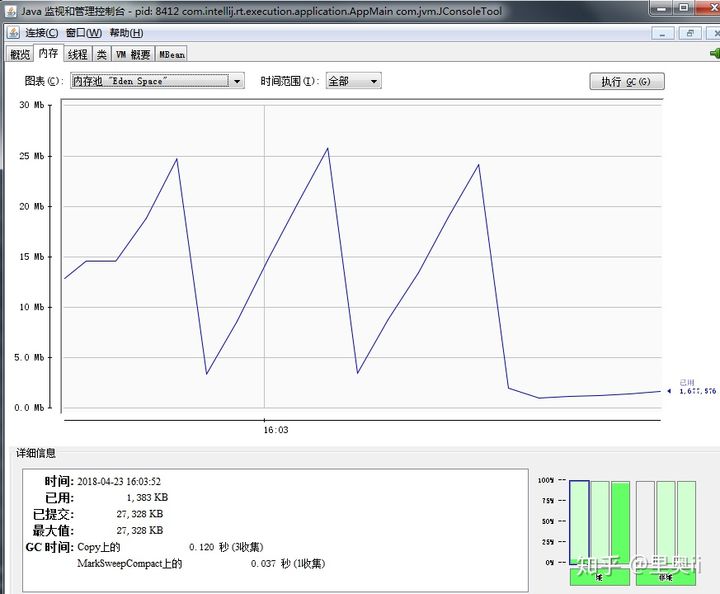
It's a bit ugly, and the function is not very powerful, so there is JProfile
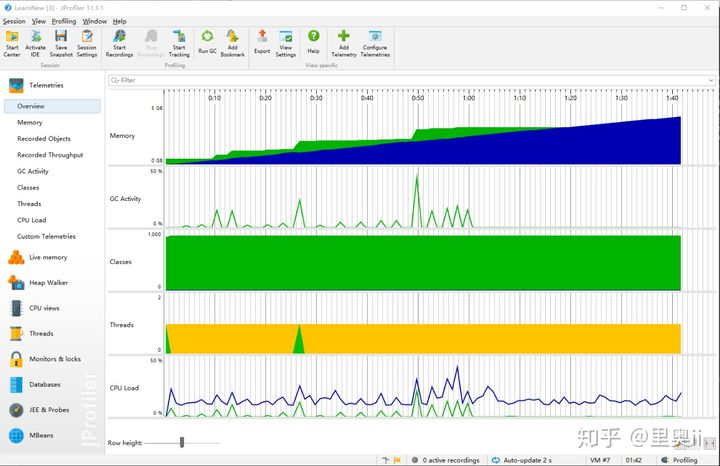
JProfiler is a performance bottleneck analysis tool developed by ej-technologies GmbH. To put it bluntly, it is an advanced beautification version of JConsole. We can appreciate its appearance first.
Here we use such a program to run, it can be expected that this program will continue to occupy the heap memory and cannot be gc, and finally OOM
public static void main(String[] args) throws Exception {
    List<Byte[]> list = new ArrayList<>();
    while (true) {
        list.add(new Byte[1024*1024]);
        Thread.sleep(100);
    }}
Open JProfile comprehensive page, follow up some performance information in real time
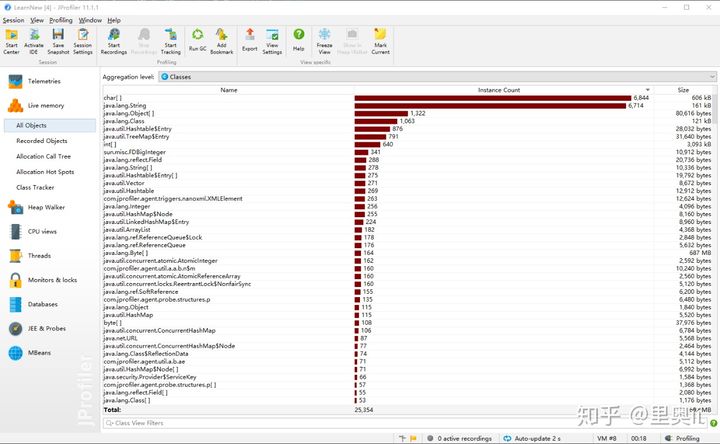
Finally, the Java program also reported OOM
Exception in thread "main" java.lang.OutOfMemoryError: Java heap space
We can view all the object information in the object monitoring panel and sort it according to the specified rules
Of course, for this example, we can directly use the big object analysis view inside (Biggest Object)
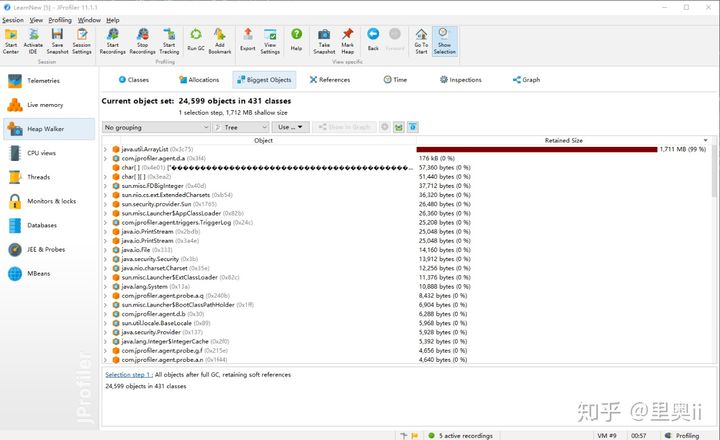
In this way, we find that the largest memory space is our growing ArrayList object.
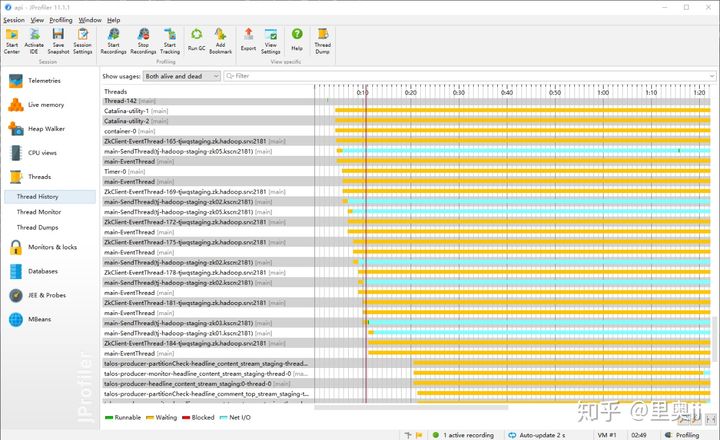
Of course, we can also use it to analyze threads, but it is more intuitive and more powerful to analyze a snapshot of a certain moment on the fastthread website.
JProfile can also be directly connected to IDEA through a plug-in. The final effect is to click and use JProfile to run in IDEA, and it will automatically jump to the JProfile monitoring program.

One more minute
By javapviewing bytecode, by straceand HSDISsee the lower-level interaction with the computer, and then by reading openJDKto understand native and JVM implementation methods, and then holding a source Java 语言规范and 虚拟机规范official documents, in theory, you could say it worked out Java language own The whole principle of it. Therefore, it is very helpful to do more experiments on your own through these gadgets. You will get some deeper understanding than reading blog posts or even reading books.
Author: flashers sun
original link: see Java
original source: low concurrent programming
invasion deleted