premise
- Docker
Preface
Now Docker Swarm has completely lost to K8S, but now K8S is still very complicated, and it is more difficult to get started than Docker Swarm. If you are a small-scale team and need container orchestration, Docker Swarm is still suitable.
At present, Docker Swarm has a problem that has not been resolved. If the business needs to know the user's request IP, Docker Swarm cannot meet the requirements. The services currently deployed in Docker Swarm cannot obtain the user's requested IP.
Specifically, you can take a look at this ISSUE-> Unable to retrieve user's IP address in docker swarm mode
the whole idea
The idea as a whole is to use Influxdb Grafana cadvisor, where cadvisor is responsible for data collection, each node deploys a cadvisor service, Influxdb is responsible for data storage, and Grafana is responsible for data visualization.
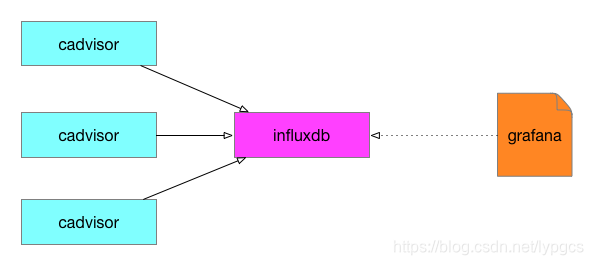
Demo environment
| Host | IP |
|---|---|
| master(manager) | 192.168.1.60 |
| node1(worker) | 192.168.1.61 |
| node2(worker) | 192.168.1.62 |

Here I use the master node as a node for monitoring data storage and visualization services as a demonstration. Generally, a worker node is used to do such work.
Initialize Docker Swarm
Initialize the cluster on the master machine, run
docker swarm init --advertise-addr {MASTER-IP}
[root@master ~]# docker swarm init --advertise-addr 192.168.1.60

Swarm initialized: current node (138n5rwjz83y8goyzepp1cdo7) is now a manager.

To add a worker to this swarm, run the following command:

    docker swarm join --token SWMTKN-1-67je7chylnpyt0s4k1ee63rhxgh0qijiah9gadvcr7i6uab909-535nf6qu6v7b8dscc0plghr9j 192.168.1.60:2377

To add a manager to this swarm, run 'docker swarm join-token manager' and follow the instructions
Run the prompt command on the node node to join the cluster
docker swarm join --token SWMTKN-1-67je7chylnpyt0s4k1ee63rhxgh0qijiah9gadvcr7i6uab909-535nf6qu6v7b8dscc0plghr9j 192.168.1.60:2377
manager node is just an example after initializing the cluster. The command needs to be run according to the actual situation after initializing the cluster.
[root@node1 ~]#  docker swarm join --token SWMTKN-1-67je7chylnpyt0s4k1ee63rhxgh0qijiah9gadvcr7i6uab909-535nf6qu6v7b8dscc0plghr9j 192.168.1.60:2377
This node joined a swarm as a worker.
[root@node2 ~]# docker swarm join --token SWMTKN-1-67je7chylnpyt0s4k1ee63rhxgh0qijiah9gadvcr7i6uab909-535nf6qu6v7b8dscc0plghr9j 192.168.1.60:2377
This node joined a swarm as a worker.View the current node node on the master machine
docker node ls
[root@master ~]# docker node ls
ID                            HOSTNAME            STATUS              AVAILABILITY        MANAGER STATUS      ENGINE VERSION
138n5rwjz83y8goyzepp1cdo7 *   master              Ready               Active              Leader              18.09.8
q03by75rqur63lx36cmordf11     node1               Ready               Active                                  18.09.8
6shdf5ej4b5u7x877bg9nyjk3     node2               Ready               Active
The cluster has been set up so far, and then start to deploy services
Deploy monitoring service in Docker Swarm
docker stack deploy -c docker-compose-monitor.yml monitor
[root@master ~]# docker stack deploy -c docker-compose-monitor.yml monitor
Creating network monitor_default
Creating service monitor_influx
Creating service monitor_grafana
Creating service monitor_cadvisor
docker-compose-monitor.yml file content
 version: '3'

services:
  influx:
    image: influxdb
    volumes:
      - influx:/var/lib/influxdb
    deploy:
      replicas: 1
      placement:
        constraints:
          - node.role == manager

  grafana:
    image: grafana/grafana
    ports:
      - 0.0.0.0:80:3000
    volumes:
      - grafana:/var/lib/grafana
    depends_on:
      - influx
    deploy:
      replicas: 1
      placement:
        constraints:
          - node.role == manager

  cadvisor:
    image: google/cadvisor
    hostname: '{

   {.Node.Hostname}}'
    command: -logtostderr -docker_only -storage_driver=influxdb -storage_driver_db=cadvisor -storage_driver_host=influx:8086
    volumes:
      - /:/rootfs:ro
      - /var/run:/var/run:rw
      - /sys:/sys:ro
      - /var/lib/docker/:/var/lib/docker:ro
    depends_on:
      - influx
    deploy:
      mode: global

volumes:
  influx:
    driver: local
  grafana:
driver: localView service deployment
docker service ls
[root@master ~]# docker service ls
ID                  NAME                MODE                REPLICAS            IMAGE                    PORTS
qth4tssf2sm1        monitor_cadvisor    global              3/3                 google/cadvisor:latest
p2vbxe7ic175        monitor_grafana     replicated          1/1                 grafana/grafana:latest   *:80->3000/tcp
von1rpeqq7vj        monitor_influx      replicated          1/1                 influxdb:latest
So far, the service has been deployed. The three machines each deploy a cadvisor, and deploy grafana and influxdb on the master node.
Configure influxdb database for cadvisor
Check out the service
docker ps on the master machine
[root@master ~]# docker ps
CONTAINER ID        IMAGE                    COMMAND                  CREATED             STATUS              PORTS               NAMES
55965fdf13a3        grafana/grafana:latest   "/run.sh"                3 hours ago         Up 3 hours          3000/tcp            monitor_grafana.1.l9uh0ov7ltk7q2yollmk4x1v9
0bf544c7d81c        google/cadvisor:latest   "/usr/bin/cadvisor -…"   3 hours ago         Up 3 hours          8080/tcp            monitor_cadvisor.138n5rwjz83y8goyzepp1cdo7.l53vufoivp0oe8tyy14nh0jof
3ce050f0483e        influxdb:latest          "/entrypoint.sh infl…"   3 hours ago         Up 3 hours          8086/tcp            monitor_influx.1.vraeh8ektium1j1jd27qvq1au
[root@master ~]#
You can see that it is in line with expectations. Next, check the log of the
cadvisor container docker logs -f 0bf544c7d81c
[root@master ~]# docker logs -f 0bf544c7d81c
W0209 09:32:15.730951       1 manager.go:349] Could not configure a source for OOM detection, disabling OOM events: open /dev/kmsg: no such file or directory
E0209 09:33:15.783705       1 memory.go:94] failed to write stats to influxDb - {"error":"database not found: \"cadvisor\""}
E0209 09:34:15.818661       1 memory.go:94] failed to write stats to influxDb - {"error":"database not found: \"cadvisor\""}
E0209 09:35:16.009312       1 memory.go:94] failed to write stats to influxDb - {"error":"database not found: \"cadvisor\""}
E0209 09:36:16.027113       1 memory.go:94] failed to write stats to influxDb - {"error":"database not found: \"cadvisor\""}
E0209 09:37:16.107051       1 memory.go:94] failed to write stats to influxDb - {"error":"database not found: \"cadvisor\""}
E0209 09:38:16.215684       1 memory.go:94] failed to write stats to influxDb - {"error":"database not found: \"cadvisor\""}
E0209 09:39:16.305772       1 memory.go:94] failed to write stats to influxDb - {"error":"database not found: \"cadvisor\""}
You can see that the error has been reported now, because there is no database such as cadvisor in the current influx container, then we enter the influx container and create the corresponding cadvisor database, and execute the following command on the master machine.
docker exec docker ps | grep -i influx | awk '{print $1}' influx -execute 'CREATE DATABASE cadvisor'
Of course, it can also be executed in steps
- Find the container of influxdb
- Enter the influxdb container and log in to influx
- Create database
It will not be demonstrated here.
Placement grafana
So far, the data has been collected and the data is stored in influxdb. Next, configure grafana to visualize the data.
Because the port configured for grafna in the docker-compose-monitor.yml file is 80, you can access grafana by directly accessing the IP of the master machine, and open 192.168.1.60 in the browser. The default account of
grafana
is admin and the
default password is admin
After logging in for the first time, you will be prompted to change the password. It does not matter if the new password continues to be set to admin.
Start to set up the data source after successful login
Configure data source
- Open the left menu bar to enter the data source configuration page
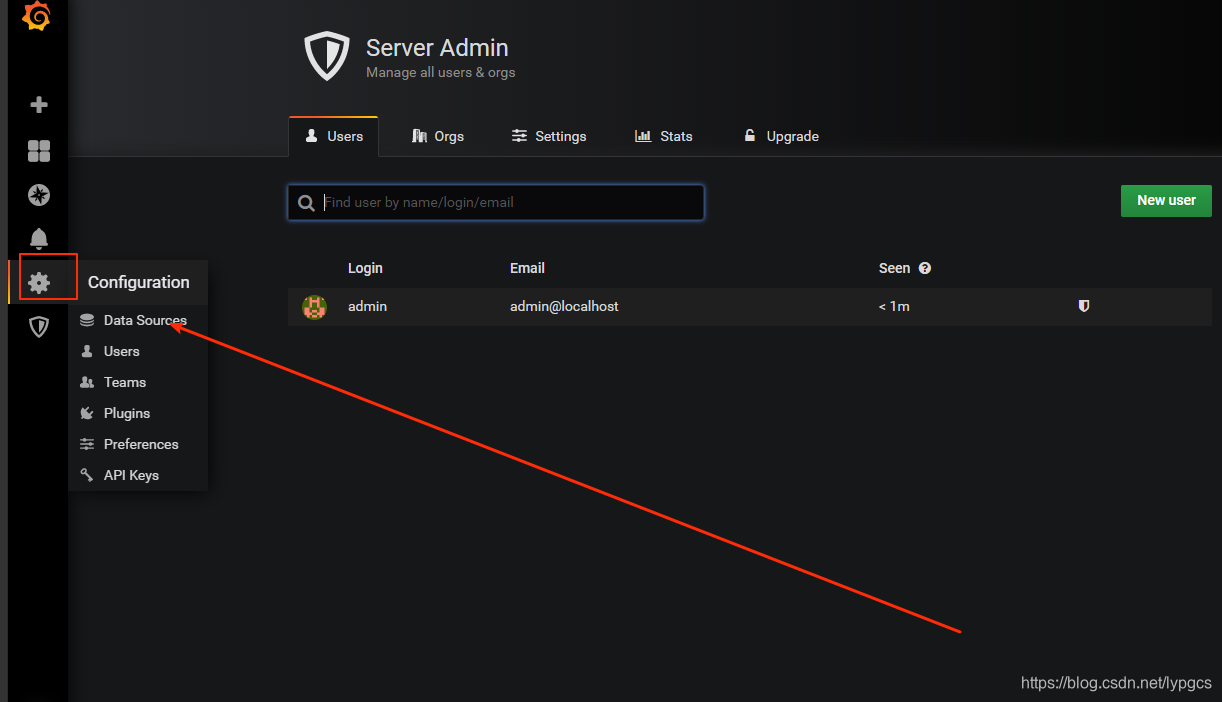
- Add a new data source, I have added it here, so there will be a data source of influxdb displayed.
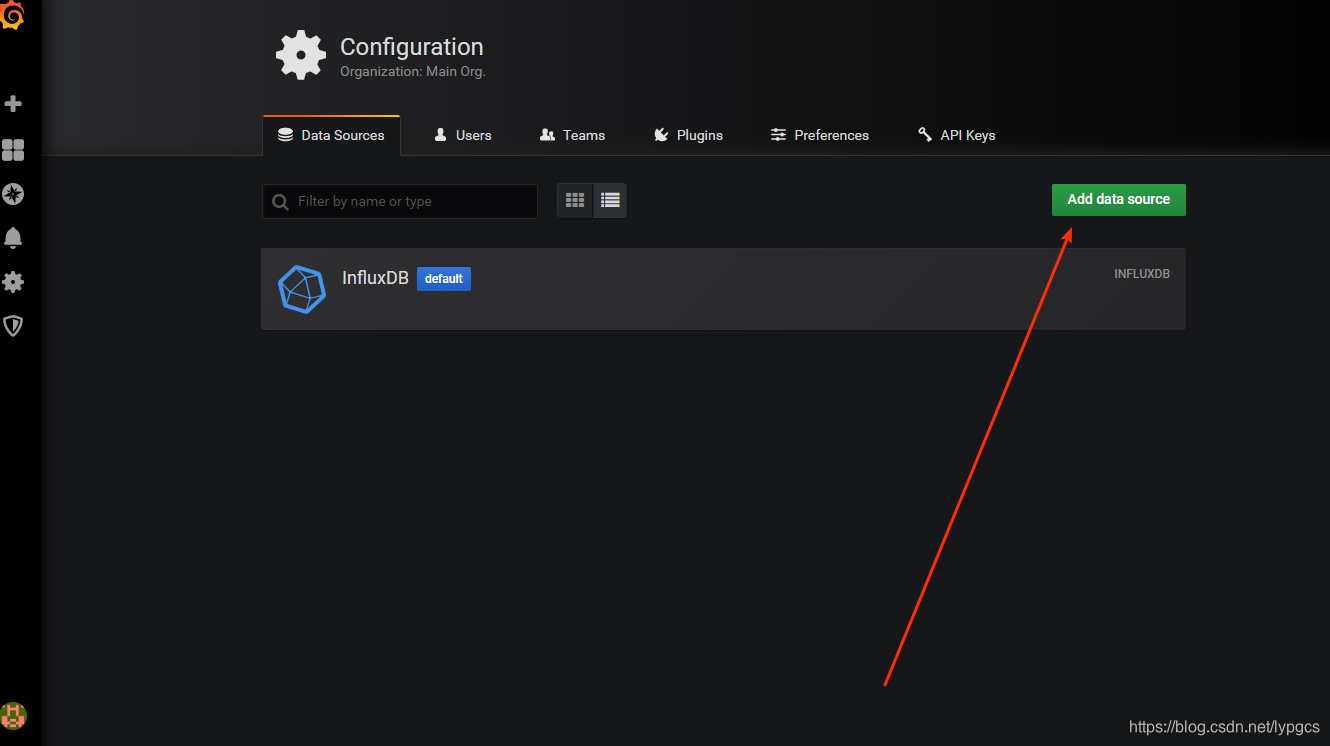
- Select the data source of influxdb type

- Fill in the information corresponding to influxdb, and fill in influx in Name. Because a grafana template will be used later, so here is the name of influx, and the URL is http://influx:8086. This is not fixed, this time docker-compose-monitor. The container name of influxdb in the yml file is influx, and the port is 8086 (default), so fill in influx: 8086 here
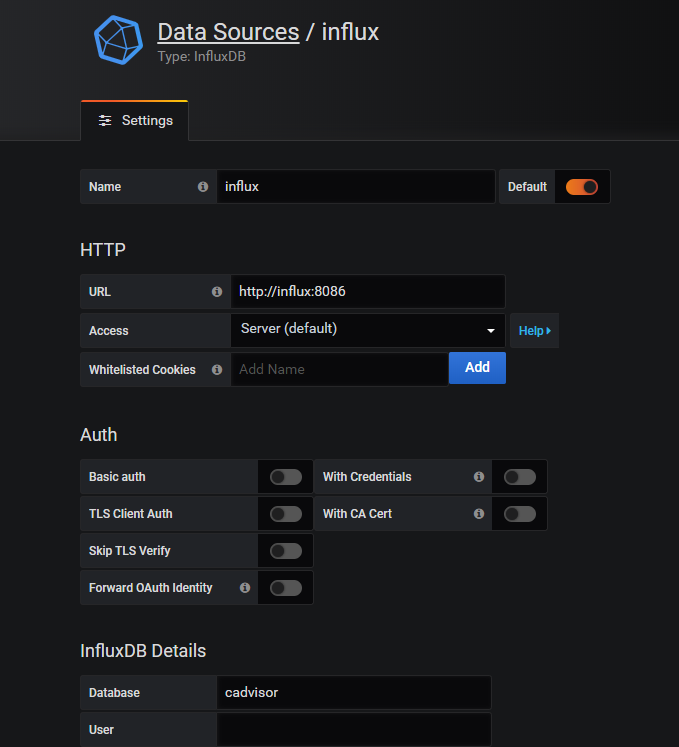
So far, the content related to the data source has been configured.
Configure the grafana view template
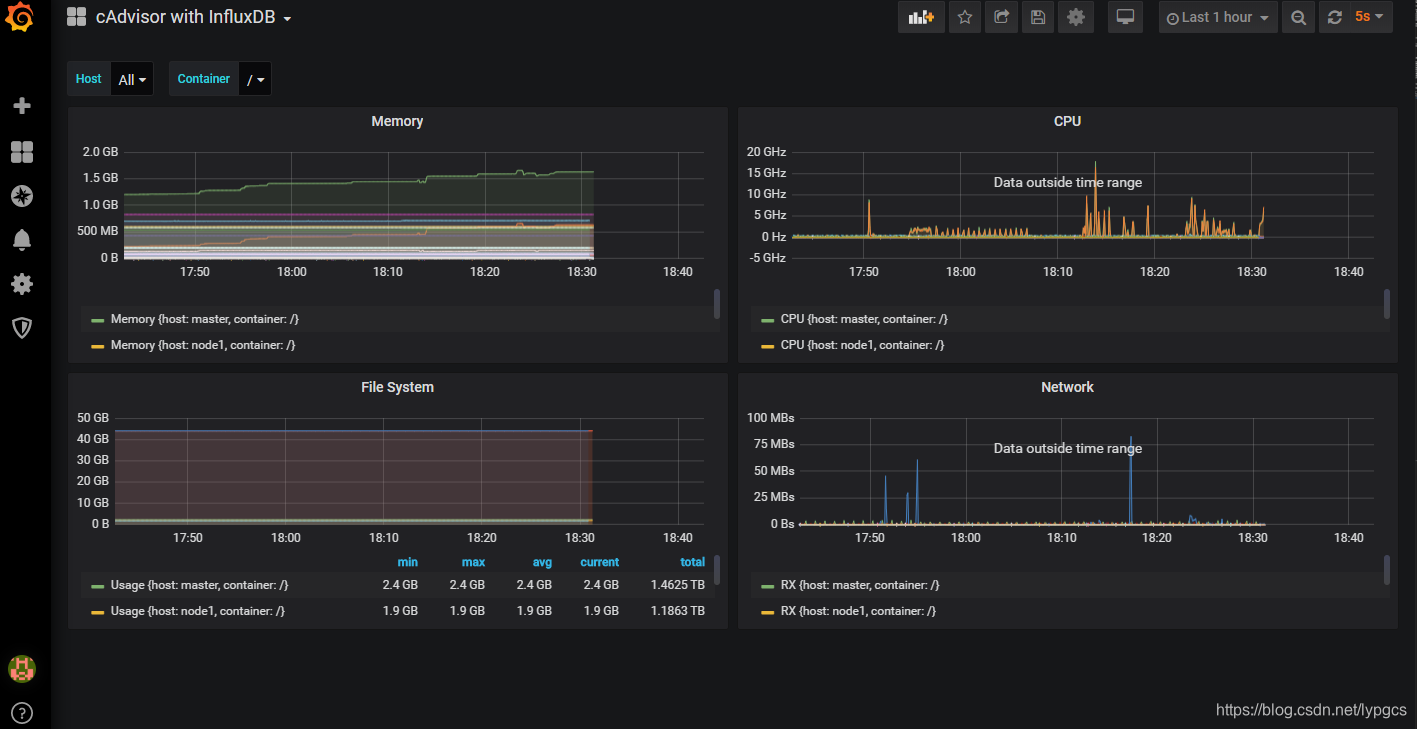
The template used here is just to demonstrate the effect. If the style of the template is not satisfactory, you can study grafana and adjust it yourself.
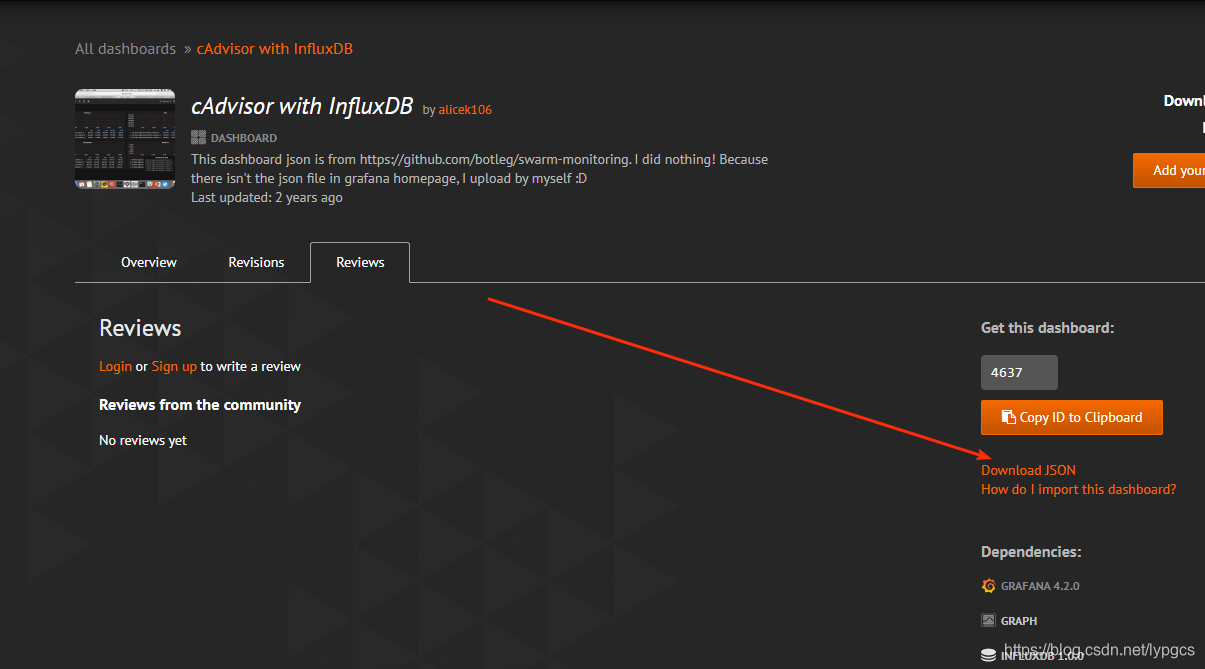
- First open the grafana dashboard market to download the template https://grafana.com/grafana/dashboards/4637/reviews
- Select the dashboard menu, select import to import

- Open the dashboard and you can already see the content of the dashboard template.
to sum up
A basic Docker Swarm cluster monitoring is completed
There are more advanced ones that may be updated in a blog later. For example, when a certain value (CPU) reaches a certain threshold, send a nail or slack message to alert
As long as you understand the idea, there is basically no problem in practice.
Originating in four coffee beans release!
Follow the public account -> [Four Coffee Beans] Get the latest content