20155311 "Network Confrontation" Malicious Code Analysis
experiment procedure
1. Scheduled task monitoring
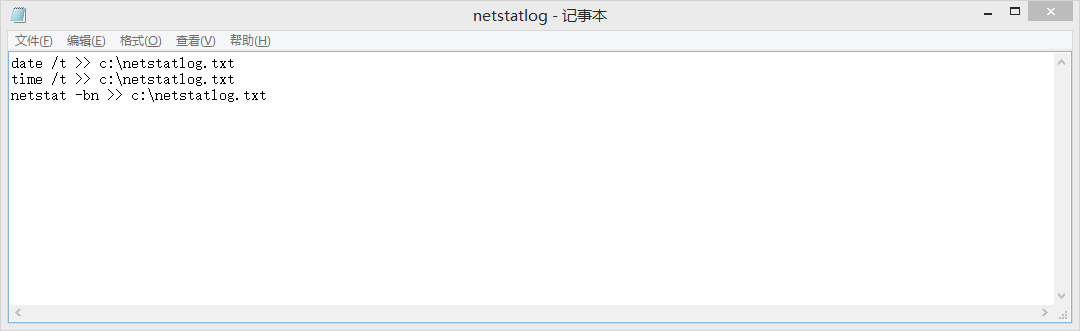
Create a netstatlog.bat file in the root directory of the C drive (first set the suffix to txt, remember to change the suffix to bat after saving the content), the content is as follows:
date /t >> c:\netstatlog.txt
time /t >> c:\netstatlog.txt
netstat -bn >> c:\netstatlog.txt
This windows batch file was created in the classroom after the teacher gave a lecture
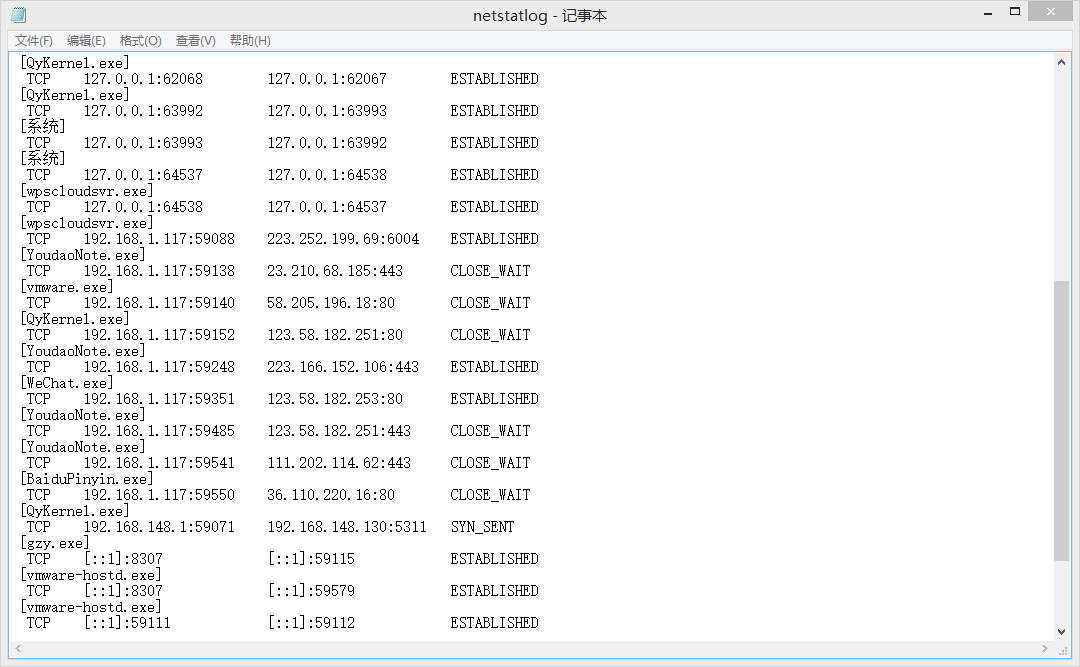
The function of the netstatlog.bat file is to output the recorded networking results to the netstatlog.txt file in the same directory in a format.
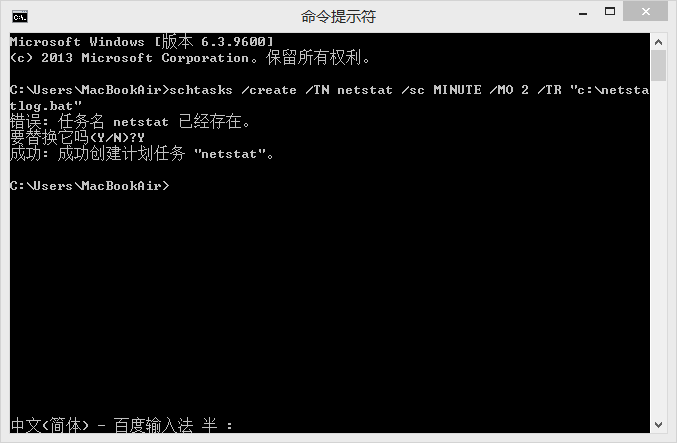
Use the schtasks /create /TN netstat /sc MINUTE /MO 2 /TR "c:\netstatlog.bat" command to create a task that records the computer's networking every two minutes.
At this time, it is very easy to appear the prompt of denying access. We can open the command prompt with administrator privileges. Baidu experience website
Now take a look at the magic two-minute check, time screenshot
2. sysmon tool monitoring
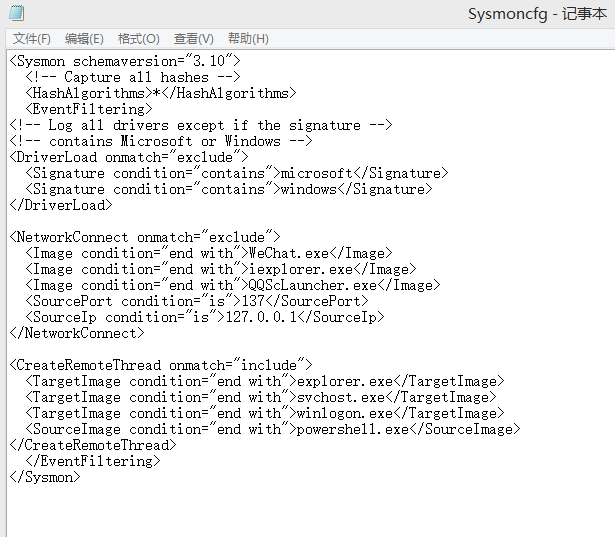
Configuration file, use the configuration file template provided by the teacher, simply modify it, put WeChat, 360 browser (I have been using this useless IE), QQ, etc. into the whitelist and save it in the C drive.
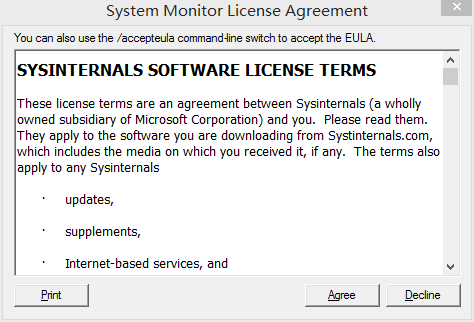
In the same first step, run the command line as an administrator, go to the directory where sysmon is located, and use the sysmon.exe -i configuration file path command to install sysmon.
• The sysmon directory address can be found after decompressing the teacher's folder. Right-click to copy the address text, and then you can easily cd into it
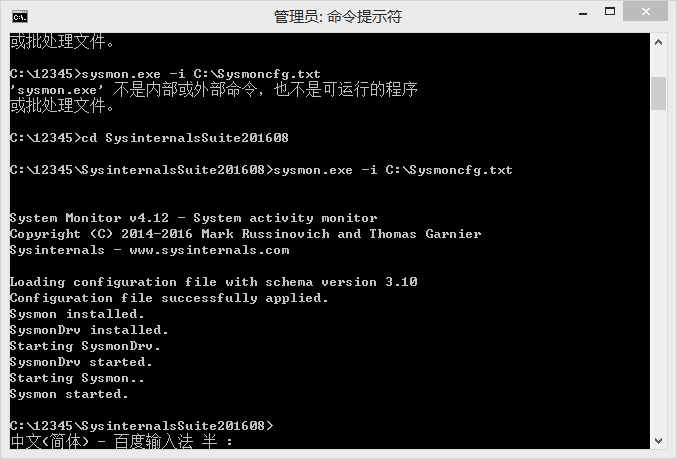
After that, be sure to remind a wave that it takes about two minutes to install sysmon on the command line. Be patient and don't rush to turn it off.
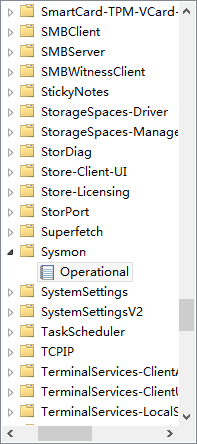
Enter the eventvwr command in the "Run" window (I typed it directly, this command can be entered in any directory), open the application and service log, and find the log file according to the Microsoft->Windows->Sysmon->Operational path.
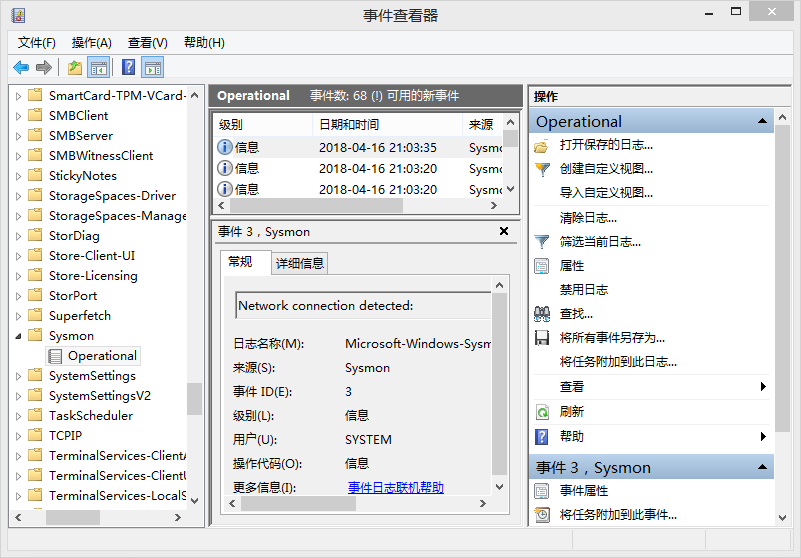
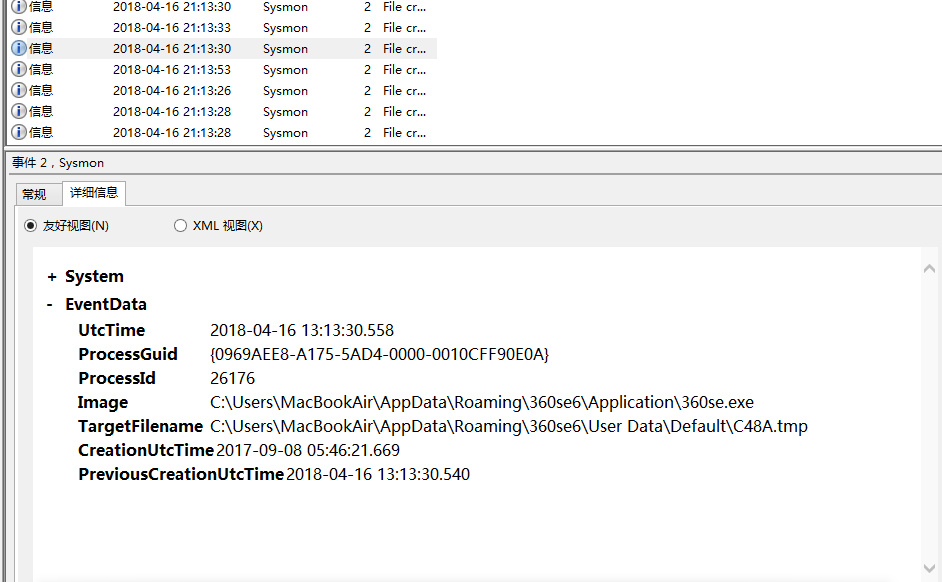
I have recorded many, many entries, select the entry I am interested in, and open a friendly view of the detailed information below, where I can view the program name, usage time, destination ip, usage port, communication protocol type, and more. All records from event 1, event 2, event 3, and event 5
- Desktop Search Engine Recording (Event 1)

360 browser open record (event 2)
QQ music listening to songs cached event (event 3)

3, virscan website analysis
- On the website that was used to kill the program last time, the behavior analysis of the seniors and sisters still could not come out after a period of time. The website kept hanging. After waiting for about a few hours, I was desperate, and this method was skipped. It is estimated that there have been some changes in the website in the past year. I can only see the analysis of the senior and senior sister. I have been addicted to my eyes
4. systracer registry analysis
First download (you can only download a wave of self-reliance) systracer download URL The
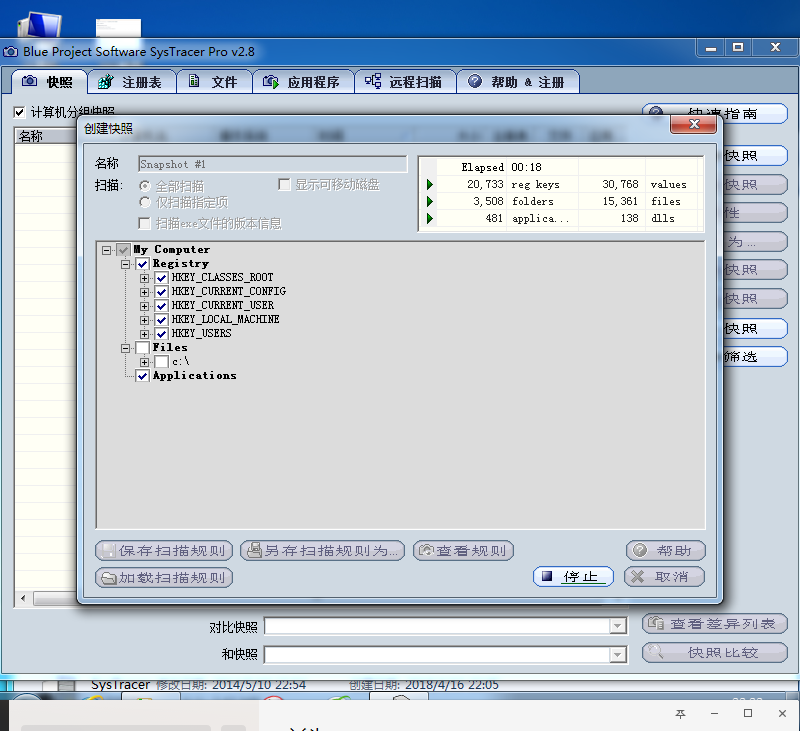
installation is very simple, although it is in English, and then capture a snapshot
Click take snapshot to take a snapshot. I took four snapshots of implanting the backdoor, running the backdoor, connecting back to the target host, and using the backdoor to control the dir and camera of the target host.
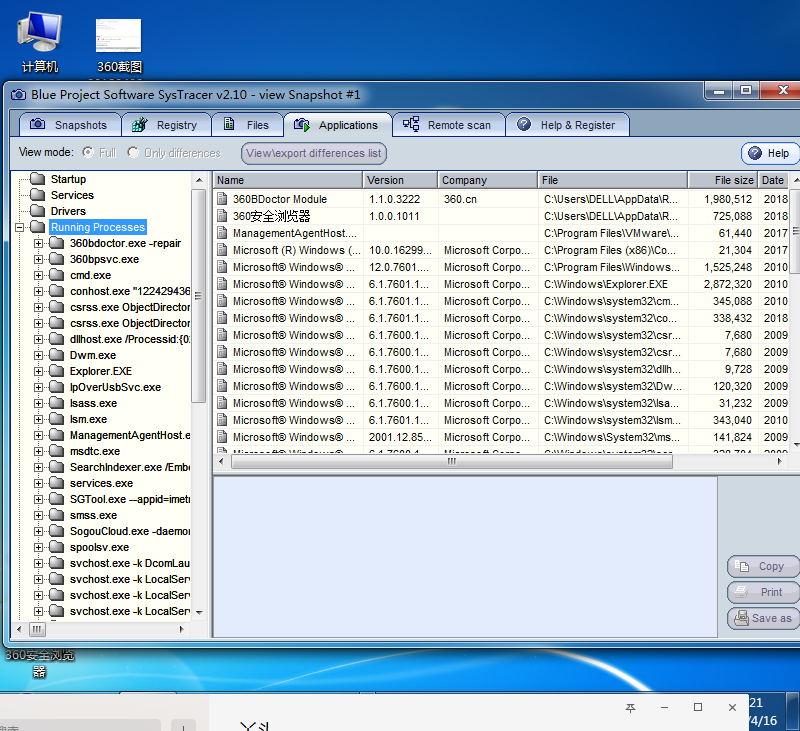
First snapshot let's take a look at my backdoor zybackdoor.exe
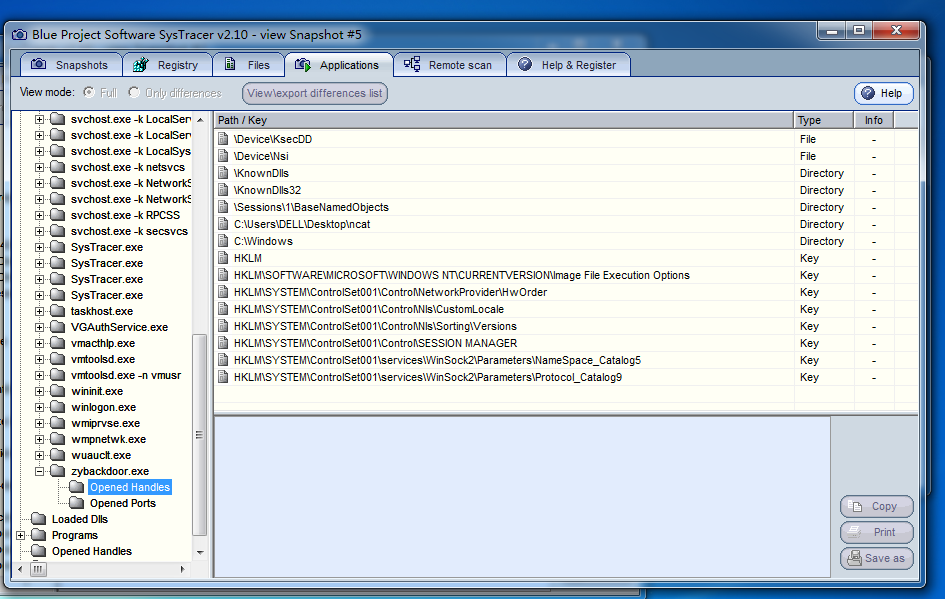
In the second snapshot we see that the running zybackdoor.exe has made a lot of changes when connecting back, adding many
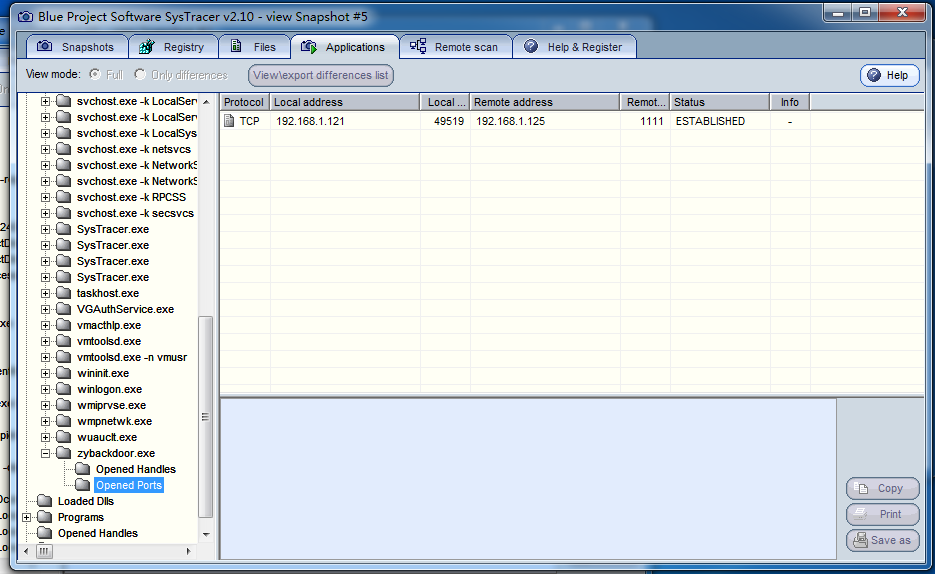
In the next snapshot, we will find an open ports, you can clearly see the IP and port
5. Network situation analysis
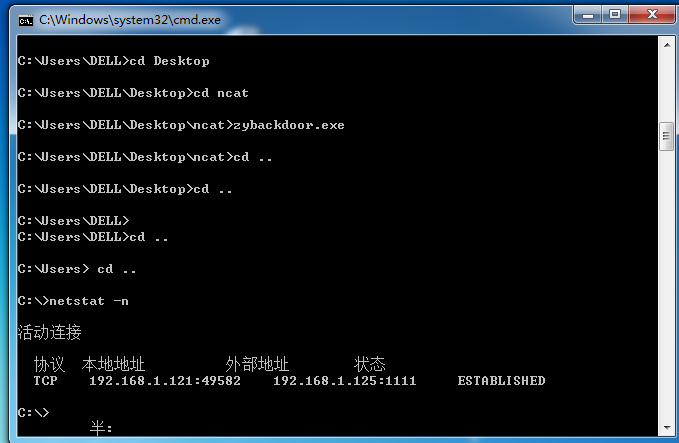
When the backdoor program is connected back, use the netstat -n command on the command line of the host to check the TCP connection status, and you can find that there is a backdoor program that performs the backdoor connection.
- Establish tcp connection when connecting back
- When the backdoor program connects back, open wireshark, perform packet capture analysis, and check the detailed protocol analysis. It is found that the backdoor program establishes a three-way handshake and connects based on IP and port when connecting back.

6. PEiD analysis
PEiD is a commonly used shell checking tool. The PEID download URL can analyze whether the backdoor program has been shelled. At this time, we remembered that there was a UPX shell (very tasteless shell) 5305-2.exe last week.
- It was seen that it was packed by UPX
7. Process Monitor analysis
Process Monitor download URL
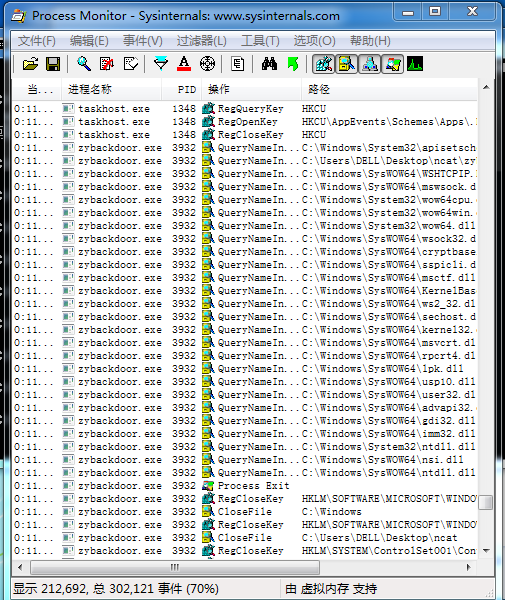
- Open Process Monitor, you can see the changes of the programs executed by winxp sorted by time, run the backdoor program zybackdoor.exe, and then refresh the interface of Process Monitor, you can specify to find zybackdoor.exe.
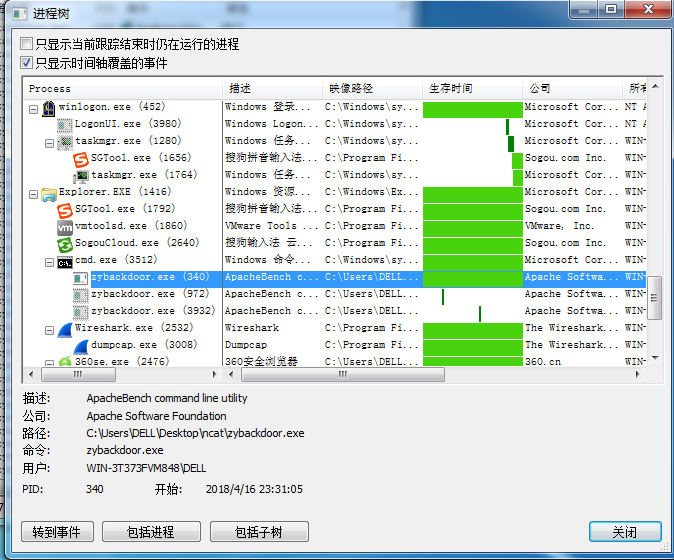
- It is also easy to find the running backdoor zybackdoor.exe with the process tree
8. Process Explorer analysis
Process Explorer download URL
- Open Process Explorer, run the backdoor program zybackdoor.exe, you can find zybackdoor.exe in the Process column

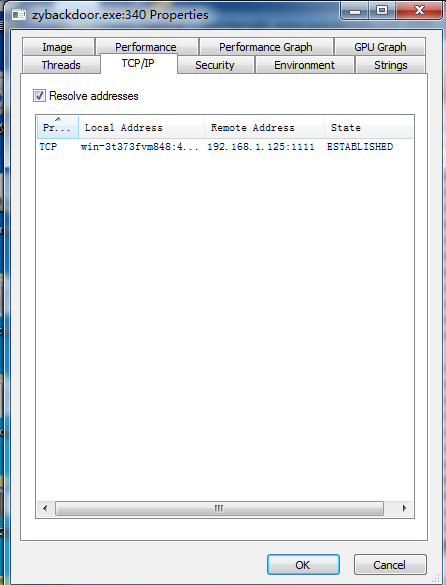
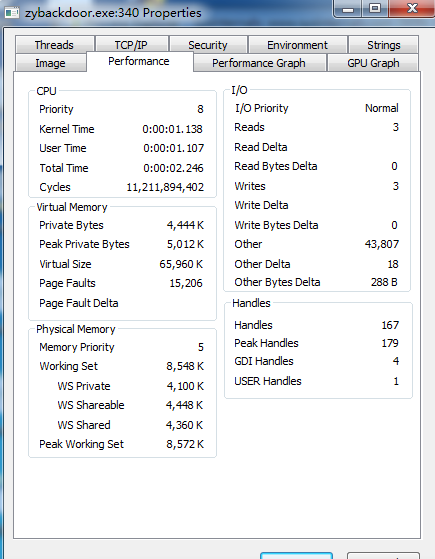
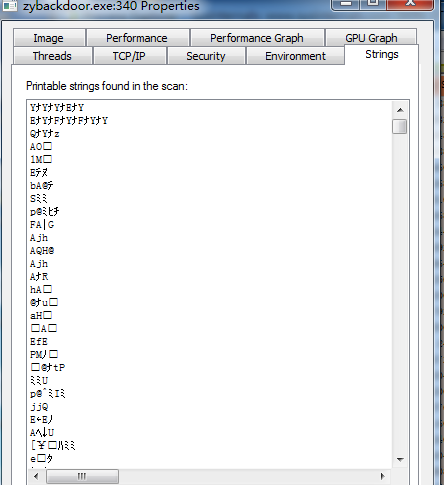
- Double-click the line of the backdoor program zybackdoor.exe, and click different tabs to view different information:
The TCP/IP tab has information such as the program's connection method, back-connection IP, and port.
The Performance tab contains information about the program's CPU, I/O, and Handles.
The Strings tab contains scanned strings, some of which are meaningful and some of which are meaningless.
- After that, I will not take screenshots one by one. This is the monitoring of the overall status.

Experiment summary and experience
The teacher gave very little reference for this experiment. Many softwares need to be downloaded by yourself. Although they are all small software, the teacher said in class that you must have an open mind in his class, so you can download them one by one and try them out. After all, I finished this experiment before I ran out of curiosity. I feel that the ability to monitor computers in the future has at least improved by a small level, and the ability to analyze malicious code can also be carried out on the premise of having tools. Analysis, looking at the source code analysis is completely unrealistic. Now I am monitoring my IP address and port when I am connecting back. The sense of achievement is full, thank you for the curiosity and the teacher for the experiment that can make everyone curious.