Author: lni github.com/lni
The consensus in the industry is that the Go language is easy to use and the average level of engineers can write good performance. And by sharing the use of related tools, it is the purpose of this article to upgrade good performance to excellent high performance.
CPU performance analysis
In earlier versions of Dragonboat , the CPU was basically wasted when the system was processing 1 million write requests per second. After the analysis, it was found that the specific causes came from different components, including their own implementation problems, pitfalls of stepping on anti-pattern, and unreasonable implementation of runtime itself. As an implementer, in the face of such a relatively new language with its own runtime, it is difficult to intuitively judge the usage of CPU resources from the code itself.
At this point, Go's built-in CPU performance analysis tool can intuitively make statistics on the CPU time consumption of each line of code. In the program, using the following runtime/pprof package method can easily control the start and stop of CPU performance analysis data capture, and the CPU performance analysis data between the start and stop intervals will be captured for subsequent analysis:
func StartCPUProfile(w io.Writer) error
func StopCPUProfile()
For example, StartCPUProfile is given an io.Writer that points to a file named cpu.pprof, then the captured data will be saved in the file cpu.pprof. Using the following command line command, you can open a saved profiling data file using Go's built-in pprof tool to browse the captured performance details:
go tool pprof cpu.pprof
Taking the getCluster() method of the earlier version of Dragonboat as an example, after opening the above data analysis file, you can use the list command to list the specific performance data of the method. From the output of this example, it can be seen that the lock operation is the performance problem, and it takes a lot of time.
(pprof) list getCluster
20ms     618:func (nh *NodeHost) getCluster(clusterID uint64) (*node, bool) {
3.85s    619:	nh.clusterMu.RLock()
640ms    620:	v, ok := nh.clusterMu.clusters[clusterID]
1.37s    621:	nh.clusterMu.RUnlock()
 10ms    622:	return v, ok
    .    623:}
In the above tools, you can list the top 20 functions and methods of program time-consuming by the following commands:
(pprof) top20 -cum
For the functions and methods mentioned in the output list, by analyzing the specific CPU time-consuming statements through the above list commands one by one, you can easily locate and find the abnormal performance part of the system.
In a slightly advanced usage, by checking the CPU usage of related functions and methods such as memory allocation, stack processing, chan read and write, etc. in the system runtime, you can further understand the usage performance of runtime, memory usage, and core built-in types. Taking the memory usage of Dragonboat when continuously processing write requests as an example, the following data is the CPU time spent in allocating an object mallocgc with a specified number of bytes, which shows that it is not a bottleneck:
cum    cum%
0.13s  1.95%  runtime.mallocgc
Using the net/http/pprof package, you can access similar performance analysis data through the web UI. This article is based on the command line mode and does not introduce the web UI method in detail. For the usage of the specific web UI mode, please refer to here .
CPU profiling should be the most direct performance analysis and optimization method. Dragonboat applies the performance analysis method introduced in this article. The in-memory state machine can achieve a write performance of more than 10 million per second on a single-plug 22-core mid-range Zhiqiang, and 500 The write latency of P999 per second is within 5ms. For specific optimization results , please click here , and you are also welcome to click star/fork support.
Heap Allocation Analysis
As with CPU performance analysis, heap performance data needs to be collected first. Before the program exits, call the WriteHeapProfile() method of the runtime/pprof package to save the heap performance data to a specified file, such as mem.pprof.
func WriteHeapProfile(w io.Writer) error
Open the performance data file using the following command line program:
go tool pprof -alloc_space mem.pprof
Then use the list command to list the memory usage of the functions and methods you want to query. The following functions are the parts of Dragonboat that have not been optimized for allocation at present:
(pprof) list saveRaftState
         0   843.29MB (flat, cum)  1.83% of Total
         .          .    104:	    }
         .          .    105:	    r.recordSnapshot(wb, ud)
         .          .    106:	    r.setMaxIndex(wb, ud, ud.Snapshot.Index, ctx)
         .          .    107:	  }
         .          .    108:	}
         .   840.79MB    109:	r.saveEntries(updates, wb, ctx)
         .          .    110:	if wb.Count() > 0 {
         .     2.50MB    111:	  return r.kvs.CommitWriteBatch(wb)
         .          .    112:	}
         .          .    113:	return nil
         .          .    114:}
The above command line command uses the --alloc_space parameter to display all allocated and released heap space data when WriteHeapProfile() is called. The supported modes are as follows:
-inuse_space      未释放空间数
-inuse_objects    未释放对象数
-alloc_space      所有分配空间数
-alloc_objects    所有分配对象数
Unreleased data indicates current heap memory usage and can be used to find objects or space that were not released as expected. All allocated space and object data are given, including unreleased and released objects or space data. The allocation and recovery of heap objects have a certain CPU cost. This data indirectly indicates the CPU performance overhead caused by heap allocation and the allocation of pressure of the device.
Since it is called a heap profile, it records and presents the allocation of the heap, which also provides a way to discover escape analysis problems. When an object subjectively thinks that it should be on the stack, but it appears in the above heap profile, it means that there must be a problem with one of the program itself, self-recognition, and Go compiler's escape analysis.
Lock conflict analysis
As we all know, frequent lock conflicts and high performance can be said to be incompatible. The good news is that Go's built-in lock conflict analysis support can easily find such lock conflicts. In the program, the sampling frequency can be set by runtime.SetMutexProfileFraction(), and the data collection of lock conflict analysis can be turned on by setting it to a value higher than 0. Before the program ends, save the data to the specified file through the WriterTo method of the runtime/pprof package:
runtime.SetMutexProfileFraction(int)
pprof.Lookup("mutex").WriteTo(io.Writer, int)
The resulting lock conflict analysis data is assumed to be stored as mutex.pprof, which can be opened on the command line with go tool pprof:
go tool pprof mutex.pprof
Also use the list command to view the lock conflicts of each function and method. The following figure is an example of improving lock conflicts by increasing the number of shards after using lock conflict analysis in Dragonboat . Before improvement:
(pprof) list nextKey
         .          .    260:func (k *keyGenerator) nextKey() uint64 {
         .          .    261:	k.randMu.Lock()
         .          .    262:	v := k.rand.Uint64()
         .     5.33ms    263:	k.randMu.Unlock()
         .          .    264:	return v
         .          .    265:}
         .          .    662:func (p *pendingProposal) nextKey(clientID uint64) uint64 {
         .     5.33ms    663:	return p.keyg[clientID%p.ps].nextKey()
         .          .    664:}
After increasing the number of shards to reduce conflicts:
(pprof) list nextKey
         .          .    260:func (k *keyGenerator) nextKey() uint64 {
         .          .    261:	k.randMu.Lock()
         .          .    262:	v := k.rand.Uint64()
         .     2.69ms    263:	k.randMu.Unlock()
         .          .    264:	return v
         .          .    265:}
         .          .    662:func (p *pendingProposal) nextKey(clientID uint64) uint64 {
         .     2.69ms    663:	return p.keyg[clientID%p.ps].nextKey()
         .          .    664:}
Flame graph analysis
Some professionals in the circle think that the Raft paper is the most important paper in the direction of distributed systems in the past ten years. Personally, I think that the performance analysis can win this honor is Brendan Gregg's flame graph with a wide variety of variants (dtrace is 14 years ago. posted). Go 1.11 has built-in support for flame graphs:
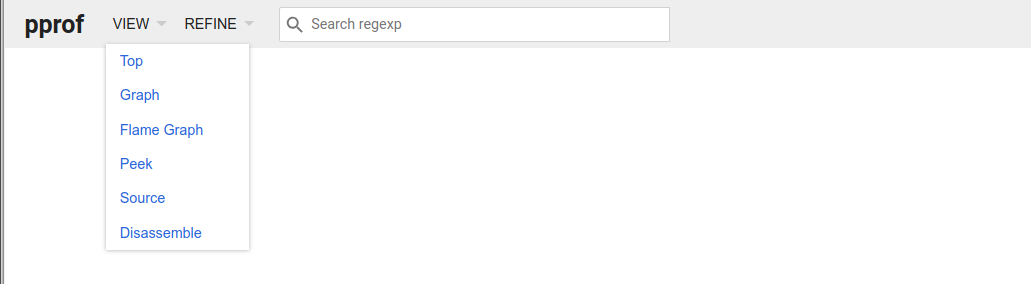
Using the web UI of the net/http/pprof package can easily view the flame graph directly
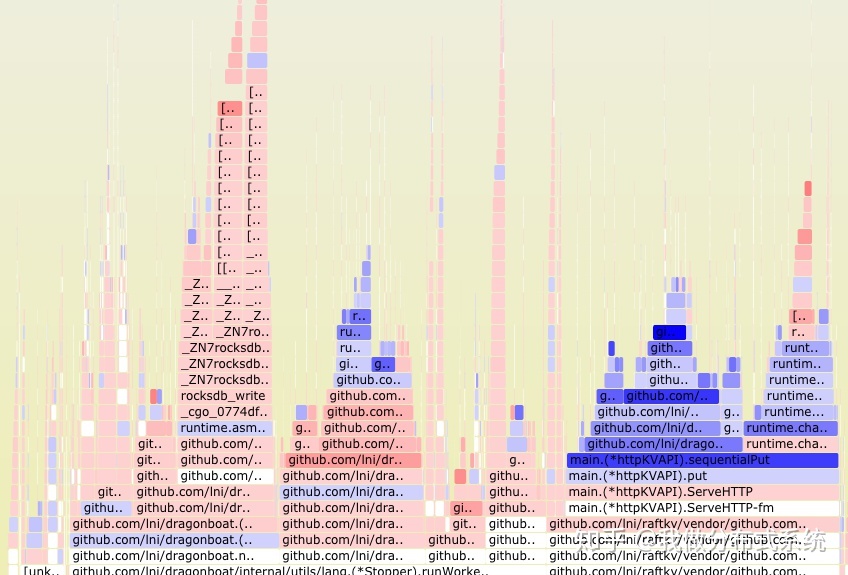
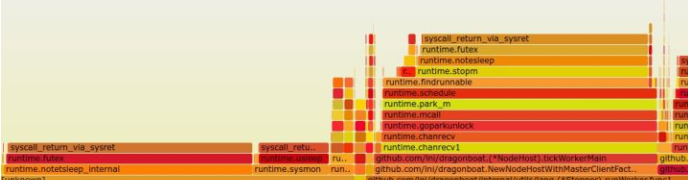
The flame graph provides one of the most intuitive presentations of CPU performance analysis data. The figure below shows the performance problems Dragonboat has encountered. The CPU usage is still high when the system is idle. According to the flame graph, significant CPU resources are wasted in repeated scheduling switching, which makes the problem quickly locate the runtime itself .
It should be pointed out that the method given on Brendan Gregg's website to grab sample data files and render a flame graph svg by itself can realize various variant flame graphs through various tricks due to its general extensibility. Therefore, it is recommended to use Brendan Gregg method given on the website. The flame graph of the title picture of this article is such an example. It is the memory access delay distribution of Dragonboat . It shows that the memory performance of the runtime part (the far right side of the picture) is not doing well. There is still a lot of room for the runtime to improve the performance of user programs and to transparently improve the performance.
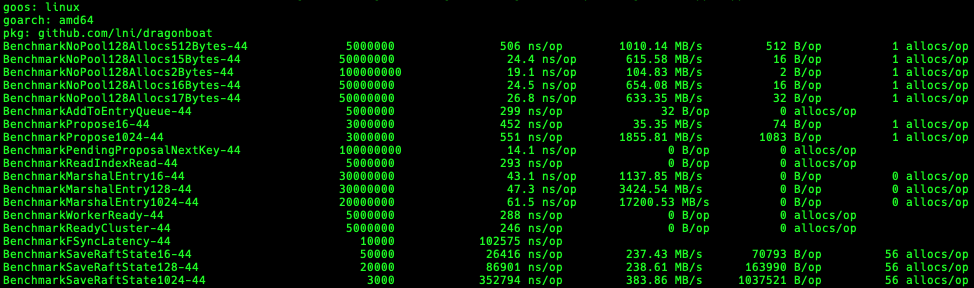
Benchmark performance analysis
Go comes with an official benchmark benchmark library, which can build benchmark tests for your own software, which is convenient for analyzing performance in different environments. In Dragonboat , from the latency and bandwidth of memory allocation, Raft's single-node concurrent read and write performance, and Raft Log's disk drop performance, etc., all have their own benchmarks. It has been found many times that the performance of Go's runtime changes has deteriorated .
Another major use of Benchmark is to easily obtain the aforementioned performance analysis data such as cpu.pprof, mem.pprof and mutex.pprof without changing any code by setting command line switches for go tool pprof tool usage.
For example, the following command will run the benchmark test item named BenchmarkOne, and save the CPU, heap allocation performance analysis data and lock conflict analysis data of its running process in cpu.pprof, mem.pprof and mutex.pprof respectively .
go test -v -run ^$ -bench=BenchmarkOne -cpuprofile cpu.pprof
go test -v -run ^$ -bench=BenchmarkOne -memprofile mem.pprof
go test -v -run ^$ -bench=BenchmarkOne -mutexprofile mutex.pprof
In a large-scale Go system, it is recommended to abstract the benchmark test cases for all performance-critical parts. First, this is what continuous integration should test and track during nightly build. At the same time, it provides various types of A non-intrusive entry to performance analysis.
GC performance analysis
In fact, Go's GC performance has been attacked for no reason until recently. One of the reasons is that many users have blind spots in quantitative analysis of GC performance. In fact, the analysis of GC performance is already very convenient.
Use the ReadMemStats() method of the runtime package to obtain system MemStats data, where the GCCPUFraction item is a value between 0 and 1.0 representing the percentage of CPU time occupied by GC outside the write barrier since the program was started. The Dragonboat item is always around 0.005 (0.5%).
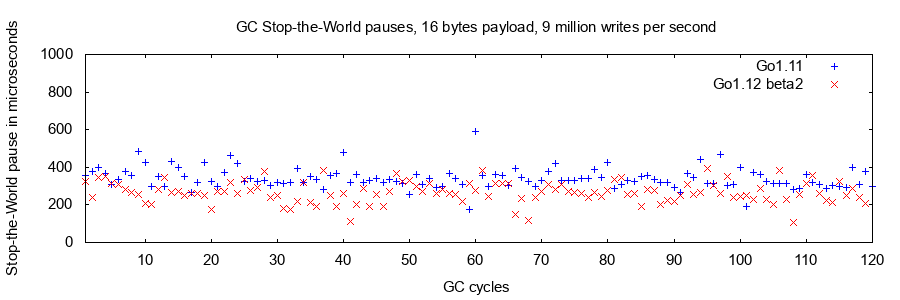
The Stop-the-World pause of GC needs to stop the running of all application goroutines, which is equivalent to temporarily stopping the entire application for the GC to complete its work. Such a pause will directly affect the dispersion of the request response delay, and has a greater impact on the 99.9% and 99.99% percentile delay performance. Through the PauseNs item of the MemStats data, the upper limit of the Stop-the-World pause per GC cycle can be obtained. The GC pauses of Dragonboat in Go 1.11 and Go1.12 are as follows. The pause limit of 250 microseconds is already very good:
Finally, the most crude but simple and effective point is that you can completely turn off the GC during the test run to compare the performance improvement. This part of the performance difference is consumed by the GC. If the performance changes little, then GC is obviously not the bottleneck of performance. In Dragonboat , it is almost impossible to observe a significant increase in throughput by turning off GC.
Summarize
Thank you for reading this soft article. If you have not tried the open source multi-group high-performance Raft library Dragonboat , you are welcome to try it and give feedback.
This article introduces the usage of various Go built-in performance analysis tools, and attempts to outline a multi-faceted performance analysis and optimization method for a larger-scale Go system. In general:
- Go provides powerful built-in performance analysis tools, which can complete various general performance analysis without third-party tools.
- Performance optimization should be based on the results of performance analysis, which must be guided by objective data provided by reliable tools.
- Considering problems systematically, such as frequent memory allocation and recycling consumes CPU resources, the test cases constructed using the built-in test package, testing, are often a good entry point for system performance analysis.
Due to space constraints, the built-in trace support in Go is not covered in this article, and will be discussed separately in subsequent articles.