Author: Jingdong Technology Hao Liang
Foreword: As a C-end front-end research and development, in addition to overcoming business difficulties, there must also be a deeper self-goal, that is, performance optimization. This matter is neither big nor small, but the difficulty is definitely not ordinary, and the scope of optimization involved is in-depth engineering of each cell. Doing a good job in front-end performance optimization is by no means an easy task! The main content of the article introduces the front-end performance evaluation indicators and optimization schemes.
1. What are the front-end performance indicators?
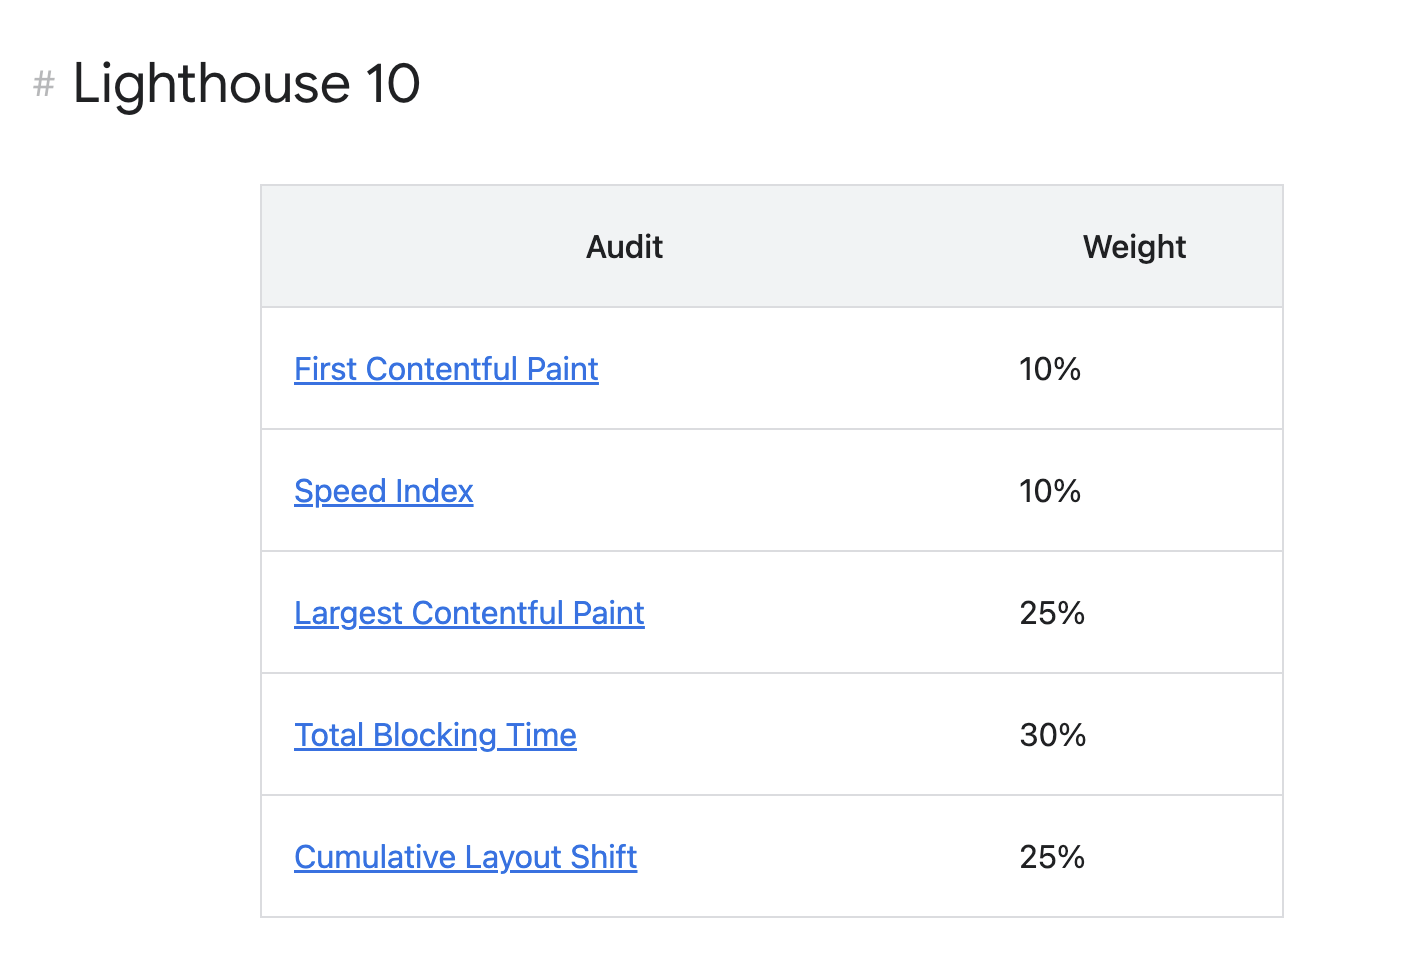
According to the latest rules of chrome Lighthouse, the front-end performance indicators mainly include FCP (First Contenful Paint), SI (Speed Index), LCP (Largest Contentful Paint), TBT (Total Blocking Time), CLS (Cumulative Layout Shift), the proportions are as follows .
2. What is FCP?
FCP: First Contentful Paint The first content drawing refers to the measurement of the time from the beginning of loading of the page to the completion of rendering on the screen of any part of the page content (text, picture, background image, svg element or non-white canvas element), which is a measure of loading speed perception one of the important indicators.
Example:
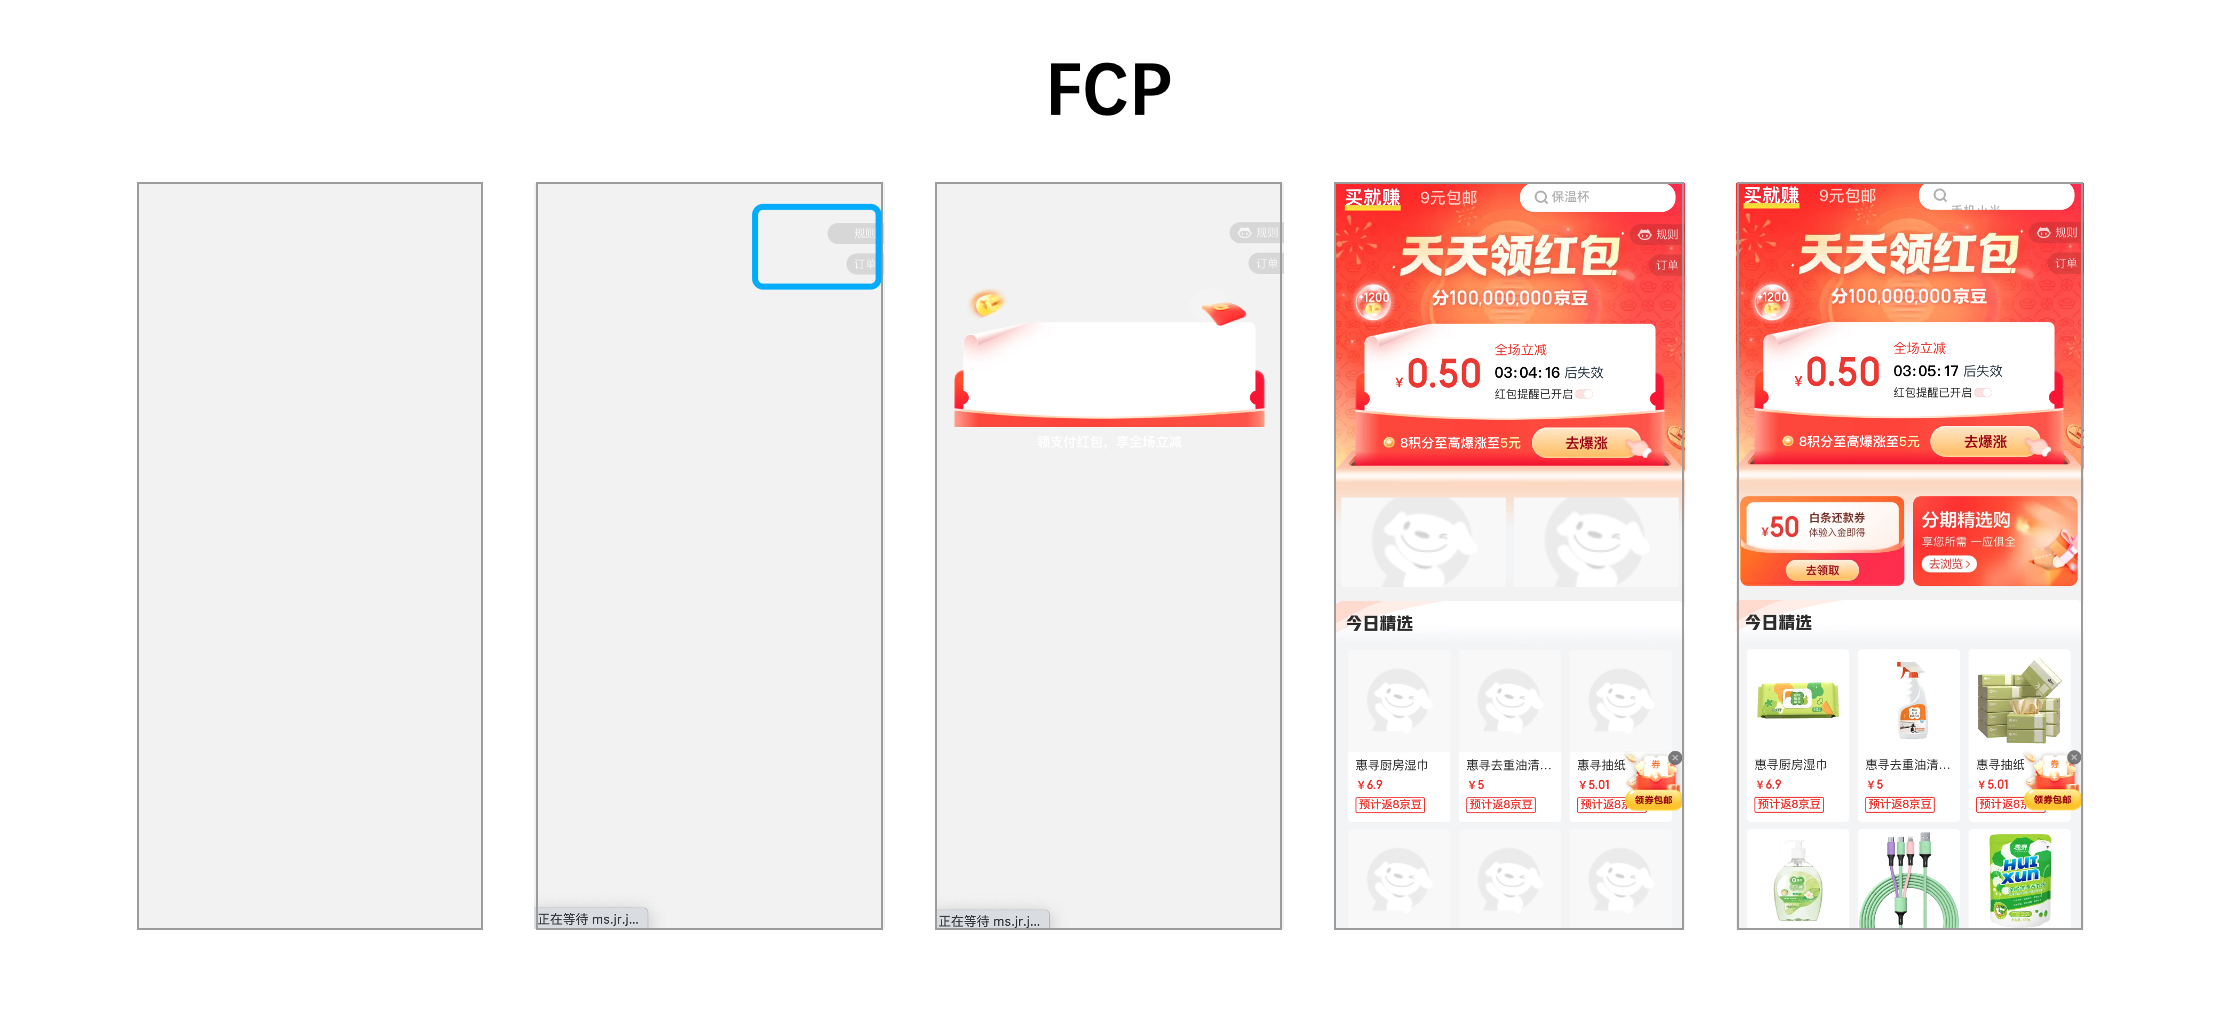
It can be observed from the above figure that in the timeline from the start of page loading to the completion of page rendering, FCP occurs in the second frame, and the first batch of text and images have been rendered on the screen.
Although part of the content of the page has been rendered, not all the content of the page has been rendered; this is the most important difference between First Content Paint (FCP) and Largest Content Paint (LCP).
FCP performance value: the rendering time of the first content drawing should be controlled within 1.8s.
We can optimize FCP from the following directions:
3. What is Speed Index?
SI: Speed Index measures how quickly content is visually displayed during page load. Lighthouse first captures the video of the page loading in the browser and calculates the visual velocity between frames. In layman's terms, it is the visible filling speed of the webpage from having something to fully displaying the content.
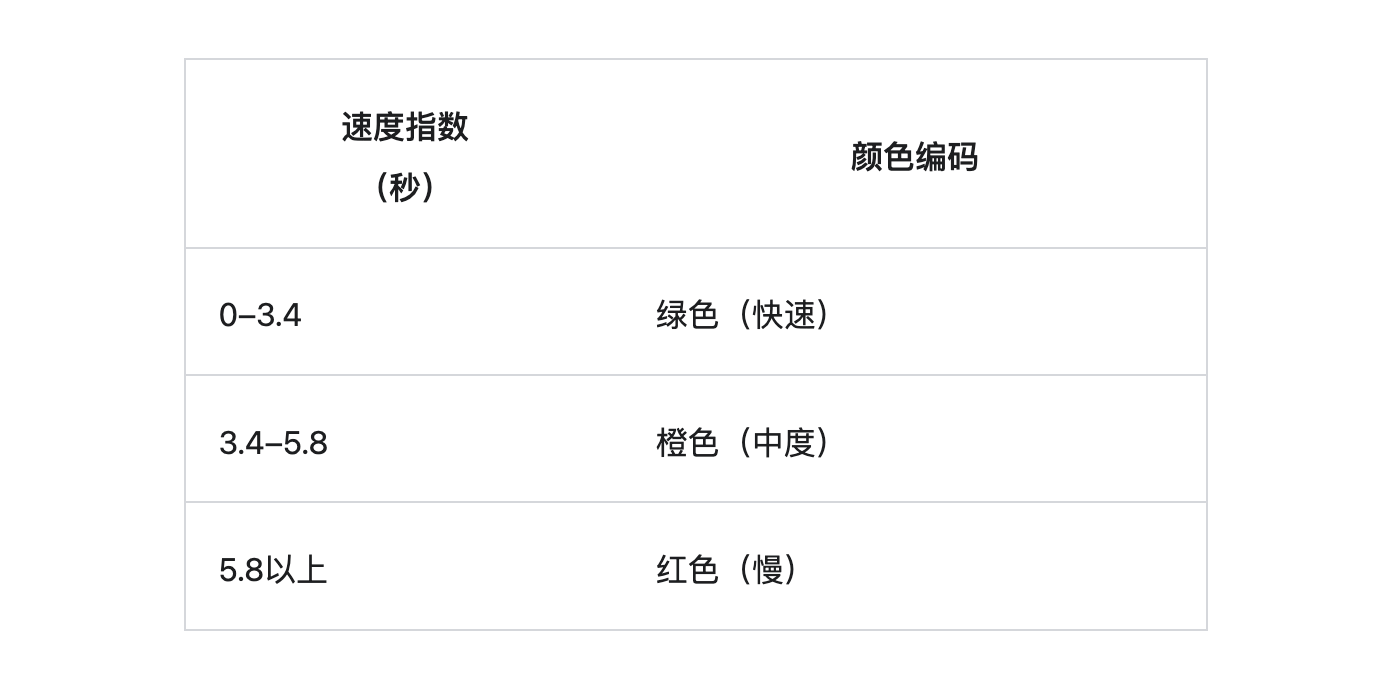
Speed Index indicator value:
We can optimize the Speed Index method from the following directions:
4. What is LCP? (emphasis)
LCP: Largest Contentful Paint The largest (most meaningful) content painting refers to the relative time when the largest image or text block visible in the visible area is reported based on the point in time when the page first starts to load.
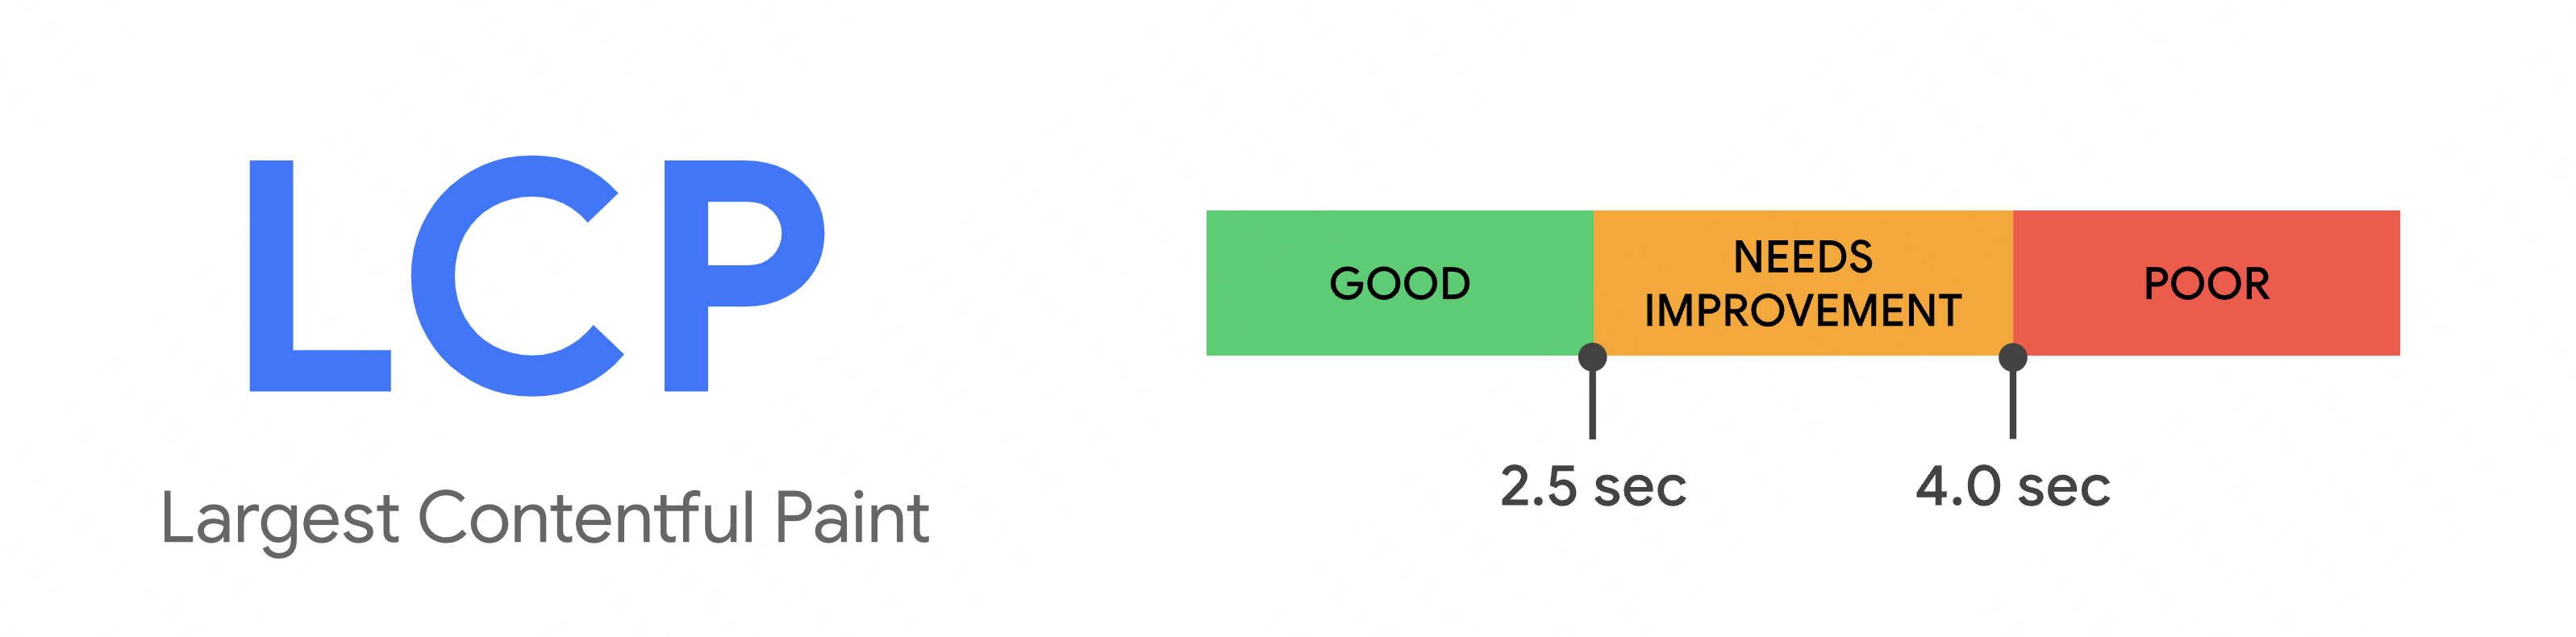
LCP indicator value:
1. What are the elements considered by the LCP?
The following relevant elements are mainly considered:
2. How is the LCP element size defined?
The element size of the largest content drawing (LCP) refers to the size visible to the user in the visible area, so the consideration is based on the visible area, if the element extends beyond the visible area, or the element is clipped or contained invisible overflow, these parts are not counted in the element size;
For the size of an image element, the indicator will compare the visible size with the original size, and take the smaller size; for example, the visible size is used for a double image, and the original size is used for a stretched and enlarged image;
For text elements, the size of the element is the size of the text node (the smallest rectangle containing all text nodes);
WARNING: Any margins, padding, or borders set via CSS for all elements are not taken into account. In addition, if a full-screen background image is set, but there are elements with a relatively large proportion (elements floating on the background image) in the visible area of the screen, resulting in a small visible area of background image exposure, then the largest content will select the visible area largest element in .
Also, an element is only considered the largest content element when it is rendered visible to the user after rendering.
3. LCP drawing time report
Due to network or technical reasons, web pages are usually loaded in segments, so the largest element is also changing.
In response to this change, the browser distributes a largest-contentful-paint type PerformanceEntry (representing a single metric data in the performance time list; performance.getEntries() obtains the time list data) immediately after drawing the first frame for identification Maximum content element. After rendering subsequent frames, the browser dispatches another PerformanceEntry when the largest content element changes.
An element of the page (an element) is only considered the largest content element when it is rendered and visible to the user. Images that are not loaded are not considered rendered and therefore not considered the largest content element. The same is true for text that uses fonts during font blocking. In these cases, the smaller element is reported as the largest element, but another PerformanceEntry object is reported once the larger element has rendered.
In addition to lazy-loaded images and fonts, pages may add new element content to the DOM as new content (interface requests, etc.) becomes available. The browser also reports a new PerformanceEntry object if a new element is larger than the previous largest content element.
If the current largest content element is removed from the viewable area (or even removed from the DOM), then until a larger element finishes rendering, that element will remain the largest content element and the performanceEntry object will not be changed.
When the user interacts with the page (by tapping, scrolling, or pressing keys), the browser will immediately stop reporting the PerformanceEntry object, because user interaction usually changes the original content of the page.
For security reasons, browsers cannot obtain image rendering timestamps for cross-origin objects that lack Timing-Allow-Origin headers, only image loading timestamps. Correctly setting the Timing-Allow-Origin header can obtain more accurate indicator values.
4. When element layout and element size change, what will affect the LCP
Case 1: Modifying the size or position of an element will not generate a new LCP candidate, only the initial size and position of the element within the visible area will be taken into consideration;
Case 2: An element that was initially rendered within the viewable area and then removed outside the viewable area will still report its initial size within the viewable area;
Case 3: While the rendering is completed outside the visible range of the screen, the elements transitioning to the screen are not reported.
Example: Maximum element changes as content loads
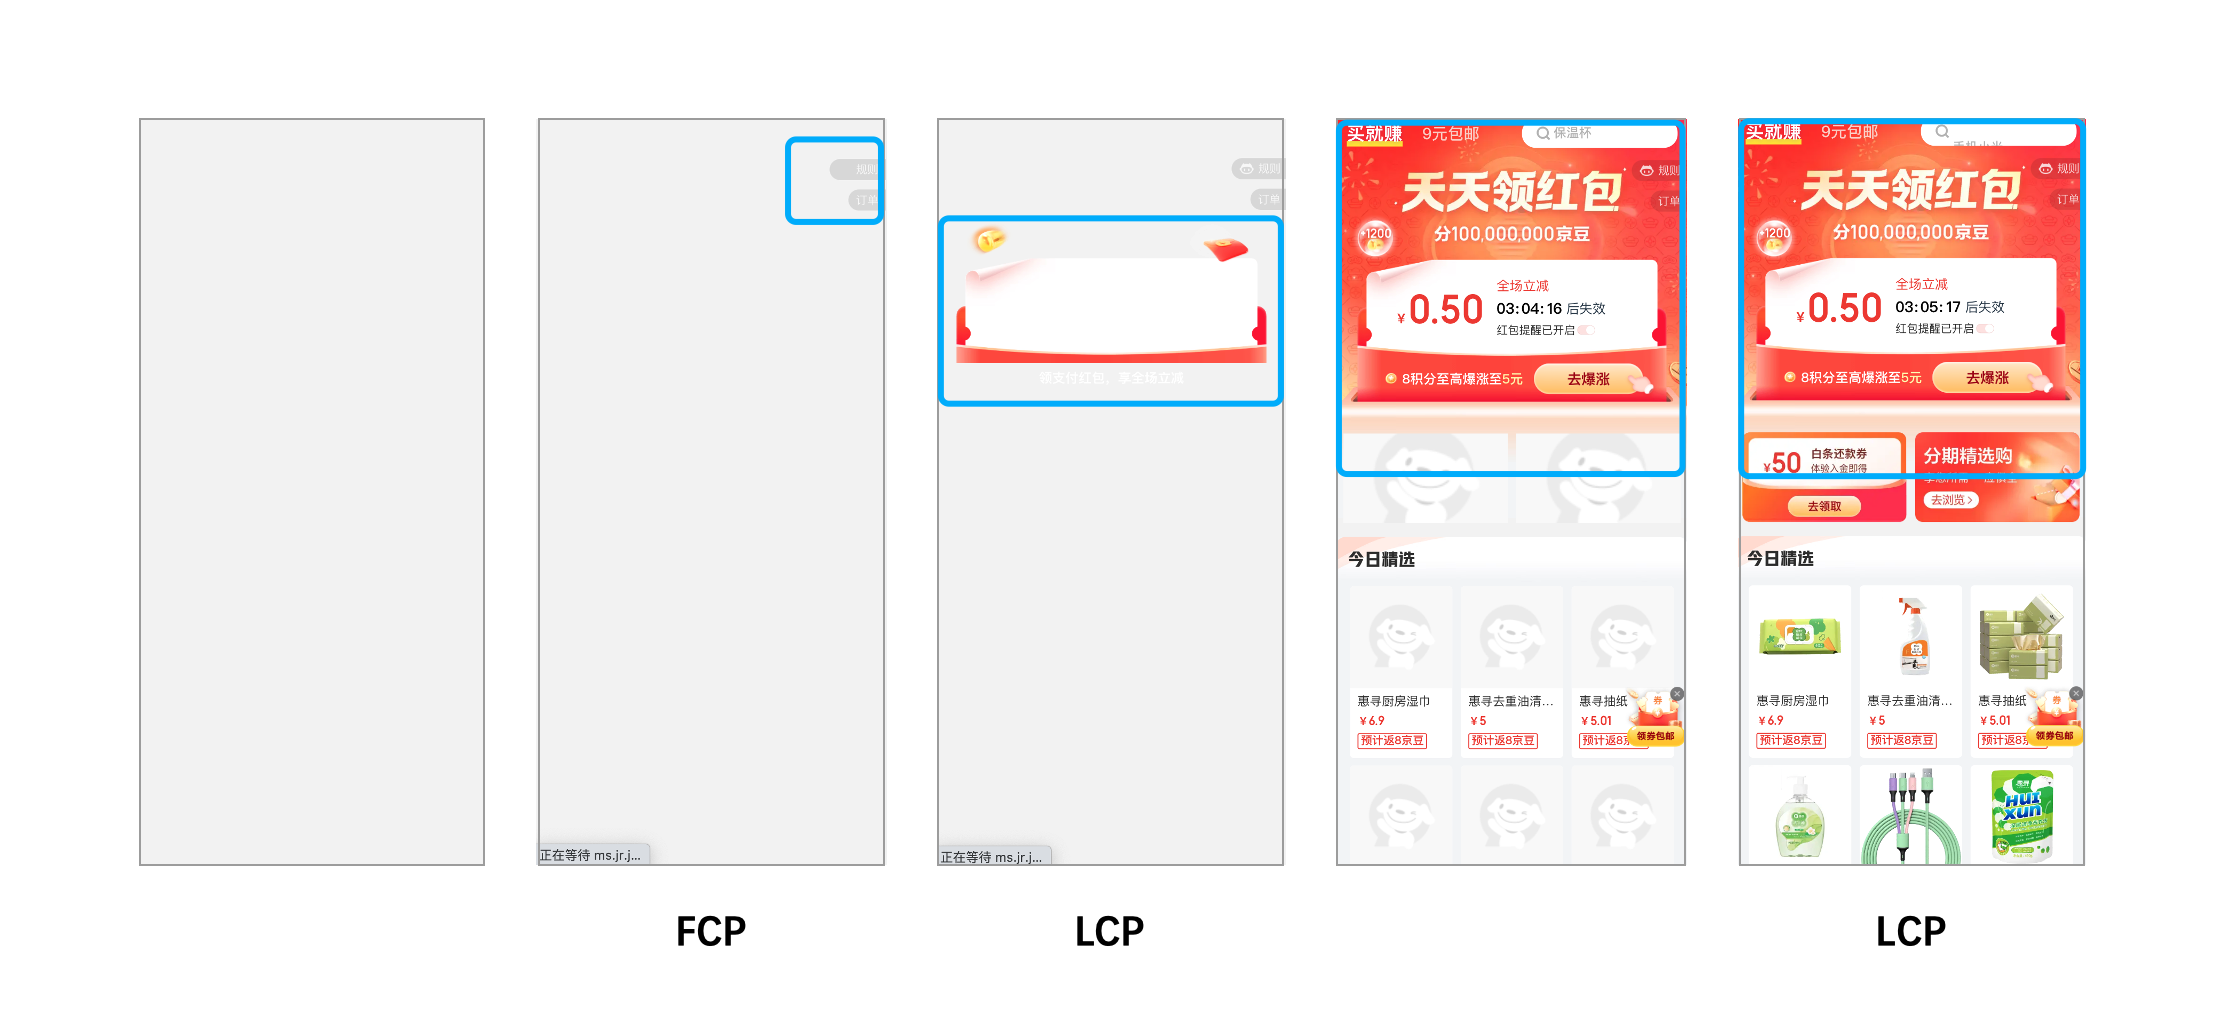

In the first example, the new content is rendered, thus causing the largest element to change.
In the second example, the previously largest content was removed from the viewable area due to a layout change.
If the delayed content is not as large as the initial maximum element, the LCP takes the initial value.
5. The largest element is not important
The most important element on the page is not the largest element. At this time, the developer assessment index is the most important element.
6. Faster rendering of main content, lower LCP value
The main reasons for affecting page rendering performance are as follows. By optimizing them, the LCP indicator value can be reduced
(1) Server response speed:
It means that the longer it takes for the browser to receive content from the server, the longer it takes for the user to render the content on the screen. Faster servers will directly affect the load value of various indicators including LCP.
Directions that can be optimized:
(2) JS and CSS that block rendering:
The browser needs to parse the DOM tree before rendering the content. During the parsing process, if any external style sheet (<link rel="stylesheet">) or synchronous JavaScript tag (<script src="main.js">) is encountered, then will pause parsing.
So scripts and styles are rendering-blocking resources that cause FCP delays, which in turn cause LCP delays. So delay loading non-essential JS and CSS, thereby improving the loading speed of the main content of the web page.
Ways to reduce CSS blocking time:
Reducing the amount of rendering-blocking JavaScript can result in faster rendering and lower LCP values
Ways to reduce JS blocking time:
(3) Slow resource loading speed:
While an increase in CSS or JavaScript blocking time directly contributes to performance degradation, the time it takes to load many other types of resources can also affect paint times.
The elements that affect the LCP are the following:
Optimization:
(4) Client rendering:
Single-page applications built by frameworks such as React, Vue, and Angular completely process logic in the client.
Optimization:
5. What is TBT?
TBT: Total Blocking Time The total blocking time is the total time that the page is blocked in response to user interaction. TBT = sum of blocking parts of all long-running tasks between LCP (first maximum content paint) and interactable time. is an important metric for measuring page load responsiveness.
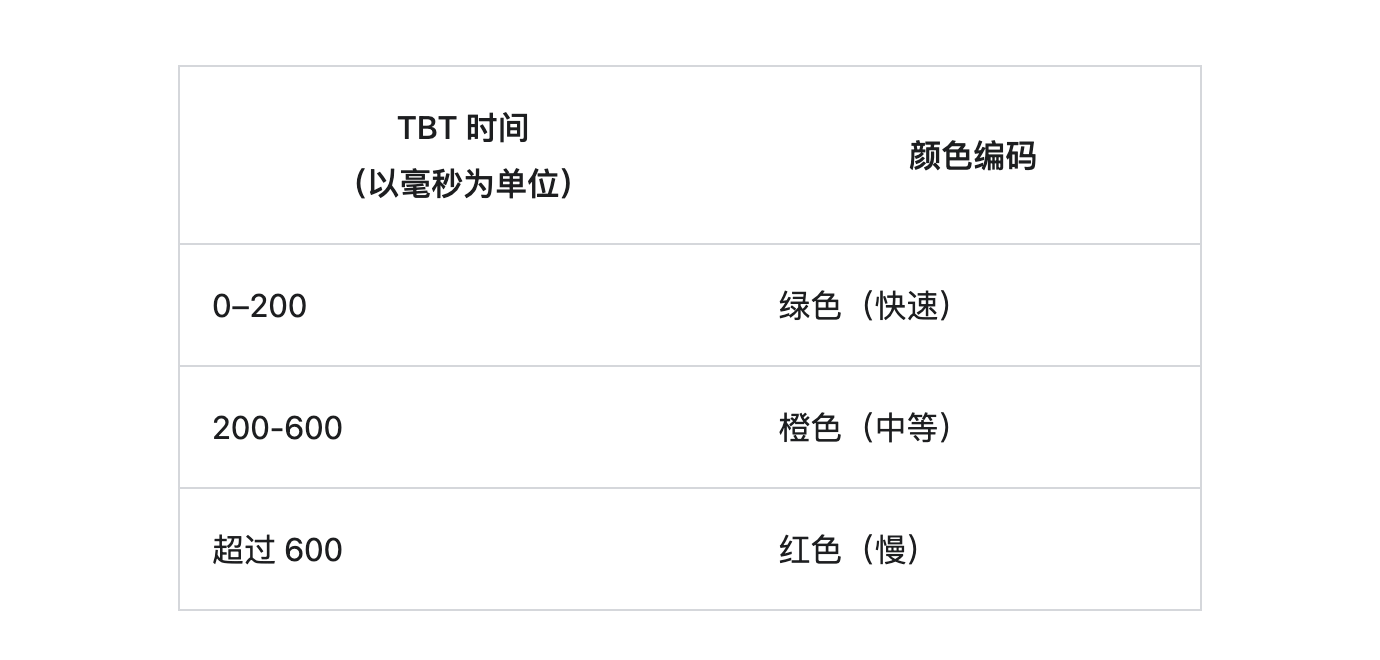
Tasks that exceed 50 milliseconds are long tasks. The amount of time beyond 50 milliseconds is the blocking portion.
Example: a 90 ms task is detected, the blocking part is 40 ms (90 - 50 = 40)
TBT indicators:
Optimization:
6. What is CLS?
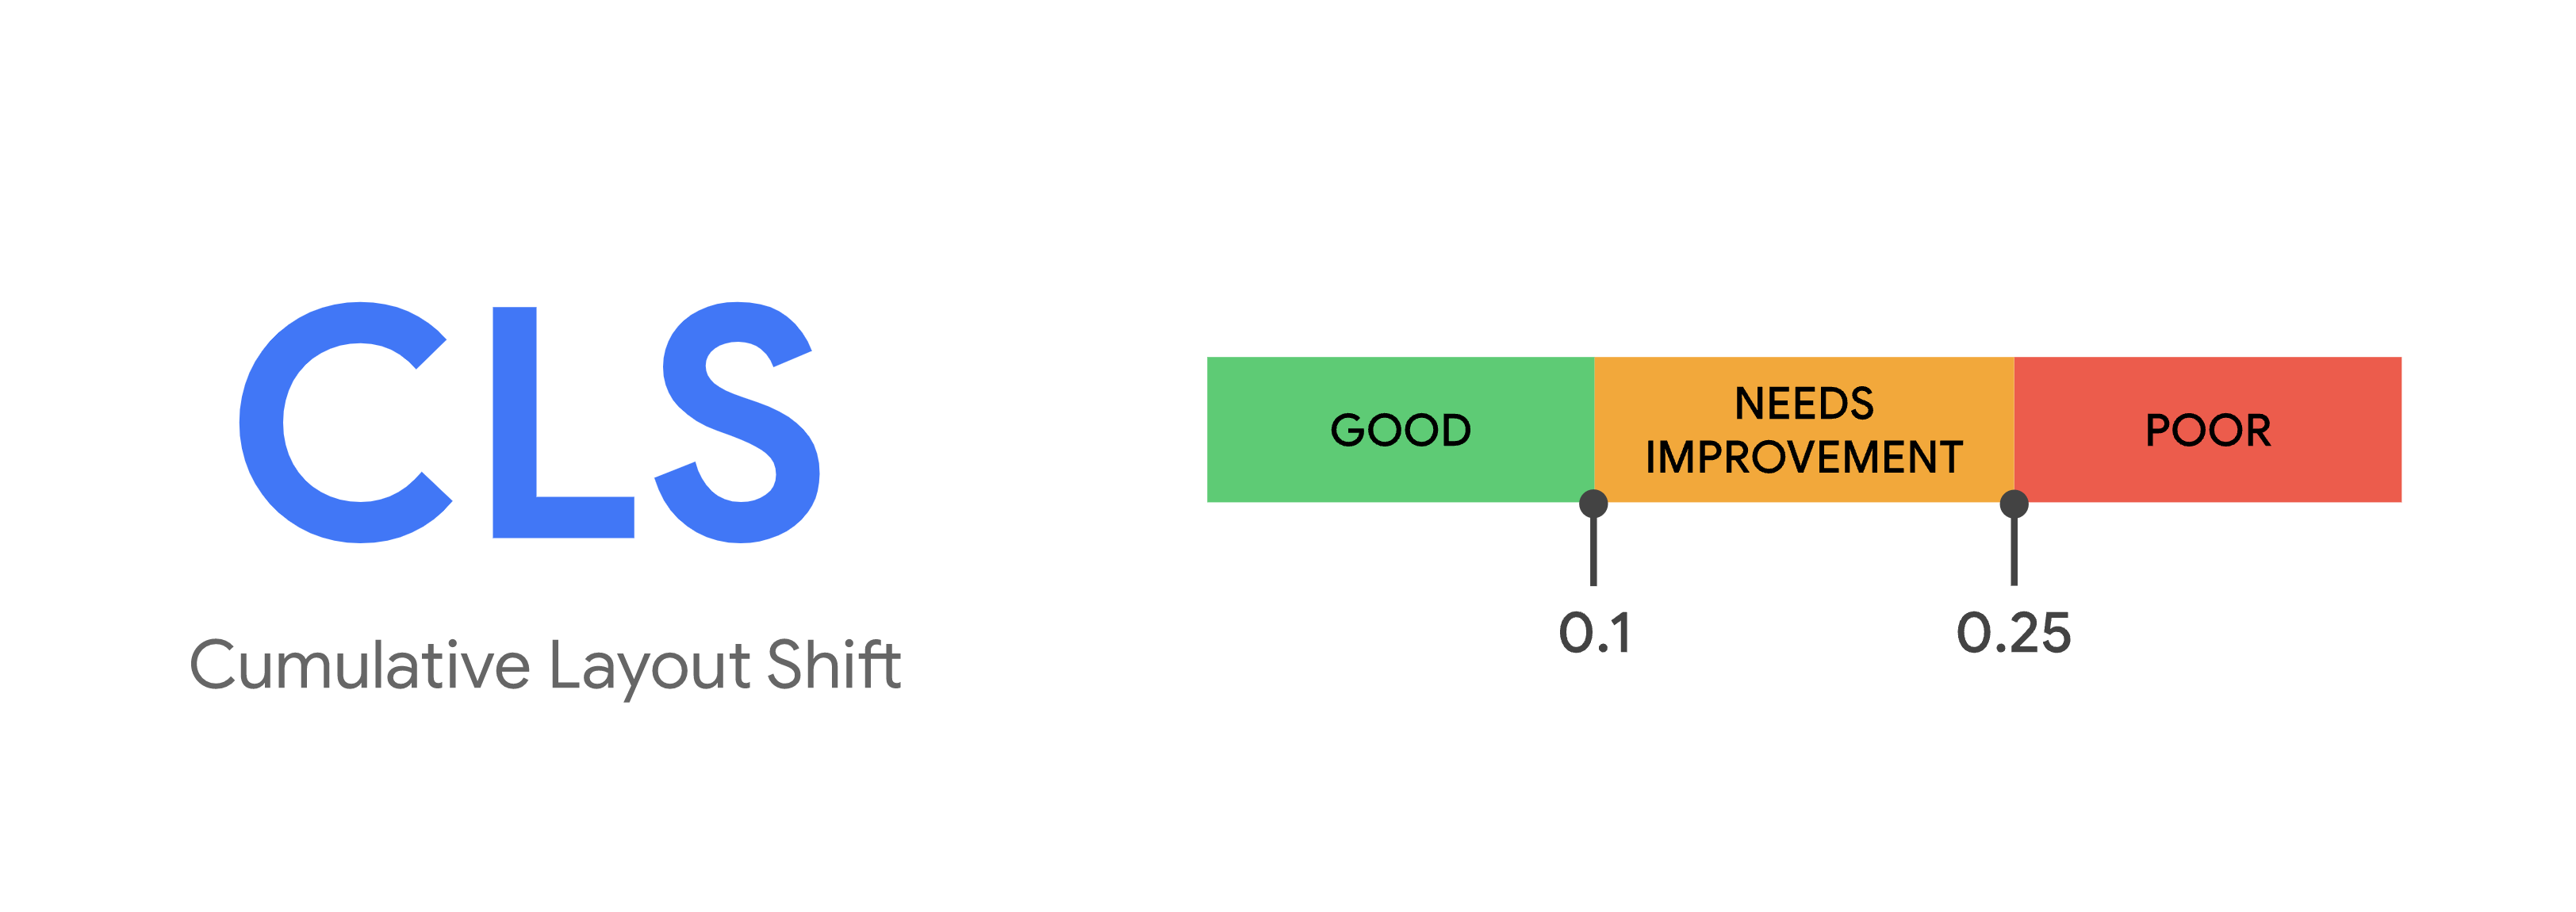
CLS: Cumulative Layout Shift (CLS) is an important measure of visual stability. is the largest sequence of layout shift fractions among all unexpected layout shifts that occur throughout the page's lifetime.
Unexpected offsets of page content are mostly caused by asynchronous resource loading, or by dynamically adding DOM elements on top of existing content on the page. The culprit could be an image or video of unknown size, a font that is actually rendered larger or smaller than the fallback font, etc.
CLS indicators:
Note: Layout offsets are only counted when the starting position of an existing element is changed. If a new element is added to the DOM or if an existing element changes size, it does not count as a layout shift. Only when the change of the element will cause the starting position of other visible elements to change, it is called offset.
Calculation formula: Layout Offset Score = Impact Score x Distance Score
Influence Score: The courseware area set of all unstable elements in the previous frame and the current frame (accounting for the part of the total visible area) is the influence score of the current frame.
Distance Score: Refers to the maximum distance (horizontal or vertical) that any unstable element is displaced in one frame divided by the maximum size dimension of the viewable area (width or height, whichever is greater).
Common causes of CLS:
Optimization:
The above five indicators are the consideration points of the current front-end performance indicators, as well as the causes of problems and optimization methods. Each optimization point can expand a lot of knowledge and learning points, so the front-end optimization work link is still very long; the optimization effect of a single point may not be obvious, but if all five points are optimized, there will definitely be a qualitative leap.
In actual projects, start from the front-end itself first, and then optimize the collaborative items after optimizing itself.
In addition, front-end optimization is a sustainable and long-term thing. The iteration of tool technology upgrades will also improve project performance. Work on optimization must continue, rather than just doing it once.
The road of front-end performance optimization is long and difficult, but it is approaching, and there will be progress in special research, and the goal will definitely be successfully achieved in the end.
Article reference: https://web.dev/ https://developer.chrome.com/