pyechart github page: https://github.com/pyecharts/pyecharts
First of all, it is necessary to clarify the rules for superimposing multiple graphs on one graph, that is, multiple graphs can only have one common axis:
- For example, the abscissa has the same meaning (such as time dimension)
- Alternatively, the ordinate values have the same meaning
Article Directory
Multiple graphs share one Y axis
Let's take the simplest line as an example, and only write out the most critical code:
import pandas as pd
from pyecharts import options as opts
from pyecharts.charts import Line
import numpy as np

x_dt = pd.date_range("2023-01-01", "2023-02-01").strftime("%Y-%m-%d").tolist()  # X轴的坐标时间
y1 = np.random.random(size=len(x_dt)) * 2
y2 = np.random.random(size=len(x_dt)) * 5
y3 = np.random.random(size=len(x_dt)) * 10

# 绘制y1
line_base = Line().add_xaxis(x_dt).add_yaxis("Y1", y1, yaxis_index=0)
line_base.set_series_opts(label_opts=opts.LabelOpts(is_show=False))
# 绘制y2
line_2 = Line().add_xaxis(x_dt).add_yaxis("Y2", y2, yaxis_index=0)
line_2.set_series_opts(label_opts=opts.LabelOpts(is_show=False))
# 绘制y3
line_3 = Line().add_xaxis(x_dt).add_yaxis("Y3", y3, yaxis_index=0)
line_3.set_series_opts(label_opts=opts.LabelOpts(is_show=False))

# 选中一个图,然后把其他的都overlap到这个图上
line_base.overlap(line_2)
line_base.overlap(line_3)

# 保存
line_base.render("many_line_overlap.html")
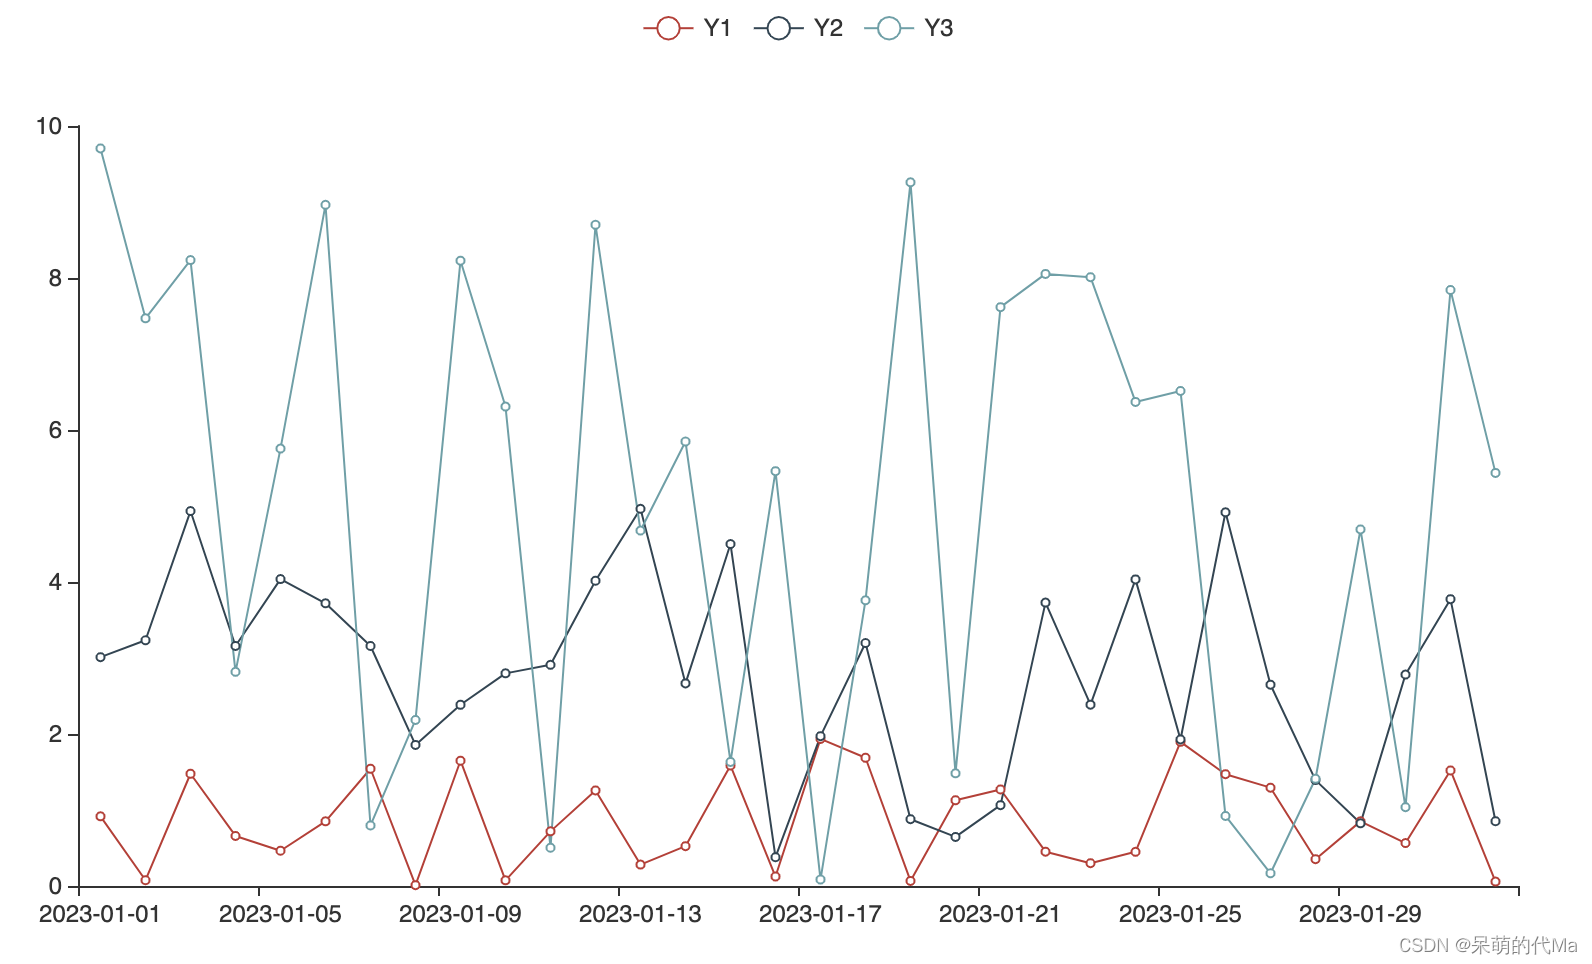
The effect of the above code is as follows:
Multi-plot with multiple Y-axes
The general flow is:
- The first picture is drawn normally
- The first graph uses the extend_axis() method to add a new axis. Using multiple extend_axis() means adding multiple axes. The extra axis can be used as the axis of another graph with different value ranges.
- The second plot uses the yaxis_index property to map the defined y-axis to the newly added axis of the first plot
- Using Figure 1.overlap(Figure 2), turn it into a graph
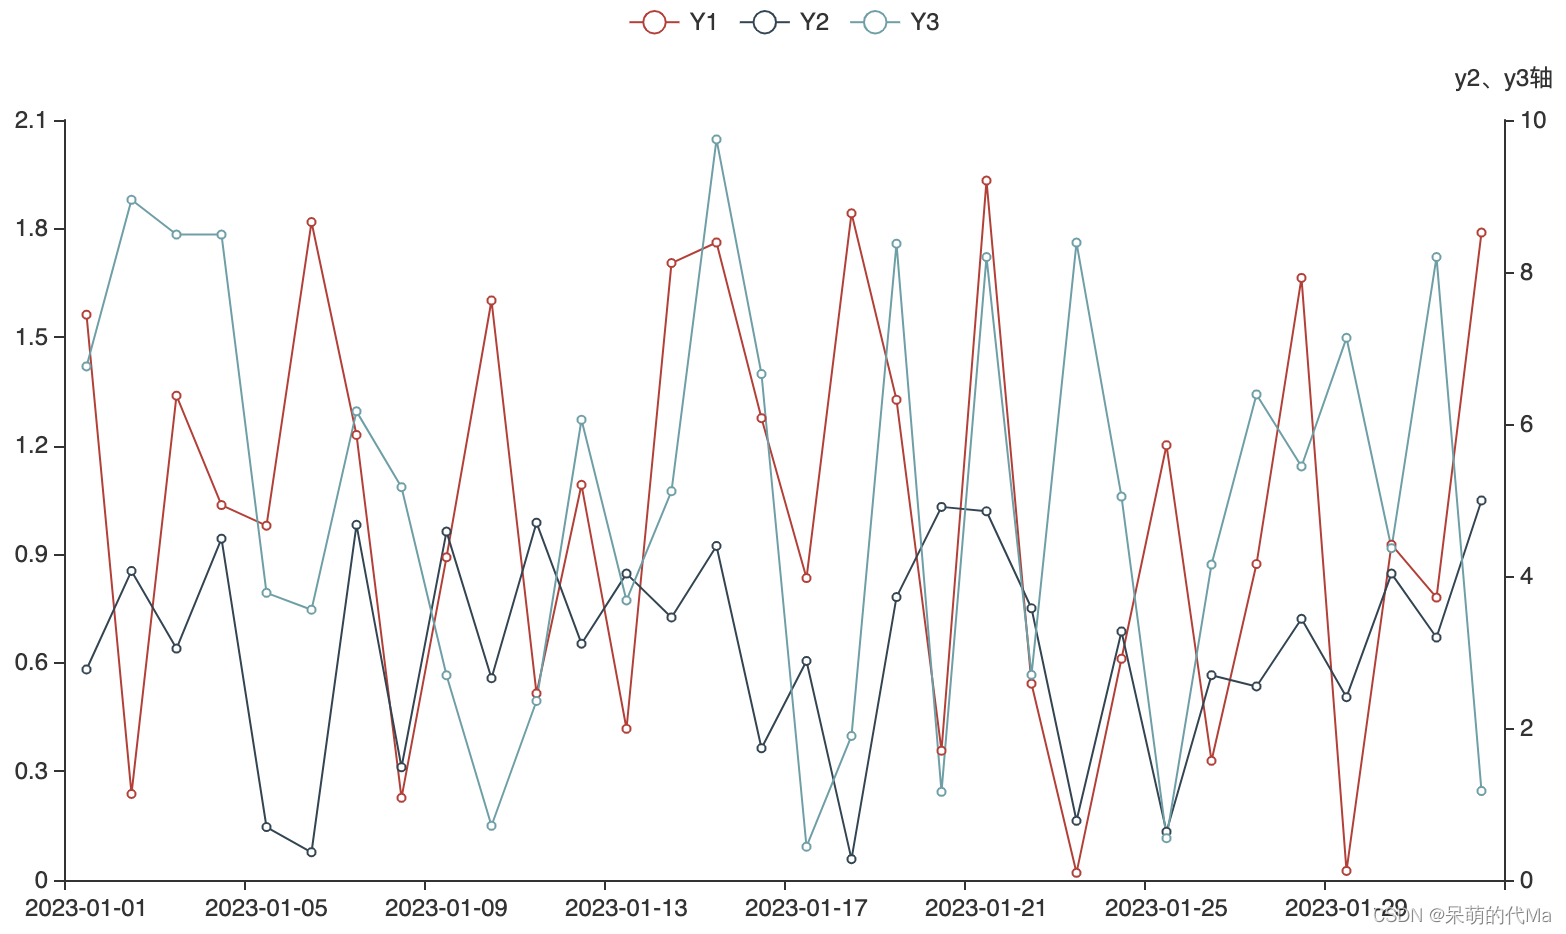
Example 1: Figure 1 uses one Y-axis alone, and Figures 2 and 3 combine to use another Y-axis
import pandas as pd
from pyecharts import options as opts
from pyecharts.charts import Line
import numpy as np
from pyecharts import options as opt

x_dt = pd.date_range("2023-01-01", "2023-02-01").strftime("%Y-%m-%d").tolist()  # X轴的坐标时间
y1 = np.random.random(size=len(x_dt)) * 2
y2 = np.random.random(size=len(x_dt)) * 5
y3 = np.random.random(size=len(x_dt)) * 10

# 绘制y1
line_base = Line().add_xaxis(x_dt).add_yaxis("Y1", y1, yaxis_index=0)
line_base.set_series_opts(label_opts=opts.LabelOpts(is_show=False))
line_base.extend_axis(yaxis=opt.AxisOpts(type_="value", name="y2、y3轴", position="right"), )

# 绘制y2
line_2 = Line().add_xaxis(x_dt).add_yaxis("Y2", y2, yaxis_index=1)
line_2.set_series_opts(label_opts=opts.LabelOpts(is_show=False))

# 绘制y3
line_3 = Line().add_xaxis(x_dt).add_yaxis("Y3", y3, yaxis_index=1)
line_3.set_series_opts(label_opts=opts.LabelOpts(is_show=False))

# 选中一个图,然后把其他的都overlap到这个图上
line_base.overlap(line_2)
line_base.overlap(line_3)

# 保存
line_base.render("many_line_overlap.html")
The effect of the above code is as follows:
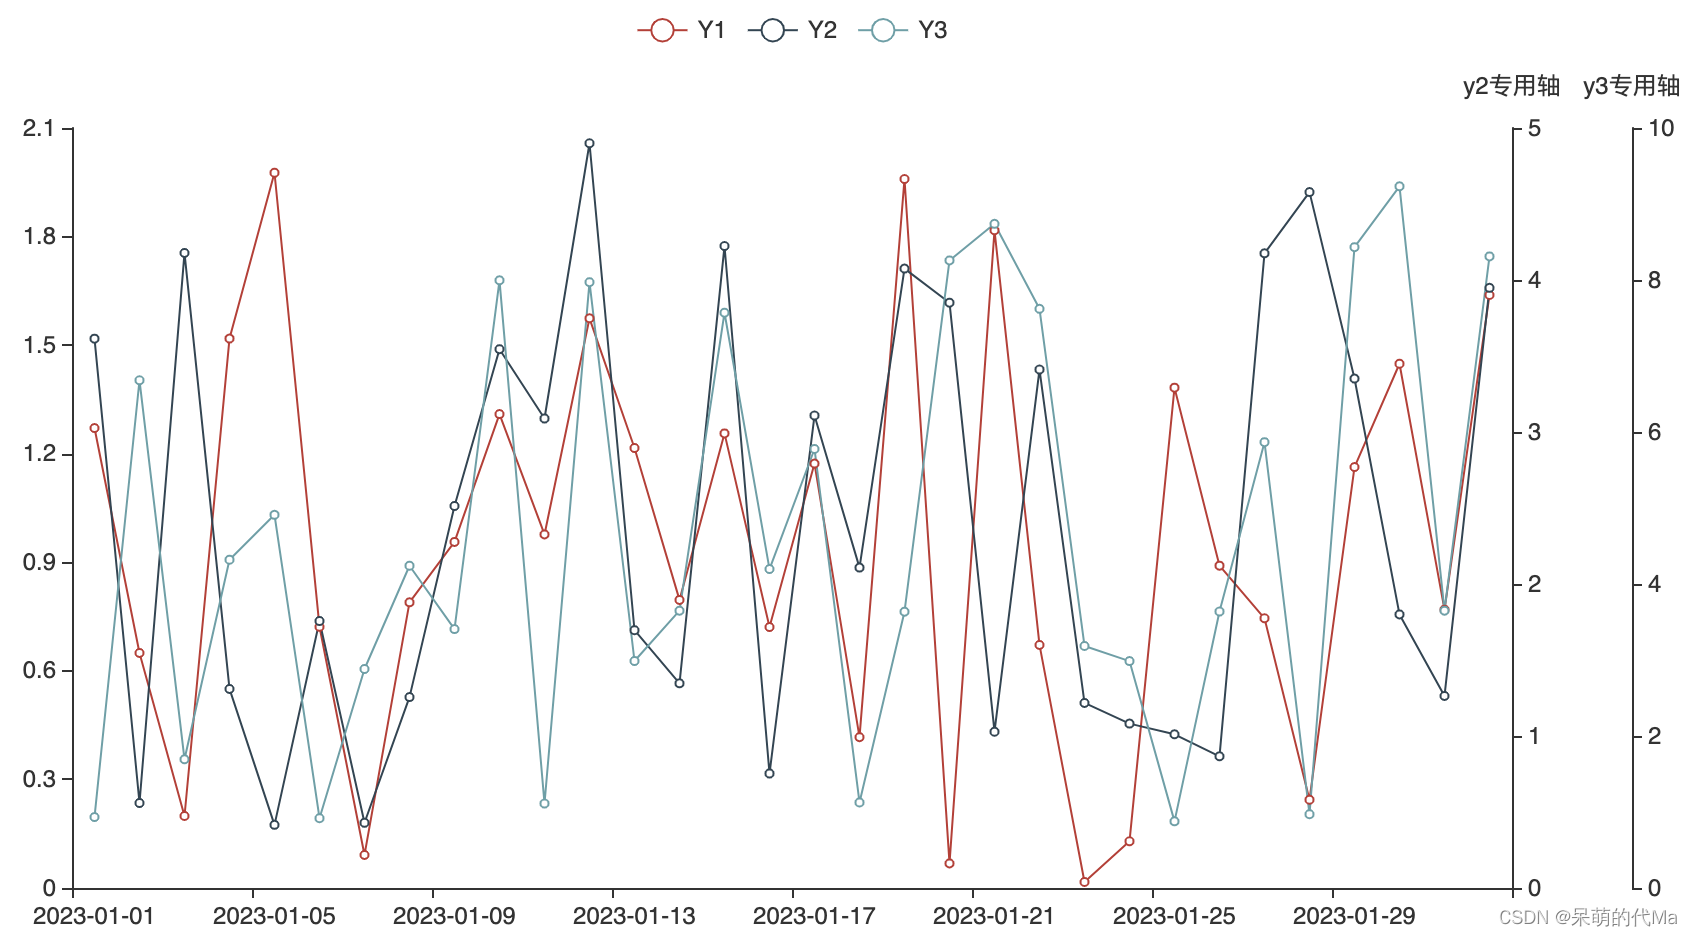
Example 1: Figure 1 uses one Y-axis alone, Figure 2 uses the second Y-axis, and Figure 3 uses the third Y-axis
import pandas as pd
from pyecharts import options as opts
from pyecharts.charts import Line
import numpy as np
from pyecharts import options as opt

x_dt = pd.date_range("2023-01-01", "2023-02-01").strftime("%Y-%m-%d").tolist()  # X轴的坐标时间
y1 = np.random.random(size=len(x_dt)) * 2
y2 = np.random.random(size=len(x_dt)) * 5
y3 = np.random.random(size=len(x_dt)) * 10

# 绘制y1
line_base = Line().add_xaxis(x_dt).add_yaxis("Y1", y1, yaxis_index=0)
line_base.set_series_opts(label_opts=opts.LabelOpts(is_show=False))
line_base.extend_axis(yaxis=opt.AxisOpts(type_="value", name="y2专用轴", position="right"), ) # 这是额外添加的第一个轴
line_base.extend_axis(yaxis=opt.AxisOpts(type_="value", name="y3专用轴", position="right", offset=60), ) # 这是额外添加的第二个轴

# 绘制y2
line_2 = Line().add_xaxis(x_dt).add_yaxis("Y2", y2, yaxis_index=1)
line_2.set_series_opts(label_opts=opts.LabelOpts(is_show=False))

# 绘制y3
line_3 = Line().add_xaxis(x_dt).add_yaxis("Y3", y3, yaxis_index=2)
line_3.set_series_opts(label_opts=opts.LabelOpts(is_show=False))

# 选中一个图,然后把其他的都overlap到这个图上
line_base.overlap(line_2)
line_base.overlap(line_3)

# 保存
line_base.render("many_line_overlap.html")