I have also written 6-7 articles about resampling one after another, and I have written a little about various types. This article is not in the plan, and I did not intend to write it.
However, some fans privately believed to me that resampling using the sample function is not very formal, and I feel that it is not a real resampling. It is only formal to use the boot package, which looks good. In fact, the sample function is the most basic sampling function in R. Many of our important R packages, such as the rms package and the proc package, use it for resampling. The sample function is very simple and flexible, and we will demonstrate it later. Some friends also confuse the article "Boot resampling to obtain logistic regression internal verification AUC credible interval" and the article "Boot resampling to obtain logistic regression internal verification AUC and draw resampling ROC curve with credible interval". In fact, the sampling of this article is a bit different. You can't put the first method directly into the second one. You have to use the second method to get the value and draw (two at the same time).
Let's start directly below. I am going to combine the two methods introduced in the previous two articles to use the sample function and the boot package to resample and draw the ROC curve respectively, and compare them. It is a summary of this content.
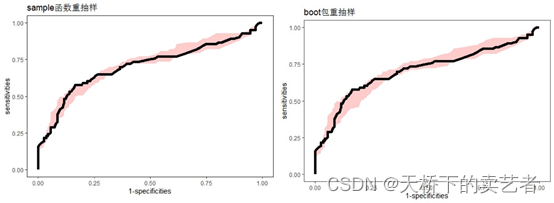
Let me talk about the conclusion first. The figure below is the resampling curve drawn by the sample function and the boot package respectively. The confidence interval of the boot is slightly wider, and the others are similar.
Now we will officially enter the topic, first do the sample function, first import the data and R package
library(pROC)
library(tidyverse)
library(boot)
bc<-read.csv("E:/r/test/buyunzheng.csv",sep=',',header=TRUE)
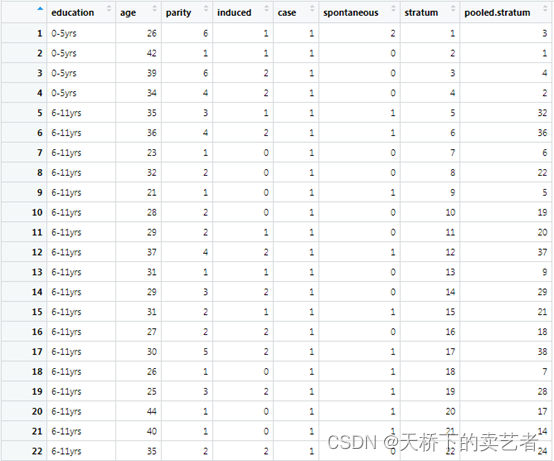
This is an infertility data (official account reply: infertility, data can be obtained) The data has 8 indicators, the last two are PSM matching results, we ignore him, and the remaining six are: Education: education level,
age : age, parity, induced: number of abortions, case: infertility, this is the outcome indicator, spontaneous: number of spontaneous abortions.
Some variables are categorical variables, we need to convert it
bc$education<-ifelse(bc$education=="0-5yrs",0,ifelse(bc$education=="6-11yrs",1,2))
bc$spontaneous<-as.factor(bc$spontaneous)
bc$case<-as.factor(bc$case)
bc$induced<-as.factor(bc$induced)
bc$education<-as.factor(bc$education)
#Modeling
This article is a reprinted article, the original address is as follows: https://mp.weixin.qq.com/s?__biz=MzI1NjM3NTE1NQ==&mid=2247487852&idx=1&sn=6e7038f142a7788ee9b78e3cb7427742&chksm=ea26f170dd517866d3361 aab741e622a58f2877a0fc5719102343328b623c1918b8b3b41df6f#rd