About the Author
Wen is a senior back-end development engineer at Ctrip, focusing on system performance, stability, trading systems and other fields.
1. Background
In today's information age, microservice technology has become an important solution. Microservice technology can make the scale and function of the system more flexible, thereby achieving higher scalability and availability. However, the timeout problem that occurs in microservice calls has also become a major hidden danger in system availability. Timeouts can cause performance degradation on the client and may even prevent it from functioning properly. This article aims at the timeout problem and proposes relevant optimization methods to reduce the risk of microservice call timeout.
1.1 Misunderstandings
When we encounter timeout or slow execution problems, we often think that there is a problem with the relying party.
For example: access to Redis, DB, RPC interfaces becomes slow or times out. Find the relying party to troubleshoot the problem as soon as possible. The feedback from the other party is that there is no problem on my side (server). Please check whether your side (client) has a problem.
In fact, performance degradation is a very complex problem that may involve multiple aspects, including the server and the client. For example, issues such as code quality, hardware resources, and network conditions will lead to performance degradation, resulting in slow response, timeout, and other issues. Therefore, we need to comprehensively analyze the problem and find out the various factors that affect performance.
1.2 Purpose of sharing
This article will introduce in detail the problems such as slow execution and timeout that we encounter in the production environment, and propose relevant optimization methods to reduce the risk of slowdown or timeout and improve the stability of the system by optimizing long-tail performance.
2. Classification of timeouts
There are generally two types of common timeouts:
a. Connection timeout (ConnectTimeout): means that the time required to establish a network connection exceeds the set waiting time.
b. Socket timeout (SocketTimeout): means that during the data transmission process, the time the client waits for the server to respond exceeds the set waiting time.
As shown in the figure below, ① is the time of concern for connection timeout, and ② is the time of concern for Socket timeout. The timeout explained in this article is Socket timeout.
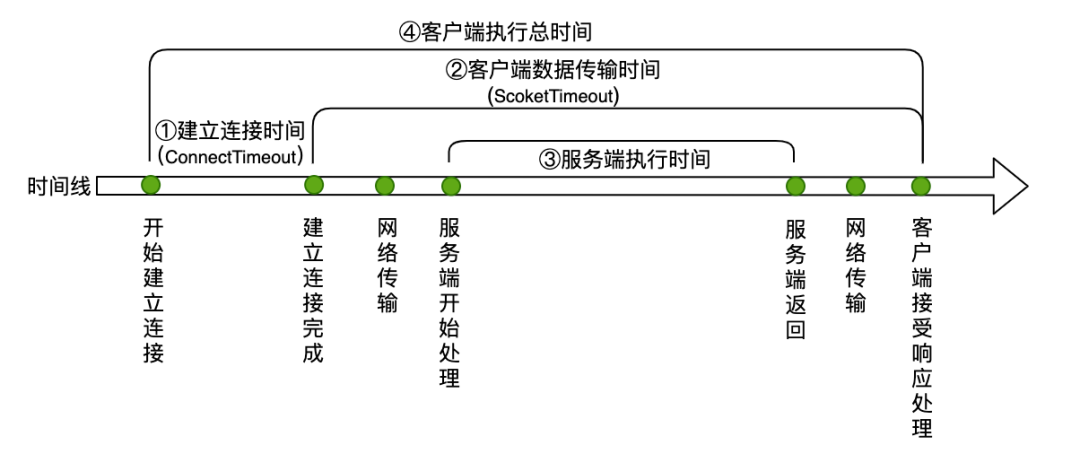
Figure 1 Client request process
3. Timeout problem analysis and optimization
3.1 Set a reasonable timeout
Set a reasonable timeout based on the actual situation to avoid interface timeout caused by unreasonable timeout settings.
1) Analysis
Check whether the timeout set by the client is reasonable. For example, if the P99.9 of the server is called to 100ms and the timeout set by the client is 100ms, 0.1% of the requests will time out.
2) Optimization plan
When setting the timeout, we need to comprehensively consider network delay, service response time, GC, etc.
Take the ticket event query engine as an example:
Core interface: minimum value (P99.9*3, user-acceptable waiting time), the core will affect the order, and try to produce results within the user-acceptable range.
Non-core interface: minimum value (P99.9*1.5, user-acceptable waiting time), non-core interface does not affect orders, and it does not matter if it is not displayed.
3.2 Current limiting
When the system encounters sudden traffic, it uses current limiting to control the access speed of the traffic to avoid system crashes or timeouts.
1) Analysis
Check whether there is a sudden increase in the number of requests at the timeout point. For example, there is some sudden activity. At this time, the application is not expanded in advance. Facing the sudden increase in traffic will cause the application load to be relatively high, leading to timeout problems.
2) Optimization plan
Evaluate the maximum traffic that the current application can carry and configure traffic limiting. The dimension can be single machine + cluster.
Single-machine current limiting: Avoid single-machine crash when faced with sudden increase in traffic.
Cluster current limiting: Provide maximum service capabilities under limited resources to ensure system stability without crash or failure.
3.3 Improve cache hit rate
Improving the cache hit rate can improve the response speed of the interface and reduce the response time of the interface, thus reducing the occurrence of timeouts.
1) Analysis
Analyze the calling link, find slow areas and optimize them to improve the response speed of the server.
As shown in the figure below, it is obvious that the execution time of the server exceeds the timeout configured by the client by 200ms, resulting in a timeout.
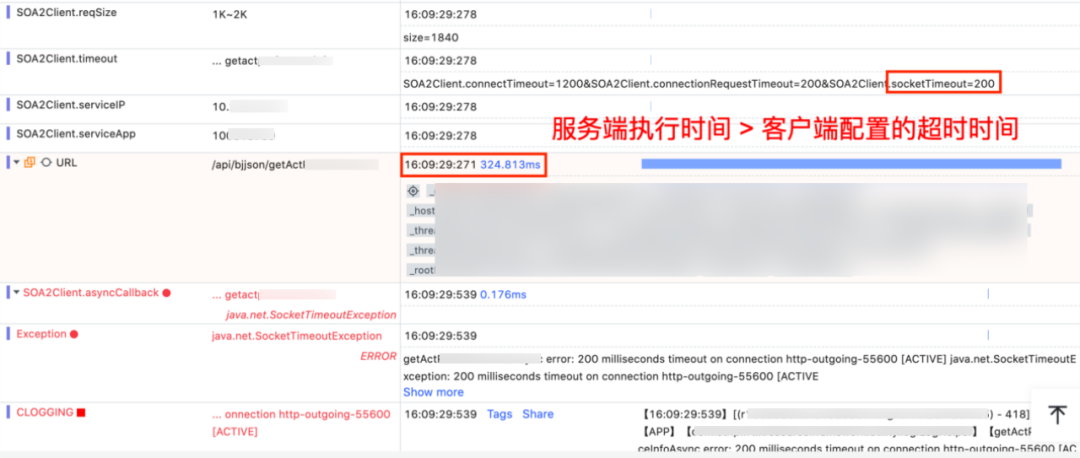
Figure 2 Client calls server timeout link
Continue to analyze the server execution link and find that it is caused by cache misses.
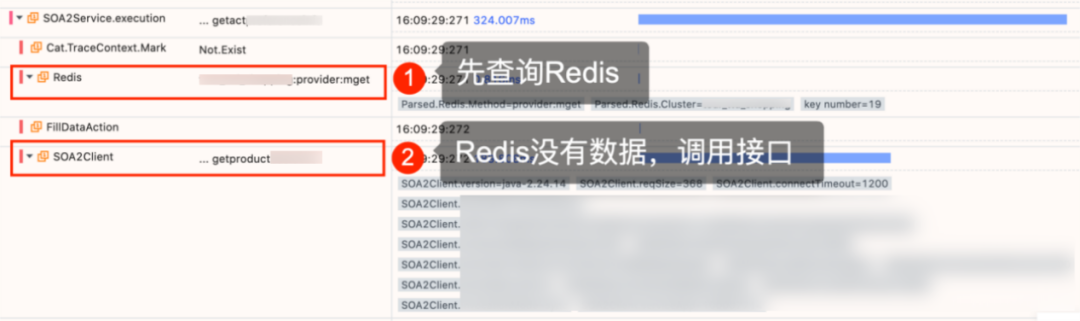
Figure 3 Cache miss link
2) Optimization plan
For high-concurrency systems, it is common to use cache to improve performance.
The figure below shows the previous cache architecture. This cache architecture has two risks.
a. The cache is fixedly expired, which will cause a large number of key failures at a certain time to directly penetrate the database.
b. The active refresh mechanism is to delete the cache and listen to the database binlog messages to delete the cache. If a large amount of data is refreshed, a large number of keys will become invalid.
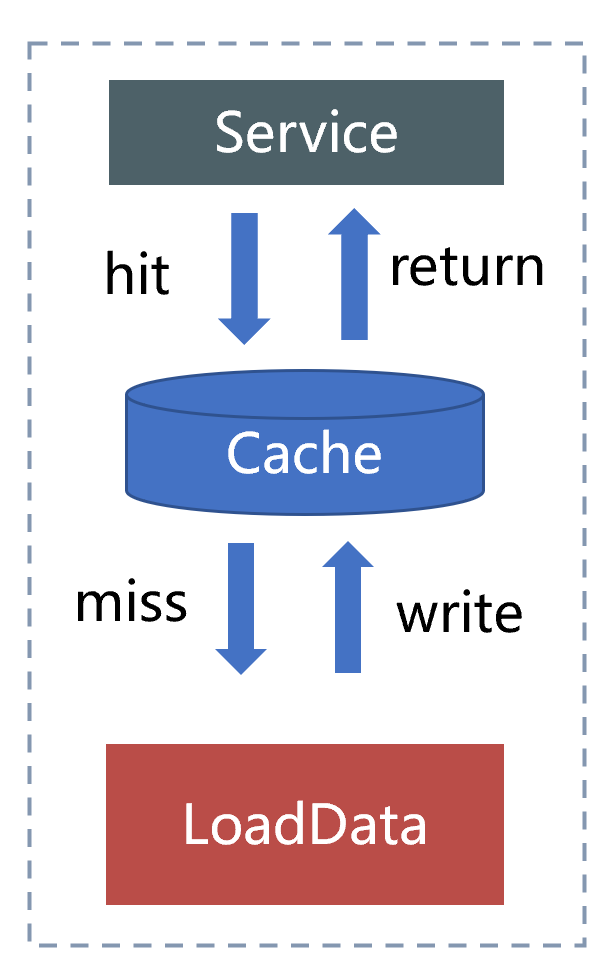
Figure 4 Fixed expiration + lazy loading mode
In response to the above risks, we have optimized the cache architecture, changing fixed expiration to active renewal of the cache, and actively listening for messages to refresh the cache, as shown in the figure below.
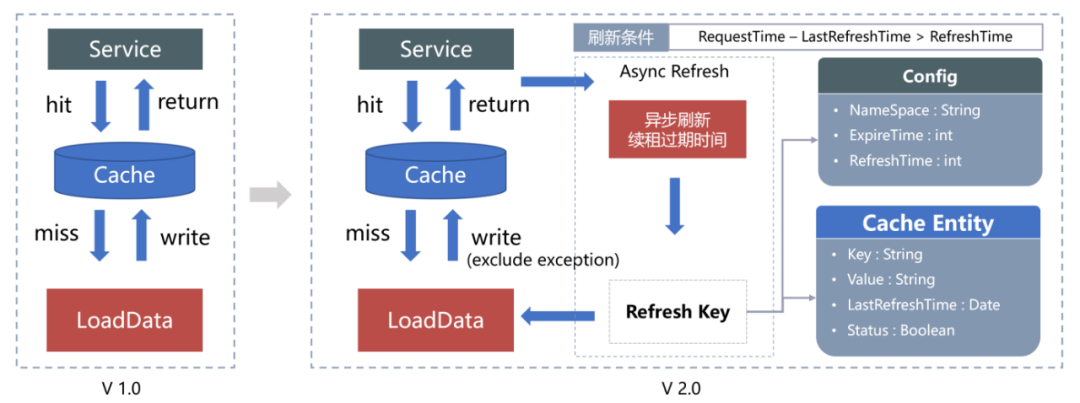
Figure 5 Comparison of architecture before and after caching
3) Effect
The cache hit rate is increased to more than 98%, and the interface performance (RT) is improved by more than 50%.
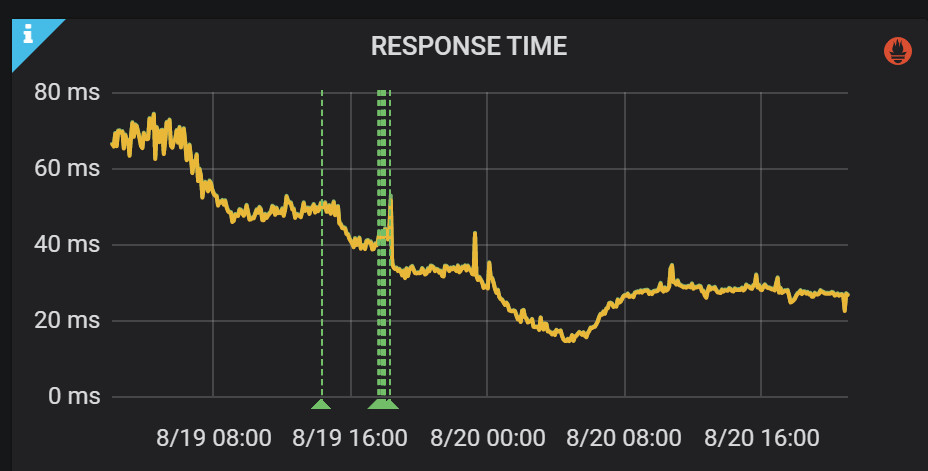
Figure 6 Processing performance increased by 50%
This caching optimization solution was published in an article written by our team before, "80,000 Tickets Sold in 1 Minute!" There is a detailed introduction in " Technical Thinking Behind Ticket Grabbing" . The specific details will not be elaborated here. Interested students can read it by themselves.
3.4 Optimize thread pool
Reduce unreasonable threads and reduce timeouts caused by thread switching.
1) Analysis
a. Number of HTTP threads
First check whether the number of HTTP threads on the server side has increased significantly and the traffic has not increased. Make sure that the increase in the number of HTTP threads is not caused by the increase in traffic. As shown in the two figures below, when the traffic is normal, the number of HTTP threads increases, indicating that the server response is slow, and it can be confirmed that the timeout is caused by the server.
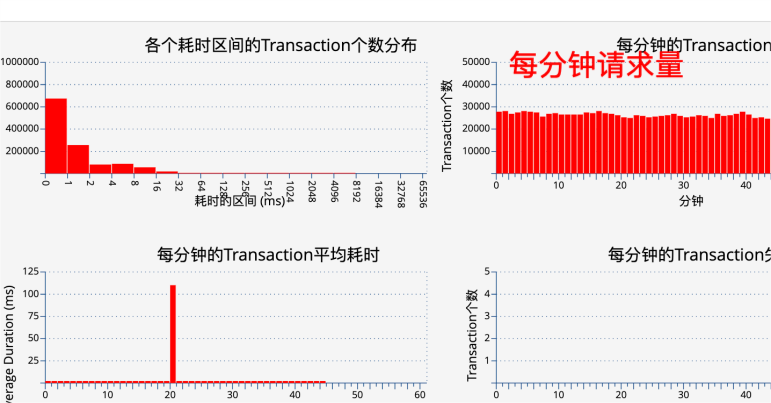
Figure 7 Service traffic is stable
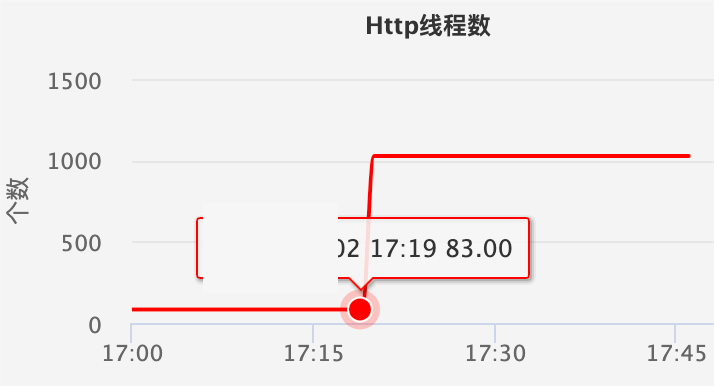
Figure 8 The number of HTTP threads increases suddenly
b. Total number of threads
Check again to see if the total number of threads has increased (excluding the number of HTTP threads). If so, it means that the number of threads has increased due to the use of multi-threading. At this time, you need to Dump the threads to see which threads are used more.
2) Solution
a. Unified management of thread pool: dynamic configuration parameters + monitoring capabilities
A unified thread pool is encapsulated through tool classes, providing dynamic configuration parameters and thread pool monitoring capabilities.
Effect
The thread pool has monitoring capabilities. The following figure shows the monitoring of the minimum value (number of core threads), maximum value (maximum number of threads) and the number of threads in the current thread pool. You can refer to this to adjust the thread pool parameters.
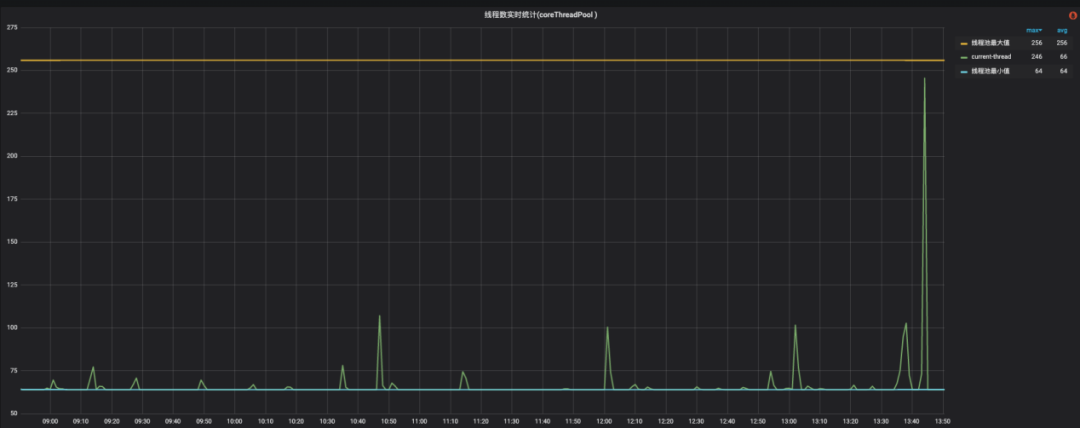
Figure 9 Thread pool water level monitoring
b. Asynchronous to synchronous: do not use multi-threading if it is less than 10ms
In high-concurrency scenarios, there are too many threads, and thread scheduling time cannot be guaranteed. A task requires multiple CPU time slices, and the next scheduling time cannot be guaranteed.
The following figure shows the time-consuming execution time of a thread pool. Through the buried points, it is found that A executes faster in the thread pool. The average line and P95 are both below 10ms. There is no need to use the thread pool and change to synchronous execution.
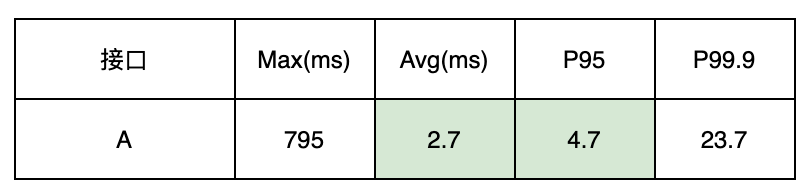
Figure 10 Execution time before optimization
Effect
The interface performance has been significantly improved, with the average line reduced from 2.7ms to 1.6ms, and P99.9 reduced from 23.7ms to 1.7ms.
In the past, multi-threading was used, and when the request volume fluctuated, the number of threads increased more, resulting in thread scheduling time not being guaranteed, and the P99.9 was very high.
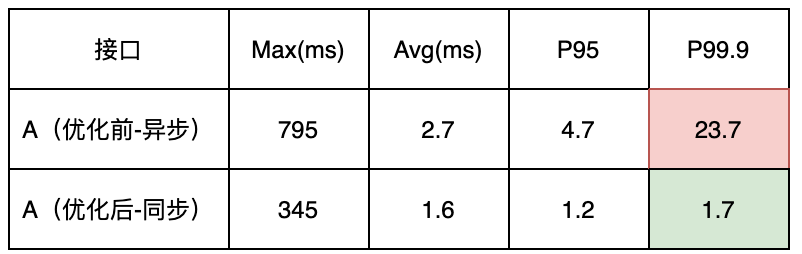
Figure 11 Comparison of time consumption before and after optimization
In addition, it can be clearly seen that the total number of threads has been reduced accordingly.
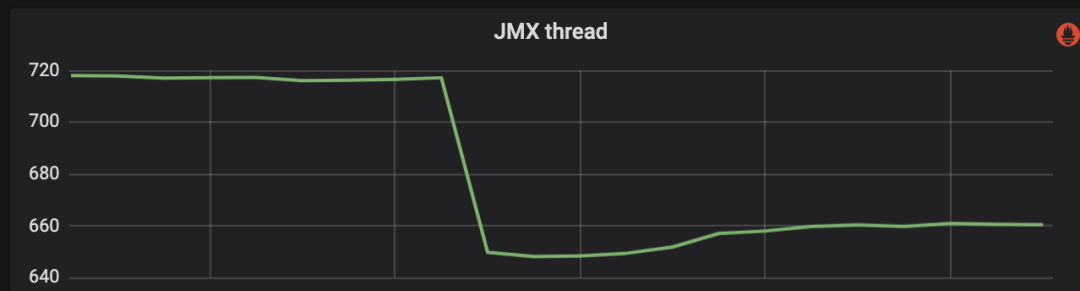
Figure 12 The total number of threads decreases after asynchronous change to synchronization
3.5 Optimize GC
Optimize GC, reduce GC pause time, and improve interface performance.
1) Analysis
First check whether there is a Full GC at the timeout point, and then check whether there are obvious glitches in the Yong GC. As shown in the figure below, you can see three obvious glitches.
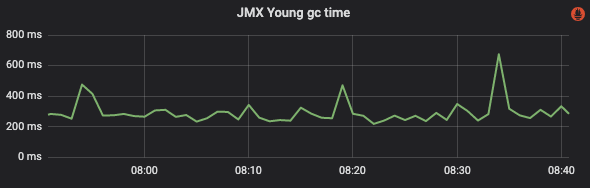
Figure 13 Yong GC time
If the timeout time point (as shown below) can correspond to the GC glitch time point, it can be confirmed that the problem is caused by Yong GC.
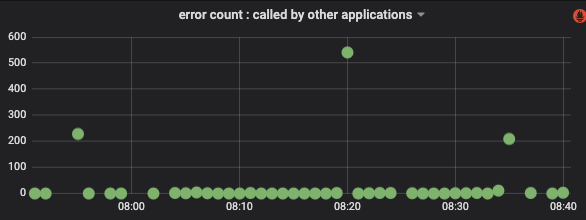
Figure 14 Number of timeouts when the client calls the server
2) Solution
a. Universal JVM parameter tuning
Check whether the two values of -Xmx -Xms are set the same. If they are different, the JVM will dynamically adjust the heap size according to the actual situation during runtime. This adjustment frequently has performance overhead, and if the initialization heap is small, the number of GC will be relatively small. frequently.
Effect
-Xmx3296m -Xms1977m is changed to -Xmx3296m -Xms3296m. The effect is as shown in the figure below. There is a significant decrease in frequency and time.
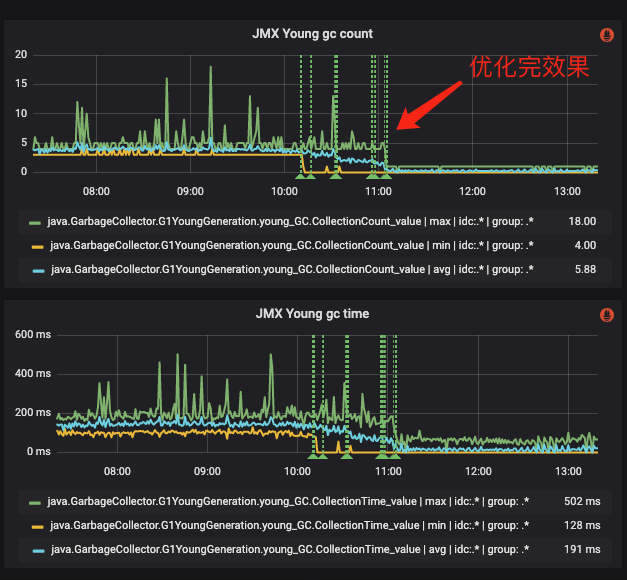
Figure 15 Effect after tuning universal JVM parameters
b. G1 garbage collector parameter tuning
Background: If the maximum and minimum values of the new generation are not set or only one of the maximum and minimum values is set, then G1 will occupy the entire heap space according to the parameters G1MaxNewSizePercent (default value is 60) and G1NewSizePercent (default value is 5). The ratio is used to calculate the maximum and minimum values, and dynamic balancing is used to allocate the new generation space.
When the JVM is just started, the default allocation of the new generation space is 5% of the total heap. As the traffic increases, the new generation can easily become full, resulting in Yong GC. Next time, more new generation space will be reallocated until the default 5% is reached. Dynamic expansion and appropriate initial values. This configuration is prone to frequent Yong GC when publishing access traffic or large traffic influx.
To address this type of problem, the optimization solution is to increase G1NewSizePercent and increase the initial value to make the GC more stable. This value needs to be set according to the business scenario and refer to the initial size distribution of Eden in the GC log. If it is too large, it may cause Full GC problems.
Taking the query engine as an example, according to GC log analysis, the proportion of the new generation size in the heap is relatively stable after 35%. The set parameters are:
-XX:+UnlockExperimentalVMOptions -XX:G1NewSizePercent=35
Effect
The effect after optimization is as shown below. You can see that after optimization, the number of GCs is reduced from 27 times/min to 11 times/min, and the GC time is reduced from 560ms to 250ms.
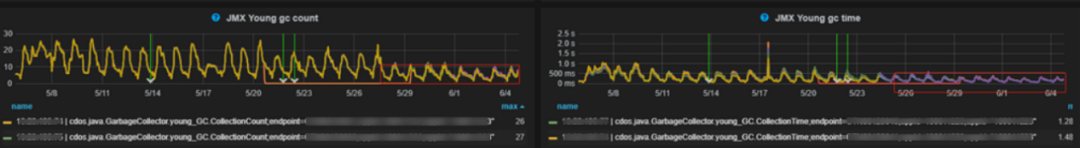
Figure 16 Effect after tuning G1 parameters
3.6 Change thread asynchronous to NIO asynchronous programming
NIO (non-blocking IO) can reduce the number of threads, improve thread utilization, thereby reducing timeouts caused by thread switching.
1) Analysis: CPU indicators
Analyze CPU-related indicators. If the CPU utilization is normal and the CPU Load is high, you need to focus on it (if the CPU utilization is high, it means that the CPU itself is very busy, so it is normal for the CPU Load to be high).
Before analysis, let’s introduce a few concepts:
a. CPU time slice
The CPU divides time into several time slices, and each time slice is allocated to a thread. When a time slice is used up, the CPU will stop the execution of the current thread, context switch to the next task, and so on.
This allows multiple tasks to be executed concurrently at the same time, improving system efficiency and response speed.
The figure below simulates the execution process of a single-core CPU. It should be noted that context switching requires overhead, but the actual time required for a context switch is very short (usually at the microsecond level).
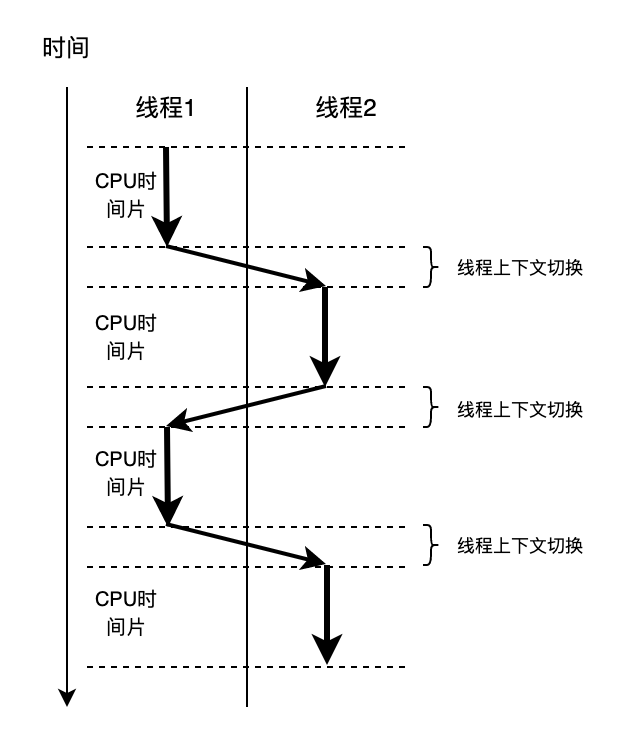
Figure 17 CPU execution thread process
b. CPU utilization
To understand it from the time slice dimension, it is assumed that every time slice is exactly used up.

c. CPU Load
From the above conceptual analysis, if the CPU utilization is normal but the CPU Load is high, it means that the CPU has a lot of idle time slices and a lot of waiting threads, and very few time slices are being used. In this case, to reduce the CPU Load, you need to reduce the number of waiting threads.

2 ) Analysis: actual cases
We have encountered many times in production before that CPU Load and high CPU utilization were normal. The code did not change before and after the problem occurred. The more obvious change is that the traffic increased. After checking the code, we found that the thread pool is used to call the interface concurrently. The calling method is as follows.
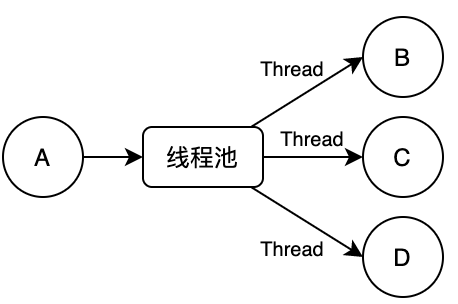
Figure 18 Thread pool execution model
This method does not see any problems when the traffic is low. As the traffic increases, the number of threads required will double.
For example: a request for A requires calling 3 interfaces of BCD, then the number of threads required for 100 concurrency is 100 + 3*100=400 (the first 100 is the main thread corresponding to A, and the following 3*100 are the 100 required by BCD thread).
3) Solution
The thread pool concurrent call is changed to NIO asynchronous call, as shown in the figure below.
Compared with before, 100 concurrency requires 100 threads (the threads of NIO itself are not considered here, this is global, and it is a relatively fixed and small number of threads).
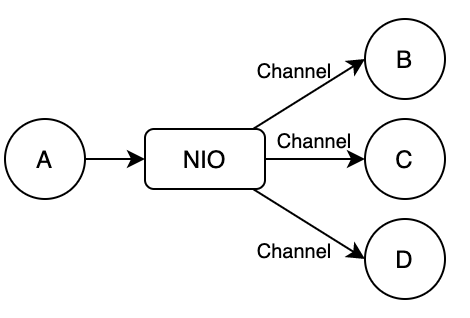
Figure 19 NIO asynchronous call execution model
4) Effect
The timeout problem has not occurred again, and the CPU load has dropped by 50% on average. Before, the load often exceeded 2 (the number of CPU cores was 2). After the transformation, the load dropped to about 0.5.
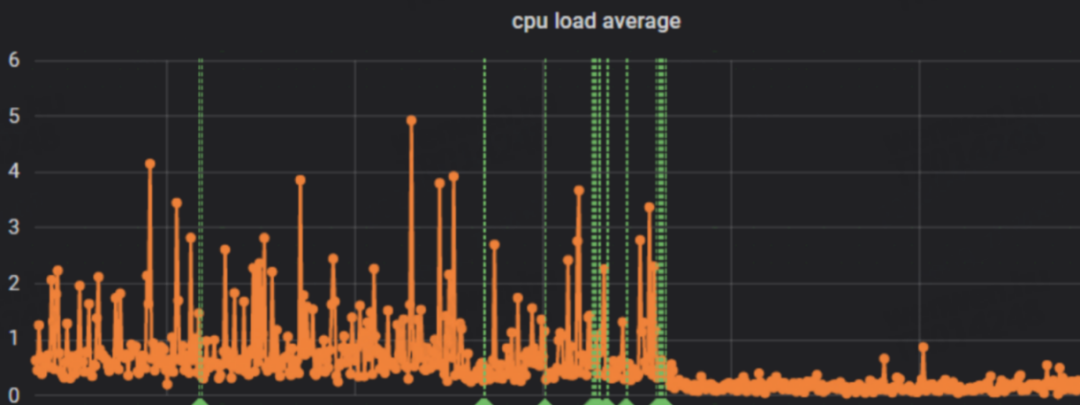
Figure 20 Effect after CPU Load optimization
3.7 Warming up during startup phase
Preheating during the startup phase can establish links in advance, reducing link establishment when traffic is received, thus reducing the occurrence of timeouts.
1) Analysis
After the application is pulled in, a large number of timeouts occur, and the CPU Load high CPU utilization is normal, indicating that there are many waiting threads. This means that there are a large number of requests waiting to be processed after the application is pulled in.
We have encountered in production before that we are waiting for Redis to establish a link. The process of link building is synchronous. The instant influx of requests just after the application pulls in will cause a large number of requests to wait for Redis to complete the link establishment.
2) Solution
During the startup phase, warm up and establish links in advance, or configure the minimum number of idle connections for Redis. Other resource preparation can also be completed through preheating during the startup phase, such as DB links, local cache loading, etc.
3.8 Optimize JIT
JIT (Just-In-Time) compilation can improve the running efficiency of the program. Grayscale access traffic compiles bytecode into local machine code to avoid impact on interface performance.
1) Introduction to JIT
JIT is the abbreviation of Just-In-Time, which means just-in-time compilation. JIT is a technology that compiles bytecode into local machine code when the program is running, which can improve the execution efficiency of the program.
In Java, a program is first compiled into bytecode and then interpreted and executed by the JVM. However, the efficiency of interpreted execution is low because the bytecode needs to be interpreted once for each execution. In order to improve the execution efficiency of the program, JIT technology was introduced into Java. JIT will compile frequently executed code blocks into local machine code when the program is running, and then execute the machine code, which can greatly improve the execution efficiency of the program.
2) Analysis
JIT technology can dynamically optimize the code based on the actual running conditions of the program, making the program perform better. However, the JIT compilation process takes a certain amount of time, so some performance bottlenecks may occur when the program first starts running.
As shown in the figure below, the JIT time is very long after the application is pulled in. It can be confirmed that JIT causes the timeout.
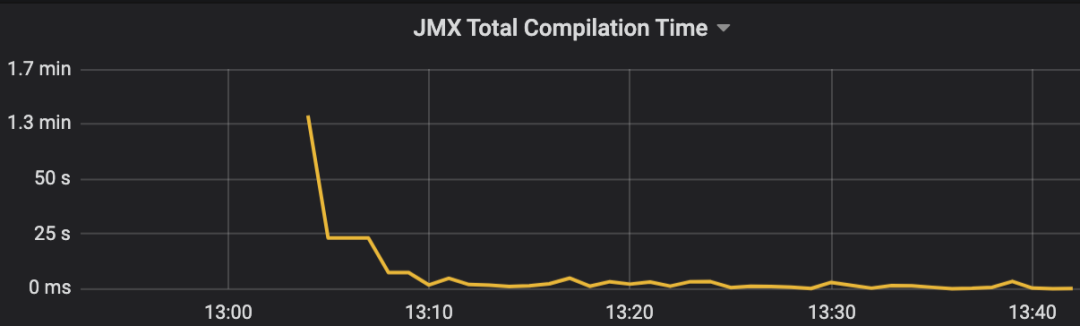
Figure 21 JIT execution time
3) Solution
A better solution to optimize JIT is to enable service preheating (the preheating function is supported by the Ctrip RPC framework).
The principle is that after the application is pulled in, it does not immediately access 100% of the traffic, but gradually increases the traffic over time, and finally receives 100% of the traffic. This will allow a small part of the traffic to compile the hot code in advance.
4) Effect
After turning on service preheating, as shown in the figure below, the application traffic gradually increases, and you can see that the response time becomes lower and lower with time, which achieves the preheating effect.
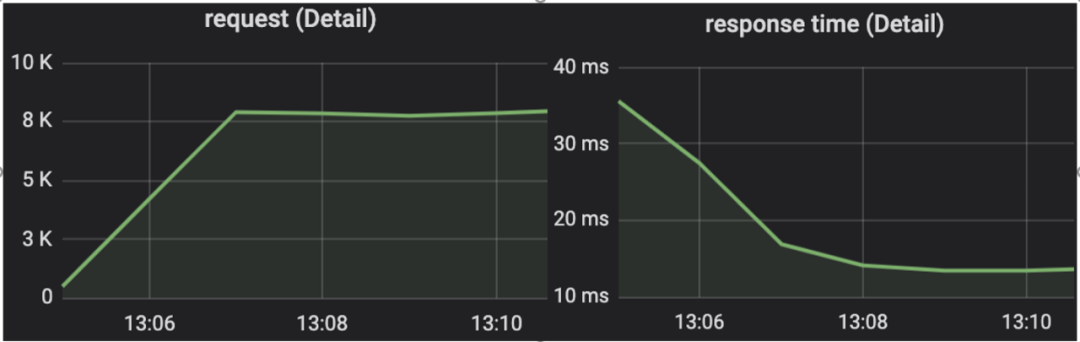
Figure 22 Request volume and response time after the service is pulled in
3.9 Change the host machine
When the host load is too high, you can consider replacing the host to avoid excessive host load affecting the container load.
1) Analysis
a. CPU Throttled indicator
Take a look at the application CPU throttling indicator. CPU throttling will cause the CPU to sleep and cause service pauses. If the CPU utilization is normal but CPU throttling occurs, this is mostly caused by host problems.
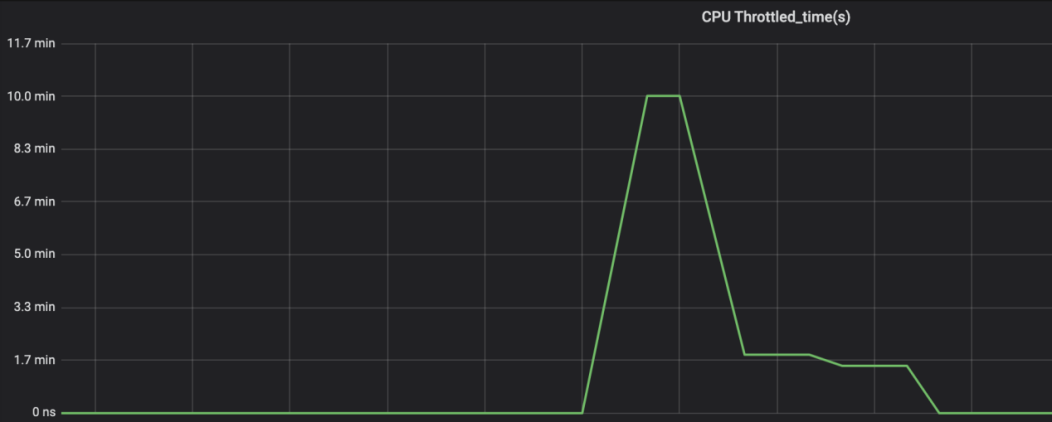
Figure 23 CPU throttling situation
b. Host indicators
Check whether the host CPU utilization, CPU Load, disk, IO and other indicators are normal. As shown in the figure below, if the CPU Load is greater than 1 after a certain time, it means that the host load is heavy.
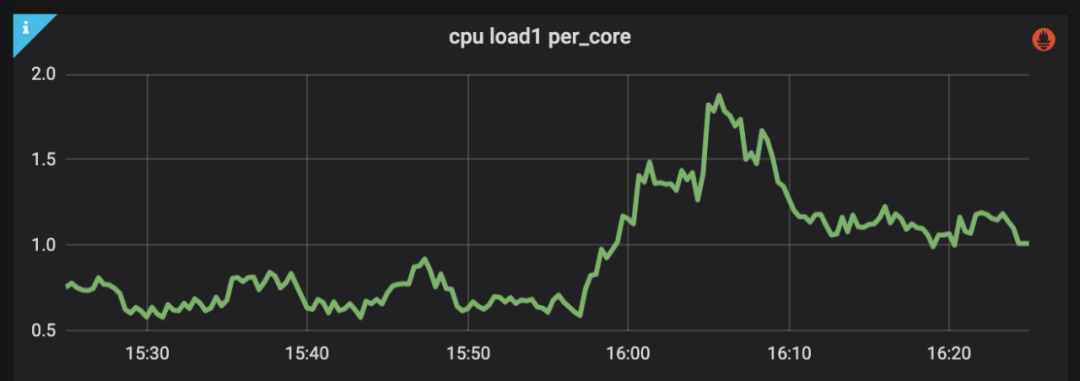
Figure 24 Host CPU Load monitoring
2) Solution
Restart the machine and change the host.
3.10 Optimize the network
Troubleshoot unstable network lines to ensure network stability.
1) Analysis
The focus of the network is to look at the TCPLostRetransmit (lost retransmission packets) indicator. For example, in the picture below, if the indicator at a certain point is abnormal, but other indicators at this point are normal, it can be initially suspected that it is caused by a network problem. The final confirmation needs to be confirmed by the network-related team.
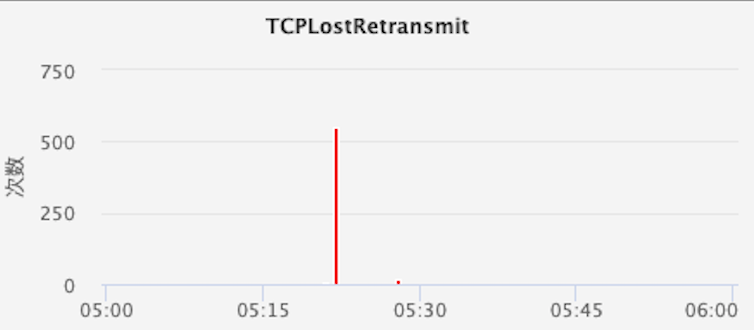
Figure 25 TCPLostRetransmit indicator
2) Solution
Find the network-related team to troubleshoot and optimize.
4. Summary
Reviewing the full text, it mainly explains how to analyze, locate and optimize timeout problems, and summarizes 10 common optimization methods from simple to complex. These methods may not necessarily solve the timeout problem in other different business scenarios. They need to be verified based on your actual business scenario.
The methods summarized in this article are all real situations we encountered in production and summarized through continuous practice. I hope that these contents can bring certain gains to the students who read this article.
4.1 Optimization considerations
Timeout settings and GC tuning need to be optimized based on your own business scenarios.
The cost and complexity of NIO's asynchronous programming transformation are high. We are also exploring simpler ways, such as the virtual threads introduced in JDK19 (similar to Go coroutines), which can use synchronous programming to achieve asynchronous effects.
[Recommended reading]
Ctrip transfer transportation solution splicing performance optimization
Average daily traffic of 20 billion, Ctrip’s high-performance fully asynchronous gateway practice
Master the Android compilation tool, Ctrip train ticket AAR compilation speed optimization practice

“Ctrip Technology” public account
Share, communicate, grow