(1) Sequence shift
Shift the sequence right:
Shift sequence left:
('移位函数sigshift构建——需先运行并保存')
function [y, n] = sigshift(x, m, k)
n = m + k;('左移将'm+k'修改为'm-k'即可')
y = x;
'原始序列'
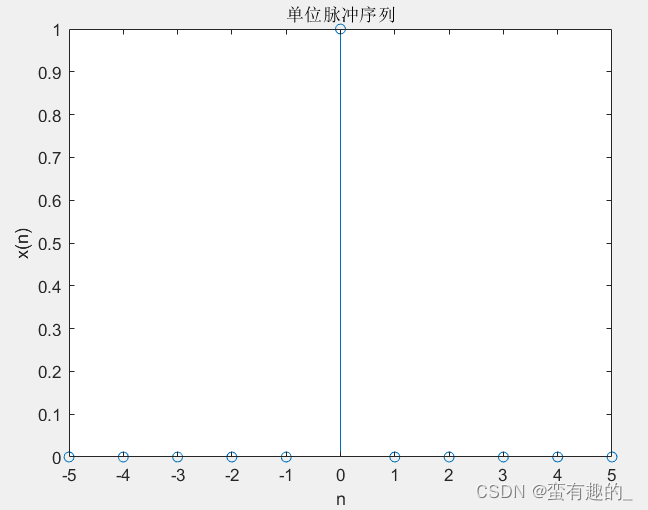
n=[-5:5];
x1=impseq(0,-5,5);
stem(n,x1);title('单位脉冲序列')
xlabel('n');ylabel('x(n)');
'调用保存的sigshift函数-右移'
[y,n]=sigshift(x1,n,4);
stem(n,y);
xlabel('n');ylabel('y(n) = x(n-4)');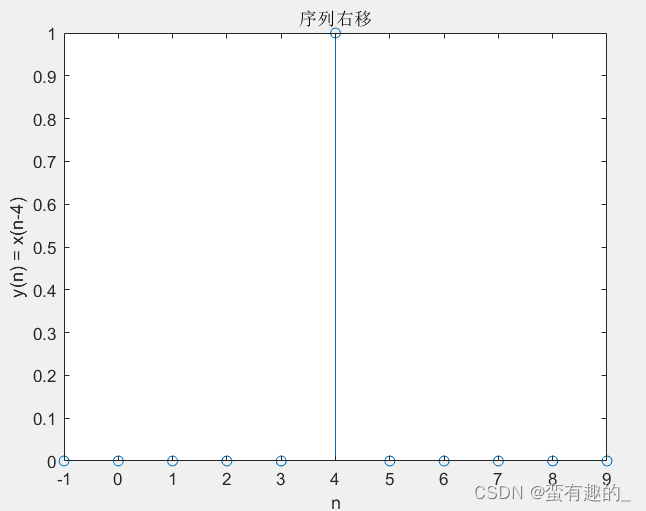

(2) Folding of sequence
Example: Use n=0 as the symmetry axis to fold the sequence
('移位函数sigfold构建——需先运行并保存')
function [y,n]=sigfold(x,n)
y=fliplr(x);
n=-fliplr(n);
'原始序列'
n=[0:10];
x3=stepseq(0,0,10)-stepseq(5,0,10);
subplot(2,2,1);stem(n,x3);title('矩形序列');
xlabel('n');ylabel('x(n)');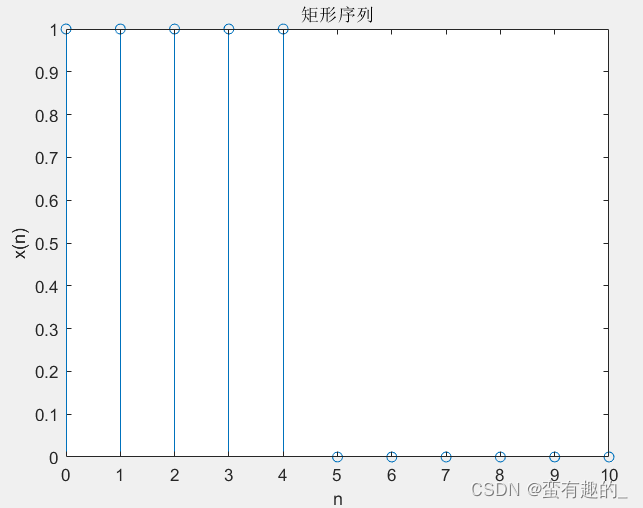
'调用sigfold函数翻褶'
n=[0:10];
x3=stepseq(0,0,10)-stepseq(5,0,10);
[y,n]=sigfold(x3,n);
stem(n,y);
title('序列翻褶')
xlabel('n');ylabel('x(-n)');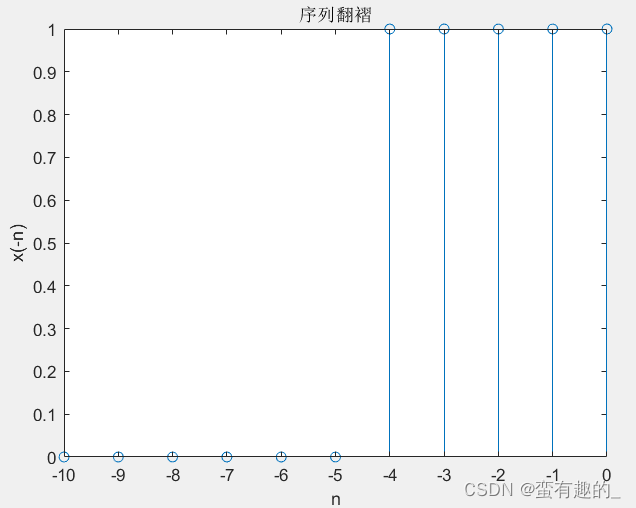
(3) Sequence summation
'加法函数'
function[f,k]=lsxj(f1,f2,k1,k2)
k=min(min(k1),min(k2)):max(max(k1),max(k2));'构造的和序列的长度'
s1=zeros(1,length(k));s2=s1;
s1(find((k>=min(k1))&(k<=max(k1))==1))=f1;'将f1中在和序列范围内但又无定义的点赋值为零'
s2(find((k>=min(k2))&(k<=max(k2))==1))=f2;'将f2中在和序列范围内但又无定义的点赋值为零'
f=s1+s2;
stem(k,f,'filled')
axis([(min(min(k1),min(k2))-1),max(max(max(k1),max(k2))+1),(min(f)-0.5),(max(f)+0.5)])
'坐标轴的显示范围'
*zeros function: initialize a new vector, the space size is related to the parameters;
*find function: Find a defined point within the sequence range and record it.
Example discrete sequences are as follows:
'示例代码'
f1=-2:2;k1=-2:2;
f2=[1 1 1];k2=-1:1;
subplot 221;
stem(k1,f1);
xlabel('n');
ylabel('h(n)');
axis([-3 3 -2.5 2.5]);
title('f1[k]');
subplot 222
stem(k2,f2)
xlabel('n');
ylabel('h(n)');
axis([-3 3 -2.5 2.5]);
title('f2[k]');
subplot 223
[f,k]=lsxj(f1,f2,k1,k2);
xlabel('n');
ylabel('h(n)');
title('f[k]=f1[k]+f2[k]');
(4) Sequence product
'乘法函数'
function[f,k]=lsxc(f1,f2,k1,k2)
k=min(min(k1),min(k2)):max(max(k1),max(k2));
s1=zeros(1,length(k));s2=s1;
s1(find((k>=min(k1))&(k<=max(k1))==1))=f1;
s2(find((k>=min(k2))&(k<=max(k2))==1))=f2;
f=s1.*s2;
stem(k,f,'filled')
axis([(min(min(k1),min(k2))-1),max(max(max(k1),max(k2))+1),(min(f)-0.5),(max(f)+0.5)])
Plot the two discrete sequence multiplications in the above example:
'示例代码'
f1=-2:2;k1=-2:2;
f2=[1 1 1];k2=-1:1;
subplot 221;
stem(k1,f1);
xlabel('n');
ylabel('h(n)');
axis([-3 3 -2.5 2.5]);
title('f1[k]');
subplot 222
stem(k2,f2)
xlabel('n');
ylabel('h(n)');
axis([-3 3 -2.5 2.5]);
title('f2[k]');
subplot 223
[f,k]=lsxc(f1,f2,k1,k2);
xlabel('n');
ylabel('h(n)');
title('f[k]=f1[k]*f2[k]');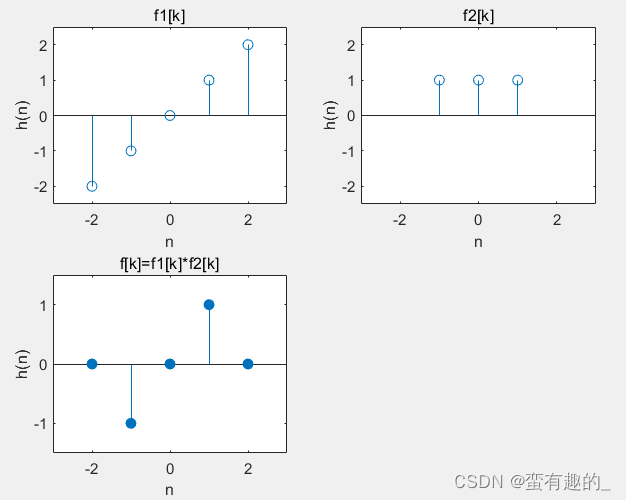
References:
Li Xin et al. "Matlab Signal Processing and Application" [M]. Beijing: Machinery Industry Press, 2022.
———————————————————————————————————————————
Only for study records~