Exercise 2.6.2 :
Use Packet Tracer to view protocol data units
Address table
This exercise does not include an address table.
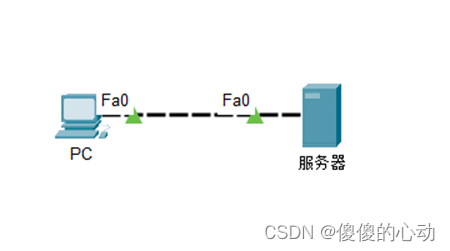
Topology
learning target
- Capture pings from PC command prompt
- Run simulation and capture communication
- Research Captured Communications
- Capture web requests using URL from PC
- Run simulation and capture communication
- Research Captured Communications
Introduction:
Wireshark can capture and display all network traffic to and from the PC on which it is hosted via network interfaces . Packet Tracer 's simulation mode can capture all network traffic flowing through the entire network, but it supports a limited number of protocols. To match the setup of Lab 2.6.2 as closely as possible , we used a network that included a PC connected directly to the web server , allowing us to capture ping traffic from the PC 's command prompt to the server , as well as web page requests using URLs .
At the beginning of this task, the completion rate should be 100% . Now that the devices have been configured, the purpose of this exercise is to study the communication flow between the devices.
Click the (Next) button to continue.
Task 1 : Capture pings issued from PC command prompt .
Step 1. Run the simulation and capture the communication.
You can switch between real-time mode and simulation mode at the remote end in the lower right corner of the PT interface. Click Simulation mode .
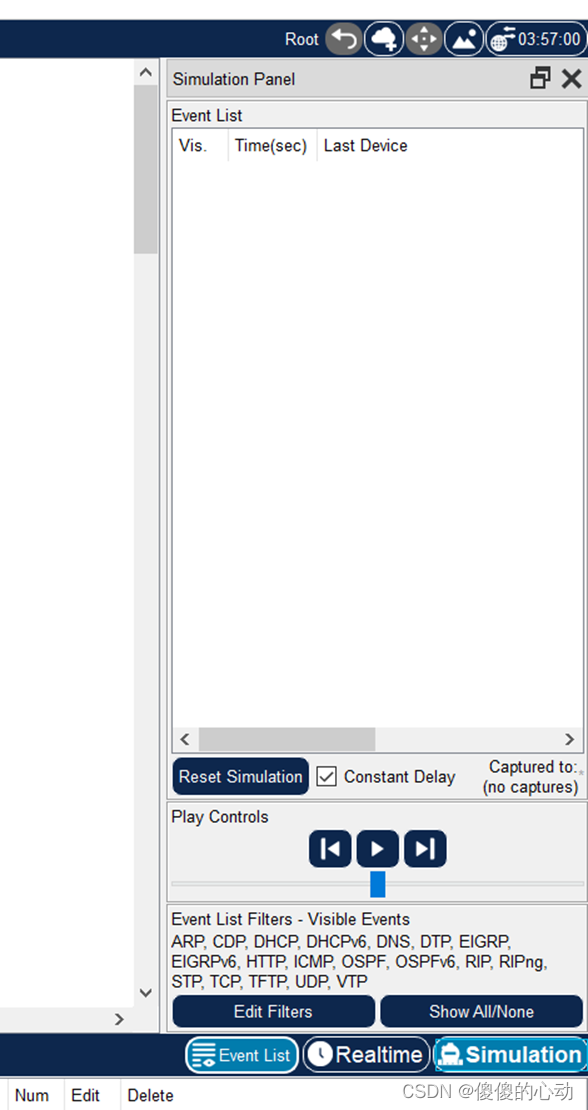
Click PC . Select the Desktop tab . Open Command Prompt . Enter the command ping 192.168.1.2 - the IP address of the server . Pressing Enter will send four ICMP echo requests. Minimize the PC configuration window. Two packets will appear in the Event List : the first ICMP echo request and the ARP request required to resolve the server IP address to its hardware MAC address . Click the Auto Capture /Play button to run the simulation and capture events. Click OK when you receive the "No More Events" message .

Step 2. Study the captured communications.
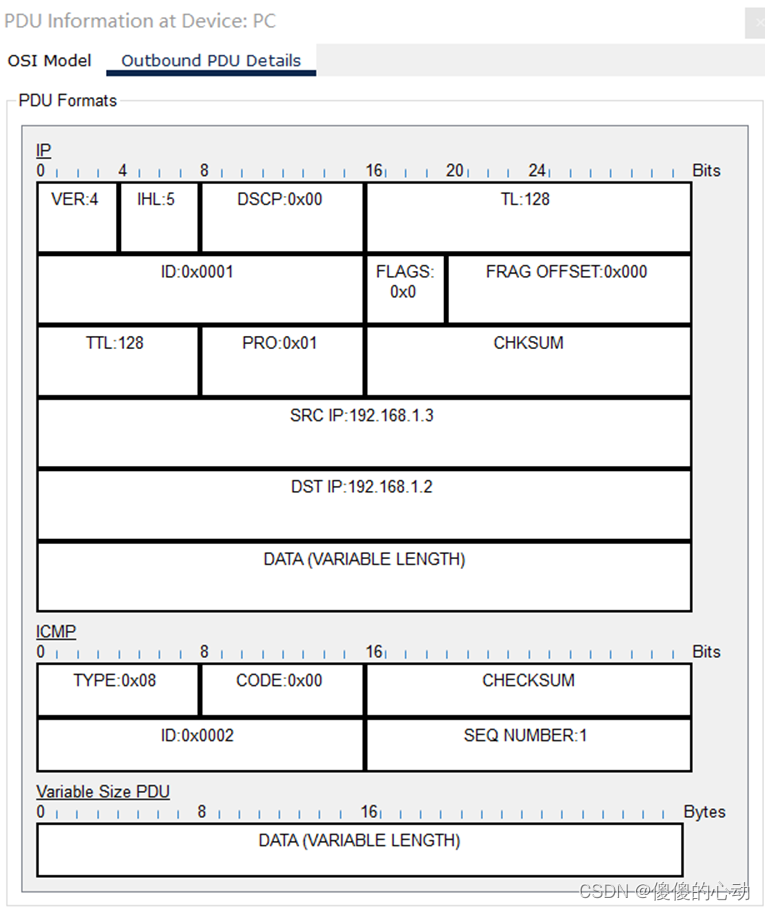
Find the first packet in the Event List and click the colored square in the Info column . When you click the Info square of a packet in the event list , the PDU Information window opens .

The OSI model will organize this window. In the first packet we look at, notice that the ICMP echo request (at layer 3 ) is encapsulated at layer 2 . If you click on each layer, the algorithm used by the device ( PC in this case) will be displayed . See what's happening on each level. When you open the PDU Information window , the OSI Model view is displayed by default. Now click the Outbound PDU Details tab. Scroll down to the bottom of this window and you will see that the ICMP echo request is encapsulated as data in an IP packet.
View the PDU information for the remaining events in the exchange.
Close the PDU information window and click the Reset Simulation button to reset the simulation.
At the end of this task, the completion rate should remain at 100% .
Click the (Next) button to continue.
Task 2 : Capture web requests using URL from PC .
Step 1. Run the simulation and capture the communication.
Click PC . Close the Command Prompt window . Open a web browser . Enter www.example.com into your browser . Clicking Go will make a web server request. Minimize the web client configuration window. A packet will appear in the Event List: the DNS request required to resolve the URL to the server's IP address .

Click the Auto Capture /Play button to run the simulation and capture events. Click OK when you receive the "No More Events" message . 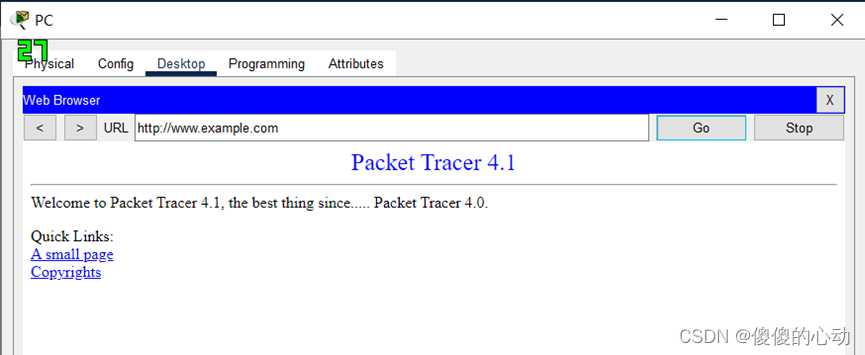
Step 2. Study the captured communications.
View PDU information for events in this exchange.
Compare Wireshark vs Packet Tracer .
At the end of this task, the completion rate should remain at 100% .
[Experimental link]
Link: https://pan.baidu.com/s/1RcLdv29t8xoNbWOu5gpILQ?pwd=2620
Extraction code: 2620
--Sharing from Baidu Netdisk Super Member V3