Machine Learning
1. How to understand machine learning
Broadly speaking, machine learning is a method that can give machine learning capabilities so that it can complete functions that cannot be completed by direct programming. But in a practical sense, machine learning is a method that uses data to train a model and then uses the model to make predictions.
-
Explicit programming: artificially informing computer input and output
-
Non-obvious programming: the computer summarizes the rules on its own
Widely adopted definition: using experience to improve the performance of a computer system itself
Since experience mainly exists in the form of data , machine learning uses machine learning technology to analyze data, which makes it gradually become one of the innovation sources of intelligent analysis technology, and has received more and more attention for this reason.
2. Understand the data set; sample (example); attribute (feature); dimension; label; sample; attribute space (sample space, input space); label space (output space); learning; hypothesis; generalization ability; independence Identical distribution; classification; regression; clustering; supervised learning; unsupervised learning; semi-supervised learning
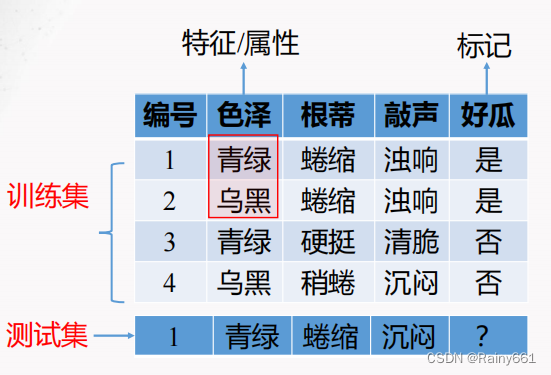
Dataset : A collection of data used for machine learning
Training: Build a model using a data set
Test: Use the model to judge new data
Example: each record in the data set
Sample : Sample with tags
Sample : one piece of data/entire data set
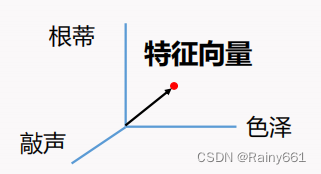
Attribute : something that reflects the performance or nature of an event or object in some aspect
Attribute/sample space : space spanned by attributes
Mark/output space : a space formed by markers
Learning tasks
◼ Prediction task: based on the value of the tag
Classification task: label values as discrete values
➢ Regression: labeled as continuous values, for example: maturity of melons
➢ Clustering: no label information, automatically grouping samples
Two categories: For example: good melon, bad melon (positive category, negative category)
Multiple categories: for example: winter melon, pumpkin, watermelon
◼ Prediction task: based on whether there is a marked value
➢ Supervised learning: all examples are labeled, such as classification, regression (learning with a tutor)
➢ Unsupervised learning: all examples are unlabeled, such as clustering (learning without a tutor)
➢ Semi-supervised learning: some examples are labeled
Generalization ability : The goal of machine learning is to make the learned model well applicable to "new samples", not just the training set. We call the ability of the model to apply to new samples as generalization ability.
NOTE: The new samples are different from the data set, but they come from the same unknown distribution with strong
A model with generalization ability can be well applied to the entire sample space. Therefore, although the training set usually
It is just a small sampling of the sample space, which can still well reflect the characteristics of the sample space.
Convenient use of probability and statistics tools
It is usually assumed that the samples in the sample space obey an unknown distribution "D ", and the samples are independently obtained from this distribution, that is, " independent and identically distributed ". Generally speaking, the more training samples, the more likely it is to obtain a model with strong generalization ability through learning.
Hypothesis space : Think of the learning process as a search process in the space composed of all hypotheses. The goal of the search is to find the hypothesis that "matches" the training set, that is, the melons in the training set can be used to judge the correct hypothesis feature attributes. The composition of all possible values
3. How to understand error, underfitting and overfitting
Error : The difference between the true output of the sample and the predicted output
Training (experience) error: the error of the learner on the training set
Test error: on the test set
Generalization error: error on new samples
Since the characteristics of the new samples are not known in advance, we can only try to minimize the empirical error;
Although in many cases it is possible to achieve zero classification error rate on the training set, in most cases
The learner is not good.
◼Overfitting _
The learner learns the training samples "too well" and regards the characteristics of the training samples themselves as the general properties of all samples, resulting in a decline in generalization performance.
⚫ 优化目标加正则项

⚫ Early stop(在测试误差最小时停止)
◼Underfitting _
The general properties of training samples have not yet been learned
⚫ 决策树:拓展分支

⚫ 神经网络:增加训练轮数
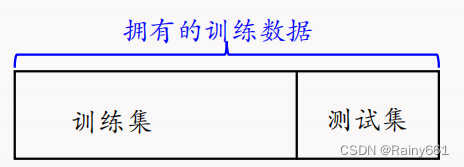
4. Understand evaluation methods: hold-out method, cross-validation method, bootstrapping method
➢ Hold-out method
⚫ Maintain data distribution consistency (for example: stratified sampling)
Two categories: 50 good melons, 50 bad melons
Training set 80: 40 good melons, 40 bad melons
Test set 20: 10 good melons, 10 bad melons
⚫ Multiple repeated divisions (for example: 100 random divisions to avoid the impact of random sample division)
⚫ The test set cannot be too large or too small. If the test set is too large, the training set will be small. The trained model will be difficult to approximate the model trained with the entire data (for example, 50 training is difficult to approximate 100 training), which is not the model that is actually used in the end. , the test set is too small, and the test results of the model are unreliable.
The empirical approach is to use 1/5 to 1/3 of the data as the test set
Problems with the hold-out method → There may be data that has not been used (the estimated results are too optimistic)
➢ Cross validation
k-fold cross-validation method : Divide the data set into k mutually exclusive subsets of similar sizes. Each time, the union of k-1 subsets is used as the training set, and the remaining subsets are used as the test set. Finally, return The mean of k test results, the most commonly used value of k is 10.
⚫ 假设数据D有100个,把它分成10份,每一份10个,9个做训练集,1个做测试集

⚫ **10折交叉验证**:100个数据分成10组,每一个数据都被使用上了,总共做了10次,平均后返回结果
◼ Similar to the hold-out method, there are also multiple division methods for dividing the data set D into k subsets. In order to reduce the differences introduced by different sample divisions, k-fold cross-validation usually randomly uses different divisions to repeat p times, and finally The evaluation result is the mean of the p k-fold cross-validation results, such as the common "10-fold 10-fold cross-validation".
Example: For the division of 10 subsets, different divisions may disturb the performance of the model, so this division is randomly done 10 times.
◼ Assume that the data set D contains m samples, and if k= m, we get the "Leave One Out (LOO)" method
⚫ 不受随机样本划分方式的影响(唯一的划分方式)

⚫ 结果往往比较准确(因为训练数据多,比如M99≈M100)

⚫ 当数据集比较大时,计算开销难以承受(训练集包括百万样本)
➢ Self-help method (bootstrap)
Based on "bootstrap sampling", also known as "sampling with replacement" and "repeatable sampling"
Defect : The training set is the same size as the original sample set, but the data distribution has changed.
When the data set is small and it is not important to change the data distribution a little → bootstrapping is good
When the data set is sufficient → the hold-out method and cross-validation method are good
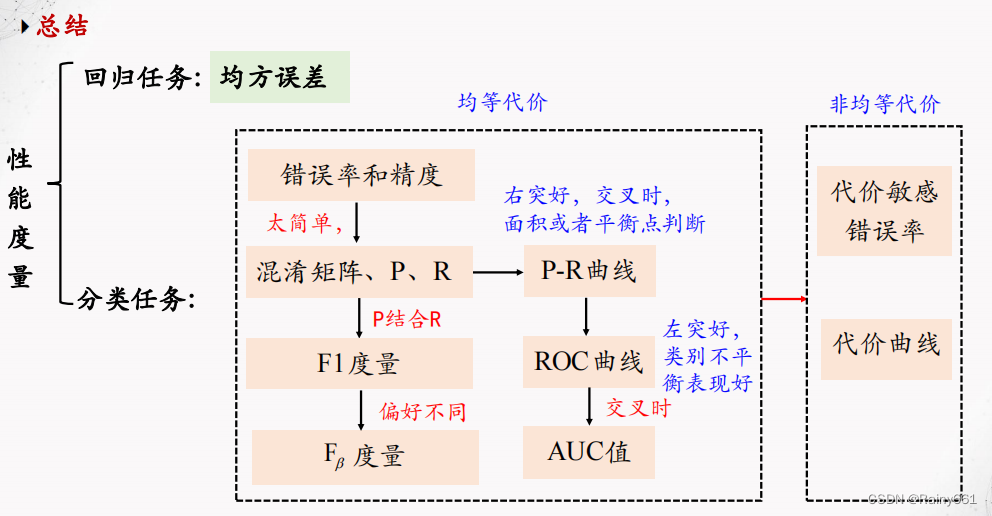
5. Understand error rate, confusion matrix, accuracy, precision rate, recall rate, F1, PR curve
Classification tasks
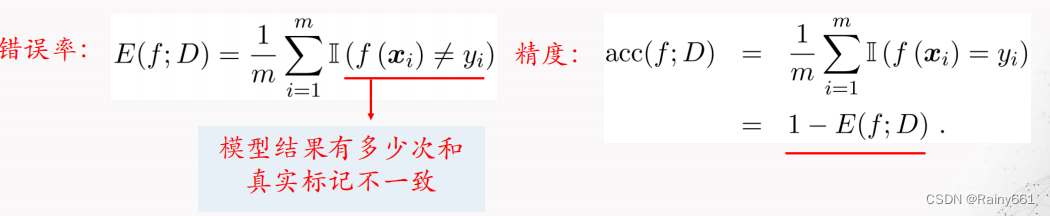
For classification tasks, error rate and precision are the two most commonly used performance measures:
⚫Error rate (Error ): the proportion of incorrectly classified samples to the total number of samples
⚫Accuracy : the ratio of correctly classified samples to the total number of samples
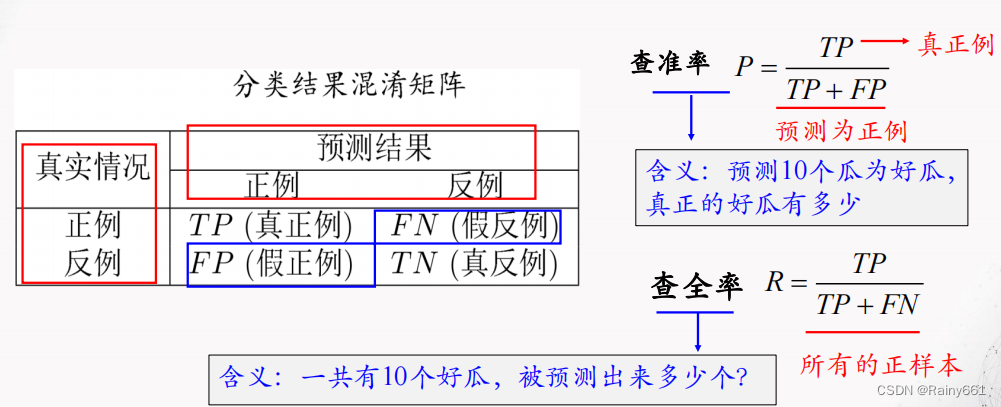
◼ Precision rate and recall rate
In scenarios such as information retrieval and web search, it is often necessary to measure the correct rate of predicted positive examples or the rate of predicted positive examples . At this time, precision and recall are more important than error rate and accuracy . Suitable
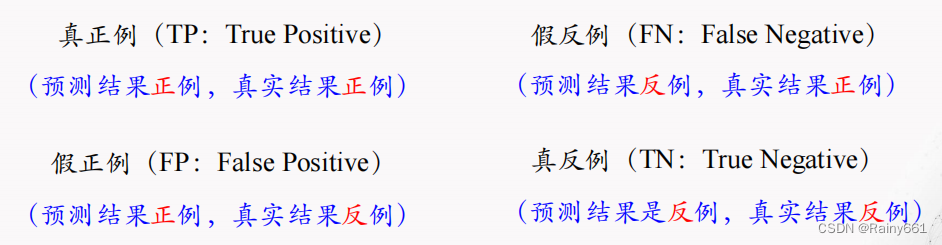
Statistics of the combination of real labels and predicted results can result in a " confusion matrix"
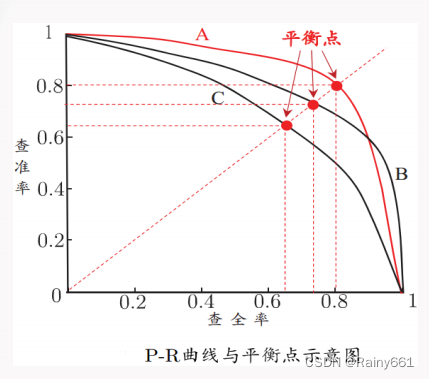
Precision-recall curve (PR curve)
According to the prediction results of the learner, the samples are sorted according to the likelihood of positive examples , and the samples are sorted one by one
As a positive example for prediction, you can get the precision-recall curve, referred to as the "PR curve"
(Precision-Recall Curve)”。
➢ When a curve is completely enclosed by another curve, then
The performance of the latter is better than that of the former, for example, A is better than C
➢ When the curves cross
⚫ Judging based on the area under the curve, curves with larger areas are better
curve with small area
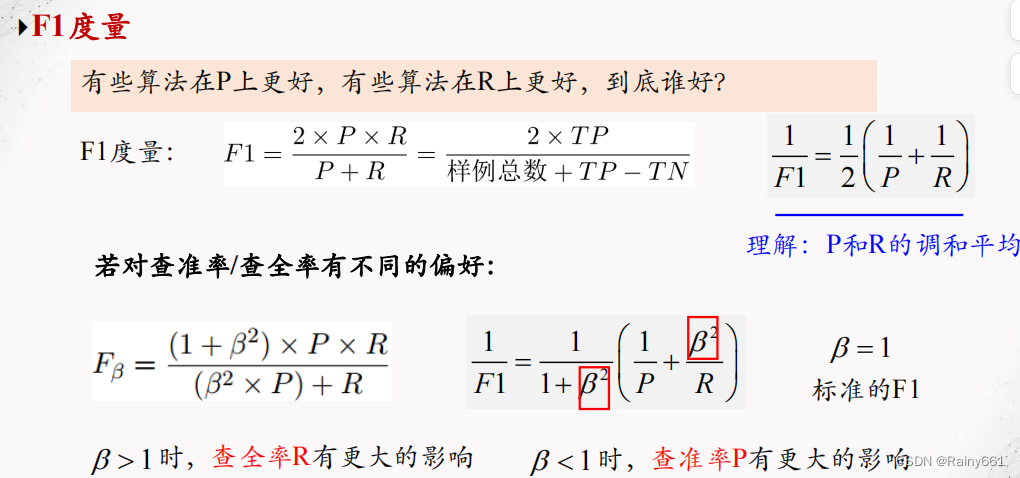
⚫ Based on the balance point judgment, the point where the precision rate and recall rate are equal, A is better than B, and the F1 measure is commonly used (the higher the value of the balance point, the better the performance)
6. How to understand log odds regression
Odds: reflects the relative likelihood of a sample being a positive example
Use the prediction results of the linear regression model to approximate the log probability of the real label: log probability regression, referred to as log probability regression.
Advantages of log odds regression
⚫ 无需事先假设数据分布

⚫ 可得到“类别”的近似概率预测

⚫ 可直接应用现有数值优化算法求取最优解
7. Understand the two methods of decision tree pruning
◼ Pruning: In order to classify training samples as accurately as possible, it may cause too many branches and cause overfitting.
The risk of overfitting can be reduced by proactively removing some branches.
◼ Basic strategy:
⚫Pre -pruning : During the decision tree generation process, each node is estimated before division. If the division of the current node cannot improve the generalization performance of the decision tree, the division will be stopped and the current node will be recorded as a leaf. The category of a node is marked as the category with the largest number of training examples, that is, the growth of certain branches is terminated early.
◼ 优点

    降低过拟合风险

    显著减少训练时间和测试时间开销

◼ 缺点

    欠拟合风险:有些分支的当前划分虽然不能提升泛化性能, 但在其
Subsequent partitioning on the basis may lead to significant performance improvements. Pre-pruning is based on "greedy"
Essentially prohibiting the expansion of these branches, bringing the risk of under-fitting
⚫Post -pruning : First generate a complete decision tree from the training set, and then examine the non-leaf nodes from the bottom up. If the subtree corresponding to the node is replaced with a leaf node, the decision tree can be generalized. If the optimization performance is improved, replace the subtree with a leaf node to generate a complete tree, and then "turn back" to prune.
◼ 优点

    后剪枝比预剪枝保留了更多的分支,欠拟合风险小,泛化性能往往
Better than pre-pruned decision trees
◼ 缺点

    训练时间开销大:后剪枝过程是在生成完全决策树之后进行的,需要
Examine all non-leaf nodes one by one from bottom to top
Pre-pruning vs post-pruning
◼ 时间开销

    预剪枝:测试时间开销降低(分支少了),训练时间开销降低(分支少了)

    后剪枝:测试时间开销降低(分支少了),训练时间开销增加(完整的树)

◼ 过拟合/欠拟合风险:

    预剪枝:过拟合风险降低,欠拟合风险增加(“贪心”)

    后剪枝:过拟合风险降低,欠拟合风险基本不变

    预剪枝欠拟合风险增加 :因为有些分支当前划分虽不能提升泛化性能、甚至可能导致泛化性能暂时下降,但在其基础上进行的后续划分却有可能导致性能显著提高(如长征,战略性撤退,然后柳暗花明又一村)

    **泛化性能:后剪枝通常优于预剪枝**
8. Understand neuron models, gradient descent strategies, and learning rates
Definition of neural network
“A neural network is an extensively parallel interconnected network of adaptable simple units , organized to simulate the responses of biological nervous systems to real-world objects.”
[Kohonen, 1988]
⚫ Neural network in machine learning usually refers to “ neural network learning ” or machine learning and neural network
The intersection of the two disciplines of network
⚫ The neuron model, the “simple unit” in the above definition, is the basic component of the neural network
⚫ Biological neural network: Each neuron is connected to other neurons. When it is "excited", it sends chemicals to the connected neural cloud, thereby changing the potential within these neurons; if the potential of a neuron exceeds one " threshold ", then it will be activated, that is, "excited" and send chemicals to other neurons
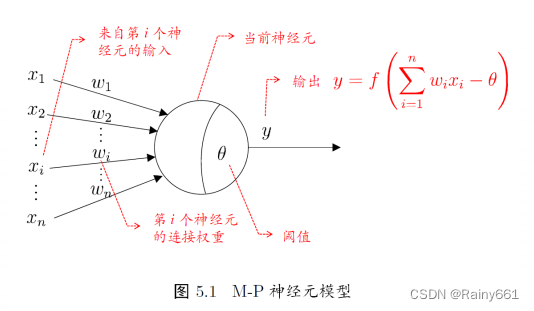
MP neuron model [McCulloch and Pitts, 1943]
⚫ 输入:来自其他n 个神经云传递过来的输入信号

⚫ 处理:输入信号通过带权重的连接进行传递, 神经元接受到总输入值将与神经元的阈值进行比较

⚫ 输出:通过激活函数的处理以得到输出
➢Neuron activation rules (model)
➢Mainly refers to the mapping relationship between neuron input and output. Generally
is a nonlinear function.
➢Network topology (model)
➢The connection relationship between different neurons.
➢Learning algorithm (optimization algorithm)
➢Learn the parameters of the neural network through training data.
Common activation functions
➢Sigmoid function
➢ReLU function (Rectified Linear Unit, corrected linear unit)
9. Understand the basic ideas of support vector machines, soft margins and hard margins
Support Vector Machine SVM (Support Vector Machine)
Vapnik proposed it in 1992 to solve the two-classification problem, and it is still widely used successfully today.
Introduction: SVM not only has a solid theoretical foundation in statistics, but can also be well applied to high-dimensional data and avoid the disaster of dimensionality problem. It has become a machine learning classification technology that has attracted much attention.
The core idea of SVM : Maximize the distance between the two categories -> Maximum edge hyperplane
◼ The optimal classification straight line found by the support vector machine should satisfy
⚫ The line separates two categories;
⚫ The straight line maximizes separation;
⚫ The straight line is in the middle of the interval and equidistant from all support vectors;
Note: The above discussion is based on the results of two-dimensional feature space. In high-dimensional space, the straight line will become a hyperplane, but the above conclusion is consistent.
Soft interval :
◼ It was previously assumed that the training samples are linearly separable in the feature space. In reality, it is difficult to determine the appropriate kernel function to make the training samples linearly separable in the feature space;
◼ At the same time, it is difficult to determine whether a linearly separable result is caused by overfitting.
◼ Mitigation method: Introduce the concept of " soft margin " to allow the support vector machine to not satisfy the constraints on some samples.
Basic idea: While maximizing the interval, there should be as few samples as possible that do not satisfy the constraints.
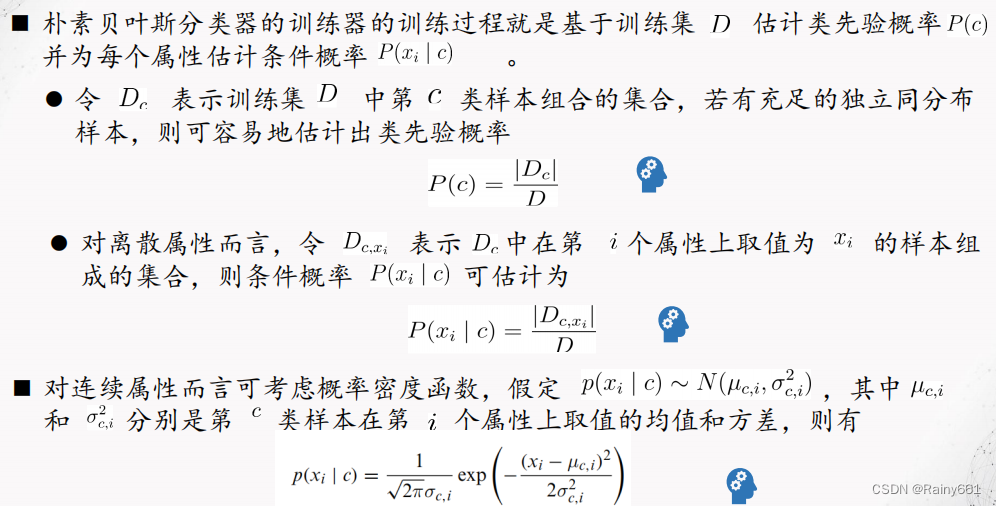
10. Naive Bayes classifier method

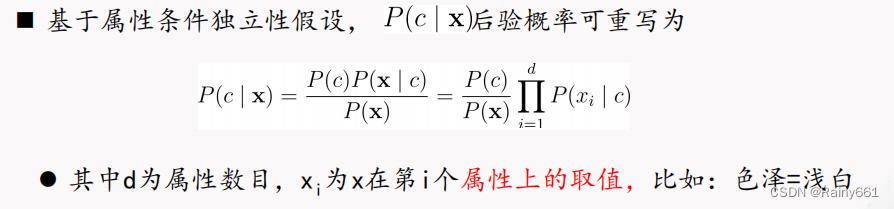
◼ Main problem: The class conditional probability P(x|c) is the joint probability of all attributes, which is difficult to estimate from limited training samples. (combinatorial explosion, sparse samples)
◼ The Naive Bayes Classifier adopts the "attribute conditional independence assumption": each attribute independently affects the classification result.
In order to prevent the information carried by other attributes from being "erased" by attribute values that do not appear in the training set, "Laplacian correction" is usually performed when estimating probability values.
◼ Obviously, Laplace correction avoids the problem of zero probability estimate due to insufficient training set samples, and when the training set becomes larger, the influence of the prior introduced by the correction process will gradually become negligible. Make the valuation gradually tend to the actual probability value
◼ In real tasks, the use of Naive Bayes classifier: high speed requirements, "look-up table"; frequent task data replacement, "lazy learning" (lazy learning); continuous increase of data, incremental learning, etc.
◼ Question: Since Naive Bayes is so simple, the attribute condition independence assumption it requires should be difficult to establish in practical applications. What will be its classification performance?
A systematic theoretical analysis of the classification performance of the Naive Bayes classifier is needed.
11. Understand the idea of ensemble learning
Ensemble Learning improves performance by building and combining multiple learners
➢Integrated individuals should be: Good but different
➢Accuracy and diversity/difference
➢According to the generation method of individual learners, ensemble learning can be roughly divided into two categories
: Serialization method: There is a strong dependency between learners. Boosting
Parallelization method: There is no strong dependency between learners. Bagging, Random Forest RF
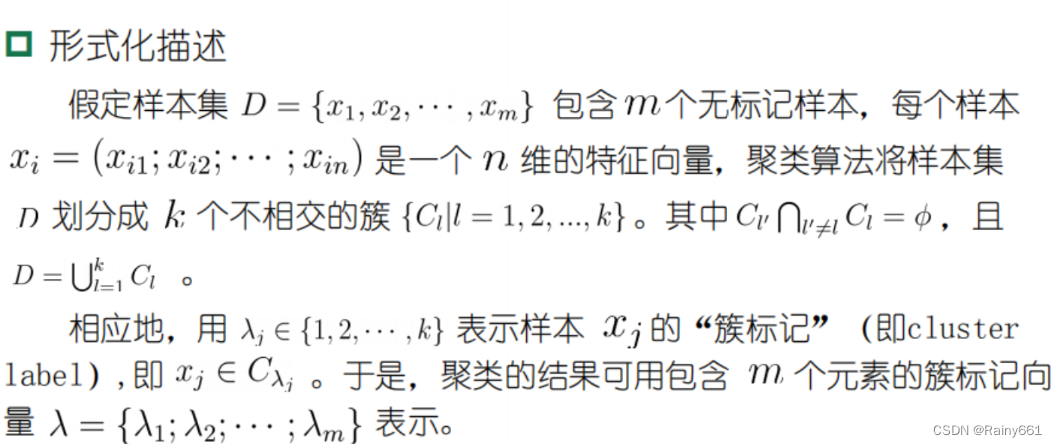
12. Understand clustering tasks, Minkowski distance, K-means algorithm
Clustering task
-
The most studied and widely used in "unsupervised learning" tasks.
-
Clustering goal: divide the samples in the data set into several disjoint subsets ("clusters").
-
Clustering can be used as a separate process (used to find the inherent distribution structure of data), or as a precursor process for other learning tasks such as classification.
- Commonly used distances:
Minkowski distance:
It is not a distance, but a definition of a set of distances. It is a general expression of multiple distance measurement formulas.
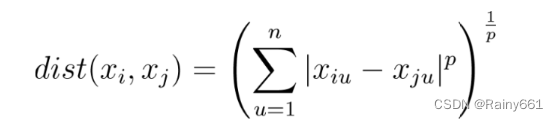
p=2: Euclidean distance
p=1: Manhattan distance
K-means method (K-means) uses an unlabeled data set and then clusters the data into different groups. The K-means algorithm has an iterative process in which the data set is grouped into several predefined non-overlapping clusters or subgroups to make the internal points of the clusters as similar as possible while trying to keep the clusters in different spaces , which assigns data points to clusters such that the sum of squared distances between the cluster's centroid and the data points is minimal , where the cluster's centroid is the arithmetic mean of the data points in the cluster.
- K-means algorithm process
1. Select K points as the initial centroid.
2. Assign each point to the nearest centroid to form K clusters.
3. For the clustering results of the previous step, perform an average calculation to obtain the new cluster center of the cluster.
4. Repeat the above two steps/until the end of the iteration: the center of mass does not change.
Advantages of K-means
⚫原理比较简单,实现也是很容易,收敛速度快。

⚫聚类效果较优。

⚫算法的可解释度比较强。

⚫主要需要调参的参数仅仅是簇数K。
Disadvantages of K-means
-
The number of clusters needs to be specified in advance; if
-
If there are two highly overlapping data, then it cannot be distinguished, and it cannot be judged that there are two clusters;
-
Euclidean distance can have unequal weighting factors, limiting the types of data variables that can be processed;
-
Sometimes randomly selecting centroids doesn't give you the desired results;
-
Unable to handle outliers and noisy data;
-
Not suitable for non-linear data sets;
-
Sensitive to feature scale;
-
If you encounter a very large data set, the computer may crash.
13. Understand the KNN algorithm and the idea of dimensionality reduction
k-NearestNeighbor (kNN) learning is a commonly used supervised learning method:
⚫确定训练样本,以及某种距离度量。
⚫对于某个给定的测试样本,找到训练集中距离最近的k个样本,对于**分类问题**使用“投票法”获得预测结果,对于**回归问题**使用“平均法”获得预测结果。还可基于距离远近进行加权平均或加权投票,距离越近的样本权重越大。
    ⚫投票法:选择这k个样本中出现最多的类别标记作为预测结果。
    ⚫平均法:将这k个样本的实值输出标记的平均值作为预测结果。
k in the k-nearest neighbor classifier is an important parameter. When k takes different values, the classification results will be significantly different. On the other hand, if different distance calculation methods are used, the "nearest neighbors" found may be significantly different, which will also lead to significantly different classification results.
The so-called dimensionality reduction
That is, "condensing" high-dimensional data into low-dimensional data
but retain its main information as much as possible
Making the model more efficient but minimizing the impact on accuracy
is essentially an optimization problem
14. Compare several methods of feature selection: filter selection, wrapped selection, embedded selection and L1 regularization
Common feature selection methods are roughly divided into the following three categories:
Filtering type : first perform feature selection on the data, and then train the learner. The feature selection process has nothing to do with the subsequent learner
Wrapping type : directly use the learner to be used as a feature Evaluation criteria for subsets
优点:从最终学习器的性能来看,包裹式比过滤式更好;
缺点:由于特征选择过程中需要多次训练学习器,因此包裹式特征选择的计算开销通常比过滤式特征选择要大得多。
Embedded : Integrate feature selection and learner training processes, and both are completed in the same optimization process
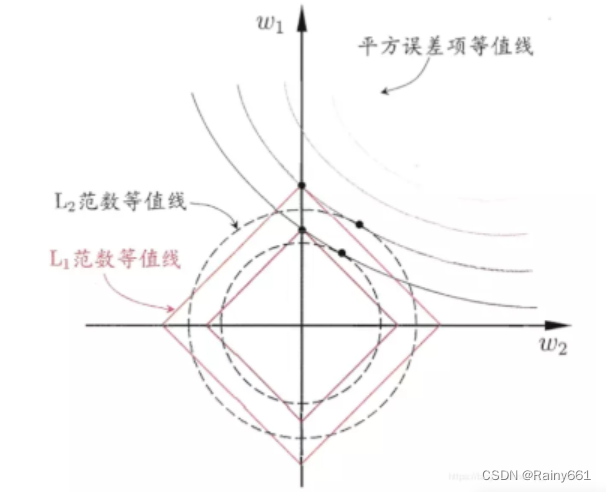
嵌入式选择最常用的是L 1正则化和L 2 正则化
L 1 regularization: the regularization contour and the square error contour intersect on the coordinate axis;
L 2 regularization: the regularization contour and the square error contour intersect in a certain quadrant;
then L 1 is larger than L 2 It is easier to obtain sparse solutions.
**正则化(Regularization)**
    正则化是结构风险(损失函数+正则化项)最小化策略的体现,是在经验风险(平均损失函数)上加一个正则化项。正则化的作用就是选择经验风险和模型复杂度同时较小的模型。

    防止过拟合的原理:正则化项一般是模型复杂度的单调递增函数,而经验风险负责最小化误差,使模型偏差尽可能小经验风险越小,模型越复杂,正则化项的值越大。要使正则化项也很小,那么模型复杂程度受到限制,因此就能有效地防止过拟合。
The larger the regularization term, the simpler the model and the smaller the coefficient. When the regularization term increases to a certain extent, all feature coefficients will tend to 0. In this process, the coefficients of some features will become 0 first. This also implements the feature selection process.
Logistic regression, linear regression, and decision trees can all be used as base learners for regularized feature selection. Only algorithms that can obtain feature coefficients or feature importance can be used as base learners for embedded selection.
The L1 regularization problem can be solved using proximal [ˈprɒksɪməl] Gradient Descent (PGD) [Boyd and Vandenberghe, 2004]
Main unsupervised learning methods
✓Clustering
✓How to divide the students in the classroom into 5 categories according to hobbies and height?
✓Dimensionality Reduction
✓How to map data points in the original high-dimensional space to a low-dimensional space?
✓Association Rules
✓Many male customers who buy diapers also buy beer. What rules can be found to increase supermarket sales?
✓Recommender systems
✓Many customers often shop online. Based on their browsing habits, what products should be recommended to them?