Introduction:
We all know that when there is relatively little data, we can easily obtain the information in the data. But when the data is relatively large, it is difficult for us to see it. Especially in the face of tens of thousands of data today, this is even more important.
Fortunately, we can use computers to help us analyze, and one of the more efficient methods is data visualization. By visualizing data, we can let the data speak. This will help us analyze the data and allow us to understand the data more quickly.
review:
Continuing from the previous chapter, we previously wrote a crawler to obtain Weibo comments. The obtained data is as follows:
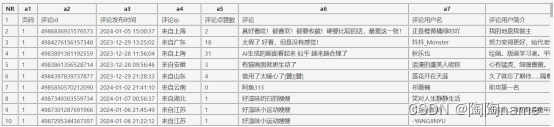
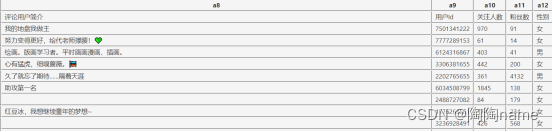
It can be seen that the above data is actually difficult to see the patterns with the naked eye. At the same time, these data are also very unintuitive. Then we can visualize this data through data visualization.
The following is the effect of using pyecharts to visualize the data we crawled.
The first one is about the fan data of users with more fans in the comment data.
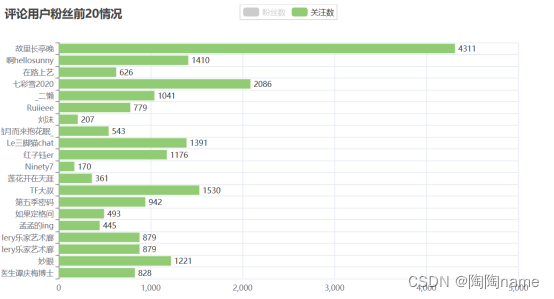
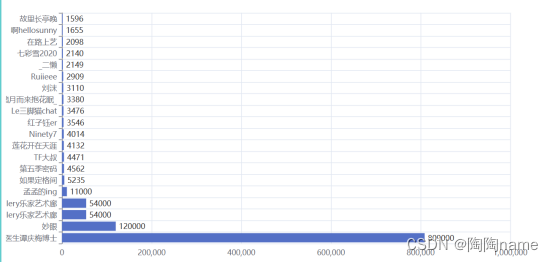
The second one is about the attention data of users with more fans in the comment data.
The next step is to visualize the address where the comments are published. From the figure, we can test Wherever you go, more people will read comments. You can watch the video below for specific effects.
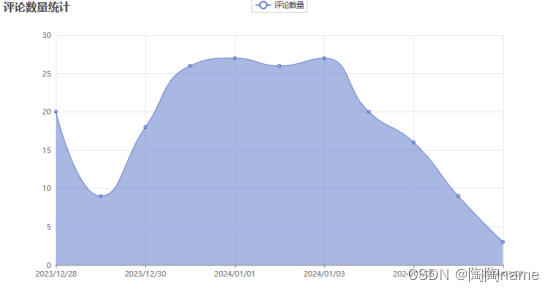
Furthermore, time statistics are used to see which time has the most comments posted.
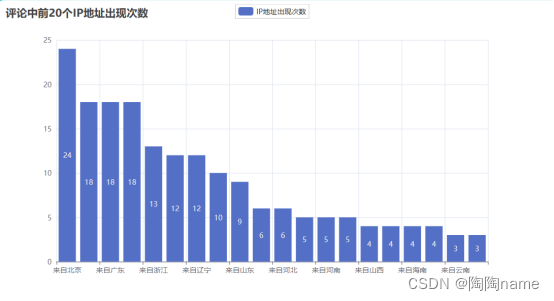
The following table shows the number of occurrences of the top 20 IP addresses in all comments. As you can see from here, Beijing has the most comment users in this Weibo comment.
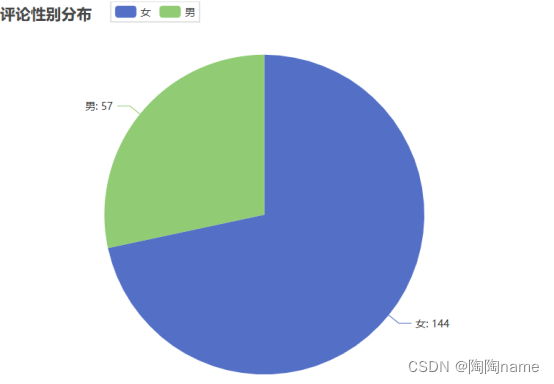
We can also make statistics on the gender of the commenters. The following is the gender distribution of the Weibo comments. The
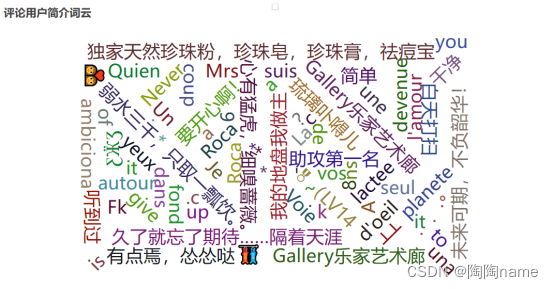
last one is the profile data visualization of the users in the comments. , that is to say, the personalized signature of the user who posted the comment on this Weibo, and then perform a word cloud display on these signature data.
Comment data visualization video introduction:
Practical crawler combat-Visualization of Weibo comments
The above is all the content shared this time.
Due to the author's limited ability, there may be inaccuracies in the formulation of the question, so please bear with me! ! !
Complete source code: Practical crawler combat - Weibo comment data visualization