
Background introduction
In a recent business system, the slave database has been in a delayed state and cannot catch up with the master database, resulting in greater business risks. From a resource perspective, the CPU, IO, and network usage of the slave library are low, and there is no situation where playback is slowed down by excessive server pressure. Parallel playback is enabled on the slave library. Executing show processlist on the slave library shows that there are no playback threads. Blocking, playback continues; parsing the relay-log log file, it is found that there is no large transaction playback.
process analysis
Phenomenon confirmation
I received feedback from my operation and maintenance colleagues that one set of slave libraries was very delayed. I provided show slave statusscreenshot information of the delay.
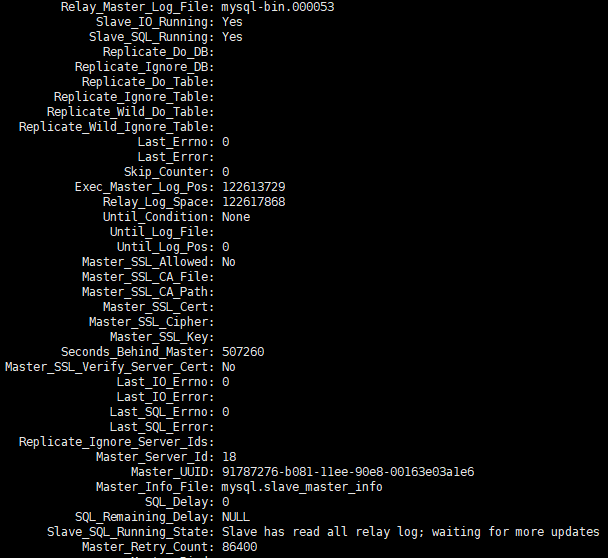
After continuing to observe show slave statusthe changes for a while, I found that the POS point information was constantly changing, Seconds_Behind_master was also constantly changing, and the overall trend continued to grow.
Resource usage
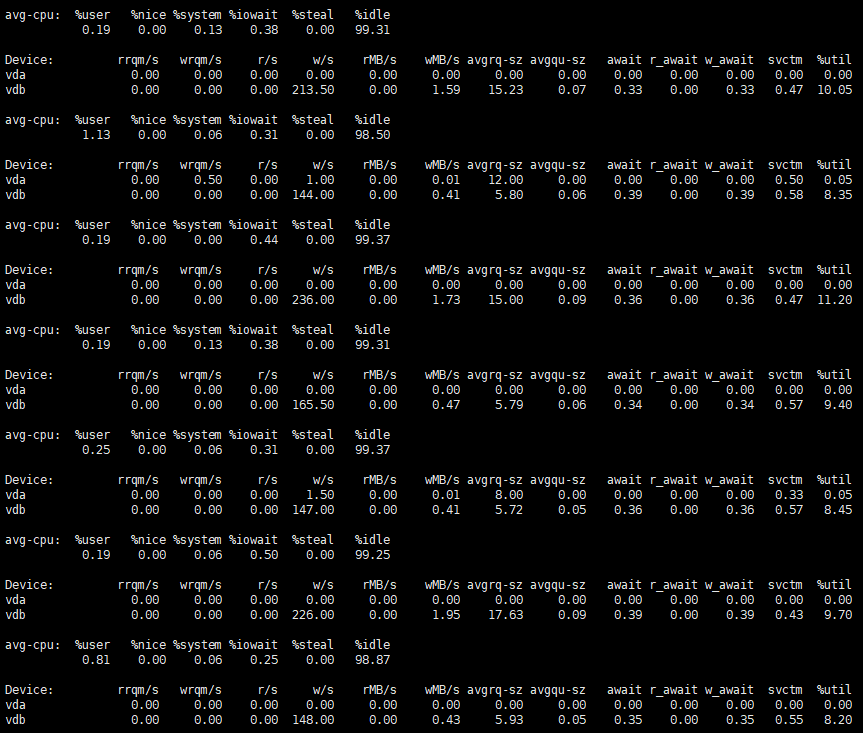
After observing the server resource usage, we can see that the usage is very low.
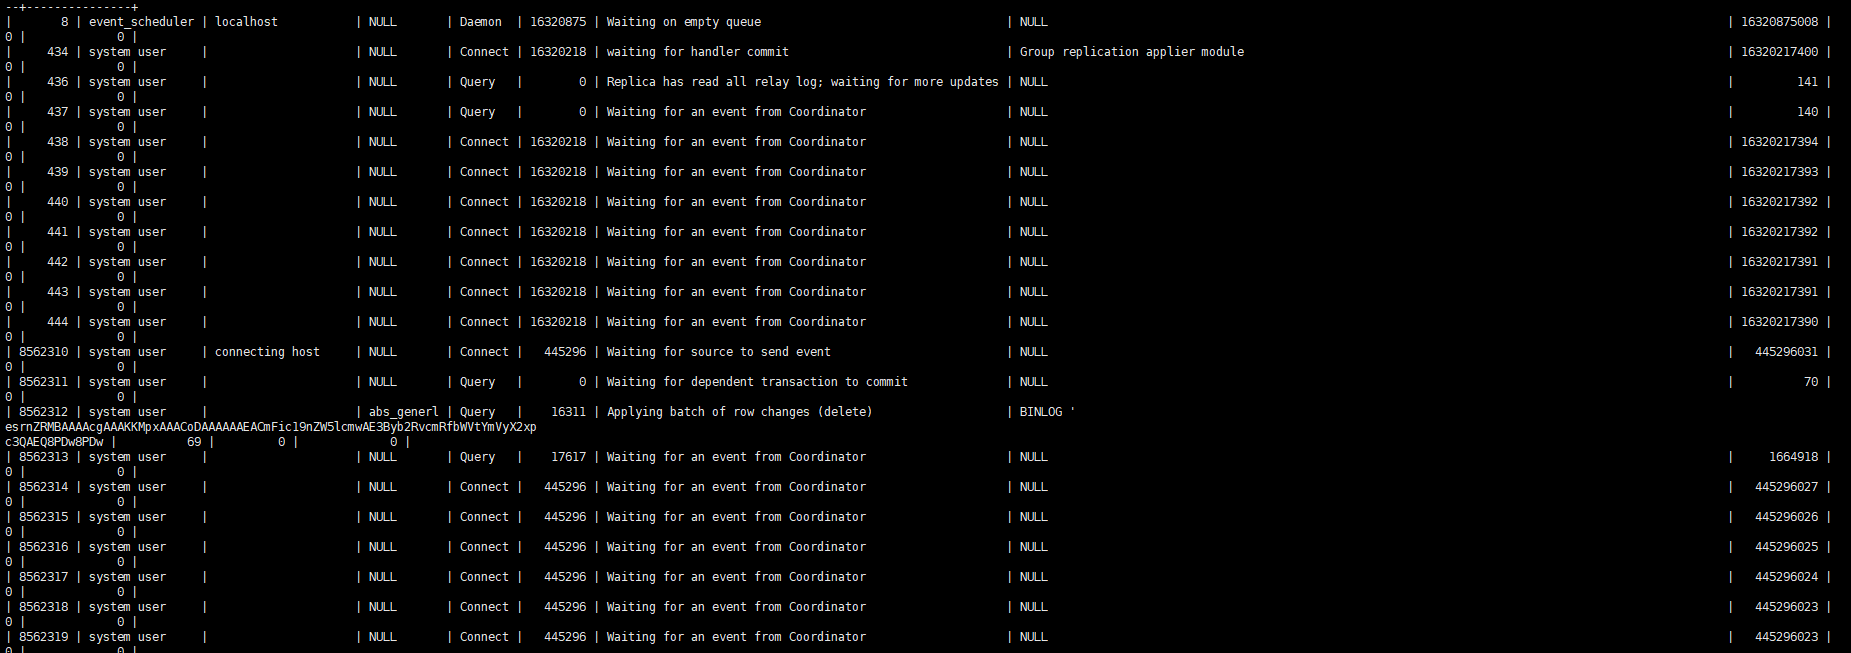
Observing the slave process, you can basically only see one thread playing back the work.
Parallel playback parameter description
Set in the main librarybinlog_transaction_dependency_tracking=WRITESET
In the slave library, slave_parallel_type=LOGICAL_CLOCKthe andslave_parallel_workers=64
error log comparison
Get the parallel playback log from the error log for analysis
$ grep 010559 100werror3306.log | tail -n 3
2024-01-31T14:07:50.172007+08:00 6806 [Note] [MY-010559] [Repl] Multi-threaded slave statistics for channel 'cluster': seconds elapsed = 120; events assigned = 3318582273; worker queues filled over overrun level = 207029; waite
d due a Worker queue full = 238; waited due the total size = 0; waited at clock conflicts = 348754579743300 waited (count) when Workers occupied = 34529247 waited when Workers occupied = 76847369713200

2024-01-31T14:09:50.078829+08:00 6806 [Note] [MY-010559] [Repl] Multi-threaded slave statistics for channel 'cluster': seconds elapsed = 120; events assigned = 3319256065; worker queues filled over overrun level = 207029; waite
d due a Worker queue full = 238; waited due the total size = 0; waited at clock conflicts = 348851330164000 waited (count) when Workers occupied = 34535857 waited when Workers occupied = 76866419841900

2024-01-31T14:11:50.060510+08:00 6806 [Note] [MY-010559] [Repl] Multi-threaded slave statistics for channel 'cluster': seconds elapsed = 120; events assigned = 3319894017; worker queues filled over overrun level = 207029; waite
d due a Worker queue full = 238; waited due the total size = 0; waited at clock conflicts = 348943740455400 waited (count) when Workers occupied = 34542790 waited when Workers occupied = 76890229805500
For a detailed explanation of the above information, please refer to MTS Performance Monitoring How Much Do You Know?
Removed the statistics that occurred less often and showed the comparison of some key data.
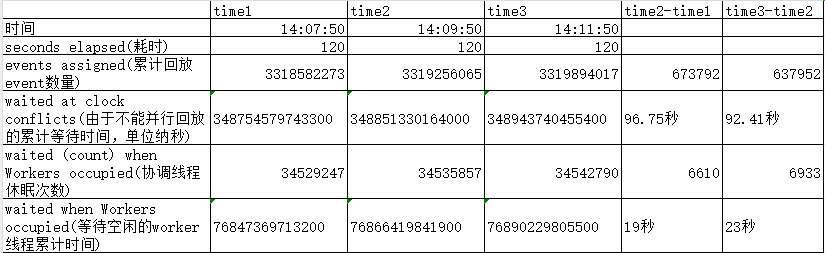
It can be found that at the natural time of 120, the playback coordination thread waits for more than 90 seconds because it cannot play in parallel, and nearly 20 seconds because there are no idle work threads to wait. This translates into only about 10 seconds for the coordination thread to work.
Parallelism Statistics
As we all know, mysql parallel playback from the library mainly relies on the last_committed in the binlog to make judgments. If the last_committed of the transaction is the same, it can basically be considered that these transactions can be played back in parallel. Below is the approximate statistics of obtaining a relay log from the environment for parallel playback.
$ mysqlsqlbinlog --no-defaults 046638 |grep -o 'last_committed.*' | sed 's/=/ /g' | awk '{print $2}' |sort -n | uniq -c |awk 'BEGIN {print "last_commited group_count Percentage"} {count[$2]=$1
; sum+=$1} END {for (i in count) printf "%d %d %.2f%%\n", i, count[i], (count[i]/sum)*100|"sort -k 1,1n"}' | awk '{if($2>=1 && $2 <11){sum+=$2}} END {print sum}'
235703
$ mysqlsqlbinlog --no-defaults 046638 |grep -o 'last_committed.*' | sed 's/=/ /g' | awk '{print $2}' |sort -n | uniq -c |awk 'BEGIN {print "last_commited group_count Percentage"} {count[$2]=$1
; sum+=$1} END {for (i in count) printf "%d %d %.2f%%\n", i, count[i], (count[i]/sum)*100|"sort -k 1,1n"}' | awk '{if($2>10){sum+=$2}} END {print sum}'
314694
The first command above counts the number of transactions with the same last_committed between 1 and 10, that is, the degree of parallel playback is low or cannot be played back in parallel. The total number of these transactions is 235703, accounting for 43%. Detailed analysis of the transactions with a relatively low degree of parallel playback From the transaction distribution, it can be seen that this part of last_committed is basically a single transaction. They need to wait for the completion of the pre-order transaction playback before they can play it back. This will cause the coordination thread wait observed in the previous log to be unable to play back in parallel and enter the waiting state. When the time is relatively long
$ mysqlbinlog --no-defaults 046638 |grep -o 'last_committed.*' | sed 's/=/ /g' | awk '{print $2}' |sort -n | uniq -c |awk 'BEGIN {print "last_commited group_count Percentage"} {count[$2]=$1; sum+=$1} END {for (i in count) printf "%d %d %.2f%%\n", i, count[i], (count[i]/sum)*100|"sort -k 1,1n"}' | awk '{if($2>=1 && $2 <11) {print $2}}' | sort | uniq -c
 200863 1
  17236 2
     98 3
     13 4
      3 5
      1 7
The second command counts the total number of transactions with more than 10 same last_committed transactions. The number is 314694, accounting for 57%. It analyzes these transactions with a relatively high degree of parallel playback in detail. It can be seen that each group is between 6500 and 9000. number of transactions
$ mysqlsqlbinlog --no-defaults 046638 |grep -o 'last_committed.*' | sed 's/=/ /g' | awk '{print $2}' |sort -n | uniq -c |awk 'BEGIN {print "last_commited group_count Percentage"} {count[$2]=$1
; sum+=$1} END {for (i in count) printf "%d %d %.2f%%\n", i, count[i], (count[i]/sum)*100|"sort -k 1,1n"}' | awk '{if($2>11){print $0}}' | column -t
last_commited  group_count  Percentage
1              7340         1.33%
11938          7226         1.31%
23558          7249         1.32%
35248          6848         1.24%
46421          7720         1.40%
59128          7481         1.36%
70789          7598         1.38%
82474          6538         1.19%
93366          6988         1.27%
104628         7968         1.45%
116890         7190         1.31%
128034         6750         1.23%
138849         7513         1.37%
150522         6966         1.27%
161989         7972         1.45%
175599         8315         1.51%
189320         8235         1.50%
202845         8415         1.53%
218077         8690         1.58%
234248         8623         1.57%
249647         8551         1.55%
264860         8958         1.63%
280962         8900         1.62%
297724         8768         1.59%
313092         8620         1.57%
327972         9179         1.67%
344435         8416         1.53%
359580         8924         1.62%
375314         8160         1.48%
390564         9333         1.70%
407106         8637         1.57%
422777         8493         1.54%
438500         8046         1.46%
453607         8948         1.63%
470939         8553         1.55%
486706         8339         1.52%
503562         8385         1.52%
520179         8313         1.51%
535929         7546         1.37%
Introduction to last_committed mechanism
The parameters of the main library binlog_transaction_dependency_trackingare used to specify how to generate the dependency information written to the binary log to help the slave library determine which transactions can be executed in parallel. That is, this parameter is used to control the generation mechanism of last_committed. The optional values of the parameter are COMMIT_ORDER, WRITESET, and SESSION_WRITESET. From the following code, it is easy to see the three parameter relationships:
- The basic algorithm is COMMIT_ORDER
- The WRITESET algorithm is calculated again based on COMMIT_ORDER
- The SESSION_WRITESET algorithm is calculated again based on WRITESET
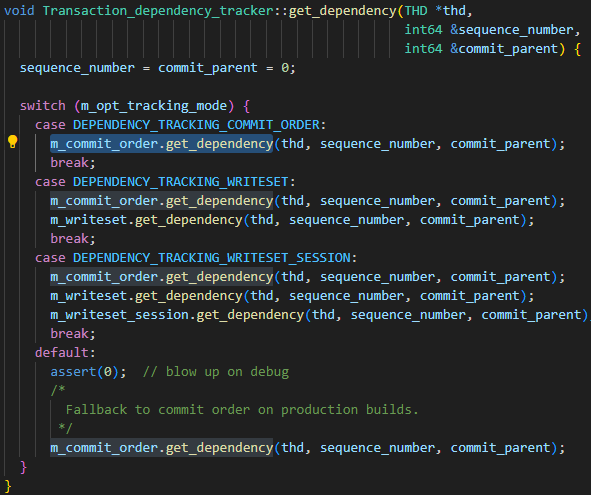
Since my instance is set to WRITESET, just focus on the COMMIT_ORDER algorithm and the WRITESET algorithm.
COMMIT_ORDER
COMMIT_ORDER calculation rule: If two transactions are submitted at the same time on the master node, it means that there is no conflict between the data of the two transactions, then they can also be executed in parallel on the slave node. An ideal typical case is as follows.
| session-1 | session-2 |
|---|---|
| BEGIN | BEGIN |
| INSERT t1 values(1) | |
| INSERT t2 values(2) | |
| commit (group_commit) | commit (group_commit) |
But for MySQL, group_commit is an internal behavior. As long as session-1 and session-2 execute commit at the same time, regardless of whether they are internally merged into group_commit, the data of the two transactions are essentially conflict-free; taking a step back, As long as session-1 executes commit and no new data is written to session-2, the two transactions still have no data conflicts and can still be replicated in parallel.
| session-1 | session-2 |
|---|---|
| BEGIN | BEGIN |
| INSERT t1 values(1) | |
| INSERT t2 values(2) | |
| commit | |
| commit |
For scenarios with more concurrent threads, these threads may not be able to replicate in parallel at the same time, but some transactions can. Taking the following execution sequence as an example, after session-3 commits, session-2 has no new writes, so the two transactions can be replicated in parallel; after session-3 commits, session-1 inserts a new data, the data conflict cannot be determined at this time, so the transactions of session-3 and session-1 cannot be replicated in parallel; but after session-2 is submitted, no new data is written after session-1, so session-2 and session-1 are again Can be replicated in parallel. Therefore, in this scenario, session-2 can be replicated in parallel with session-1 and session-3 respectively, but the three transactions cannot be replicated in parallel at the same time.
| session-1 | session-2 | session-3 |
|---|---|---|
| BEGIN | BEGIN | BEGIN |
| INSERT t1 values(1) | INSERT t2 values(1) | INSERT t3 values(1) |
| INSERT t1 values(2) | INSERT t2 values(2) | |
| commit | ||
| INSERT t1 values(3) | ||
| commit | ||
| commit |
WRITESET
It is actually a combination of commit_order+writeset. It will first calculate a last_committed value through commit_order, then calculate a new value through writeset, and finally take the smaller value between the two as the last_committed value of the final transaction gtid.
In MySQL, writeset is essentially a hash value calculated for schema_name + table_name + primary_key/unique_key. During the execution of the DML statement, before generating row_event through binlog_log_row, all primary keys/unique keys in the DML statement will have hash values calculated separately. , and added to the writeset list of the transaction itself. And if there is a table without a primary key/unique index, has_missing_keys=true will also be set for the transaction.
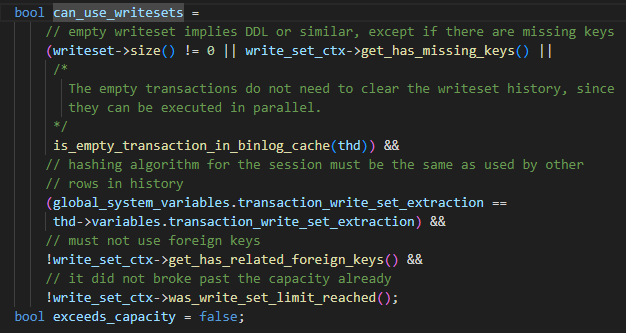
The parameter is set to WRITESET, but it may not be used. The restrictions are as follows
- Non-DDL statements or tables with primary keys or unique keys or empty transactions
- The hash algorithm used by the current session is consistent with that in the hash map.
- No foreign keys used
- The capacity of the hash map does not exceed the setting of binlog_transaction_dependency_history_size. When the above four conditions are met, the WRITESET algorithm can be used. If any of the conditions is not met, it will degenerate to the COMMIT_ORDER calculation method.
The specific WRITESET algorithm is as follows, when the transaction is submitted:
-
last_committed is set to m_writeset_history_start, this value is the smallest sequence_number in the m_writeset_history list
-
Traverse the writeset list of transactions
a If a writeset does not exist in the global m_writeset_history, construct a pair<writeset, sequence_number> object of the current transaction and insert it into the global m_writeset_history list
b. If it exists, then last_committed=max(last_committed, the sequence_number value of the historical writeset), and at the same time update the sequence_number corresponding to the writeset in m_writeset_history to the current transaction value
-
If has_missing_keys=false, that is, all data tables of the transaction contain primary keys or unique indexes, then the minimum value calculated by commit_order and writeset will be used as the final last_committed value.
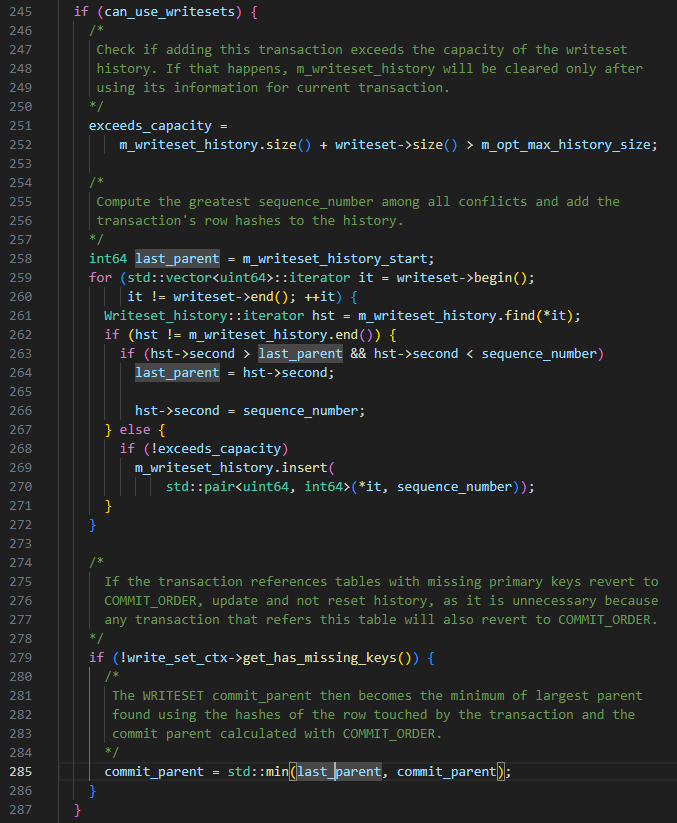
TIPS: Based on the above WRITESET rules, there will be a situation where the last_committed of the transaction submitted later is smaller than the transaction submitted first.
Conclusion analysis
Conclusion description
According to the usage restrictions of WRITESET, we compared relay-log and the table structures involved in the transaction, and analyzed the transaction composition of single last_committed and found the following two situations:
- There is a data conflict between the data involved in the single last_committed transaction and sequence_number.
- The table involved in a single last_committed transaction has no primary key, and there are many such transactions.
From the above analysis, it can be concluded that there are too many transactions in the table without a primary key, causing WRITESET to degenerate into COMMIT_ORDER. Since the database is a TP application, transactions are submitted quickly, and multiple transaction submissions cannot be guaranteed to be within one commit cycle, resulting in COMMIT_ORDER. The last_committed repeated reads generated by the mechanism are very low. The slave library can only play back these transactions serially, causing playback delays.
Optimization measures
- Modify the tables from the business side and add primary keys to related tables where possible.
- Try to increase the parameters binlog_group_commit_sync_delay and binlog_group_commit_sync_no_delay_count from 0 to 10000. Due to special environmental restrictions, this adjustment does not take effect. Different scenarios may have different performances.
Enjoy GreatSQL :)
About GreatSQL
GreatSQL is a domestic independent open source database suitable for financial-level applications. It has many core features such as high performance, high reliability, high ease of use, and high security. It can be used as an optional replacement for MySQL or Percona Server and is used in online production environments. , completely free and compatible with MySQL or Percona Server.
Related links: GreatSQL Community Gitee GitHub Bilibili
GreatSQL Community:

Community reward suggestions and feedback: https://greatsql.cn/thread-54-1-1.html
Community blog prize-winning submission details: https://greatsql.cn/thread-100-1-1.html
(If you have any questions about the article or have unique insights, you can go to the official community website to ask or share them~)
Technical exchange group:
WeChat & QQ group:
QQ group: 533341697
WeChat group: Add GreatSQL Community Assistant (WeChat ID: wanlidbc) as a friend and wait for the community assistant to add you to the group.