
Author: Jing Lei
Scenes
Now through SLS's ES compatibility, you can easily use Kibana to query and visualize SLS data. Users who migrate from ES to SLS can continue to retain their original Kibana usage habits. The following demonstrates how to access SLS through Kibana.
Instructions
Deployment architecture

The blue parts here are components that require client deployment.
- Kibana is used for visualization
- Proxy is used to distinguish Kibana requests and forward SLS-related ones to the ES-compatible interface of SLS.
- Elasticsearch is used to store Kibana’s Meta
Wait, why do we need an ES here?
The reason is that SLS's Logstore does not support updates, and many Meta class data are not suitable for SLS.
Kibana has a lot of metadata to store, such as Kibana's chart configuration, Index Pattern configuration, etc.
Therefore, you need to deploy an ES instance. This ES instance will only store Kibana's metadata, so its resource usage is very small.
Deployment process
Deploy using docker-compose
Related preparations
After installing docker and docker compose, the following steps are also applicable to podman compose.
Create related directories
mkdir sls-kibaba # 创建一个新的目录
cd sls-kibaba # 进入
mkdir es_data # 创建一个目录用于放es的数据
Configuration
Create the docker-compose.yml file in the sls-kibana directory.
The content is as follows: (The following marks are the places that should be modified here. Please make modifications according to the actual situation)
version: '3'
services:
  es:
    image: elasticsearch:7.17.3
    environment:
      - "discovery.type=single-node"
      - "ES_JAVA_OPTS=-Xms2G -Xmx2G"
      - ELASTIC_USERNAME=elastic
      - ELASTIC_PASSWORD=ES密码 # 此处请修改
      - xpack.security.enabled=true
    volumes:
      - ./data:/usr/share/elasticsearch/data
    networks:
      - es717net

  kproxy:
    image: sls-registry.cn-hangzhou.cr.aliyuncs.com/kproxy/kproxy:1.9d
    depends_on:
      - es
    environment:
      - ES_ENDPOINT=es:9200
      - SLS_ENDPOINT=https://etl-dev.cn-huhehaote.log.aliyuncs.com/es/ # 此处请修改,规则为 https://${project名}.${slsEnpoint名}/es/
      - SLS_PROJECT=etl-dev # 此处请修改
      - SLS_ACCESS_KEY_ID=ALIYUN_ACCESS_KEY_ID # 此处请修改, 确保有读logstore的权限
      - SLS_ACCESS_KEY_SECRET=ALIYUN_ACCESS_KEY_SECRET # 此处请修改为真实accessKeySecret
    networks:
      - es717net

  kibana:
    image: kibana:7.17.3
    depends_on:
      - kproxy
    environment:
      - ELASTICSEARCH_HOSTS=http://kproxy:9201
      - ELASTICSEARCH_USERNAME=elastic
      - ELASTICSEARCH_PASSWORD=ES密码 # 此处请修改(跟前面设置的ES密码相同)
      - XPACK_MONITORING_UI_CONTAINER_ELASTICSEARCH_ENABLED=true
    ports:
      - "5601:5601"
    networks:
      - es717net

networks:
  es717net:
    ipam:
      driver: default
Start the local Kibana service:
docker compose up -d
Check docker compose startup status:
docker compose ps
Visit Kibana
Access http://$ (deployment Kibaba IP address}:5601 with your browser , enter your account and password to log in to Kibana.
Configure Index Pattern
Select Stack Management:

Click the Index Pattern Tab. It is normal to not see data in the Index Pattern list. The Logstore of the Log Service is mapped to the Index Patterns in Kibana and needs to be created manually. Click create an index pattern against hidden or system indices in the prompt box.

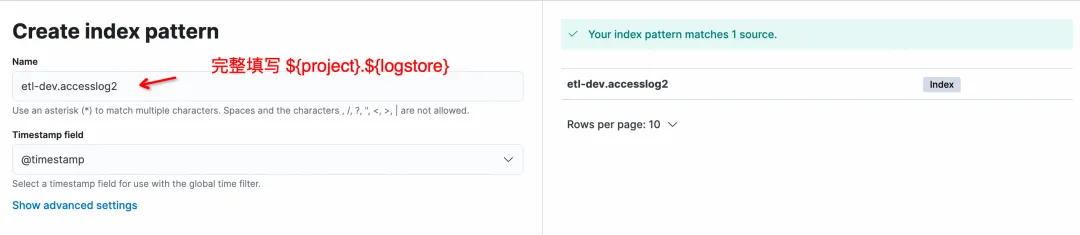
On the Create Index Pattern page, the format for Name is ${project}.${logstore}. Note that the ratio must be filled in completely and * matching is not supported.

Click Create Index Pattern to complete Pattern creation, and then enter Discover to query the data.

Query Logstore

KQL and Lucene can be selected in Kibana's query box, and both SLS's ES-compatible interfaces are supported.
Simple host query:
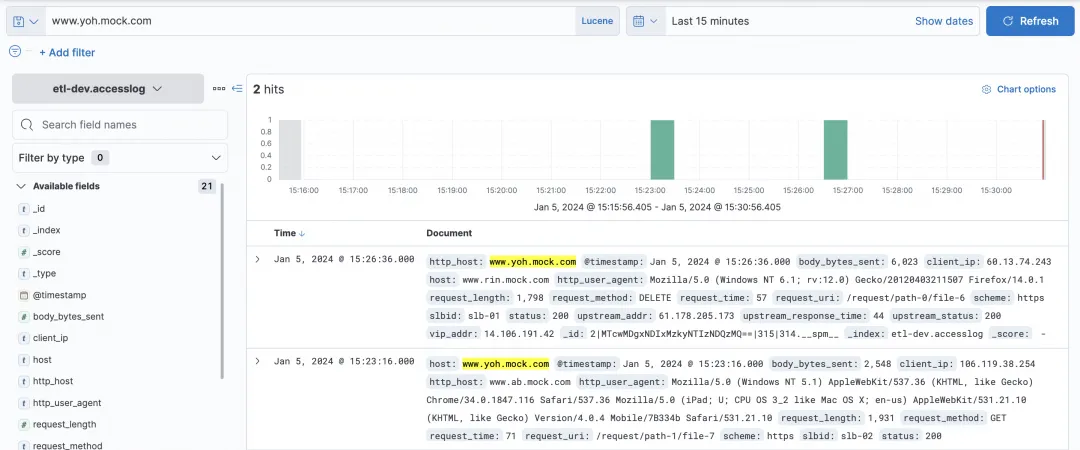
Some complex queries and filters can be queried.

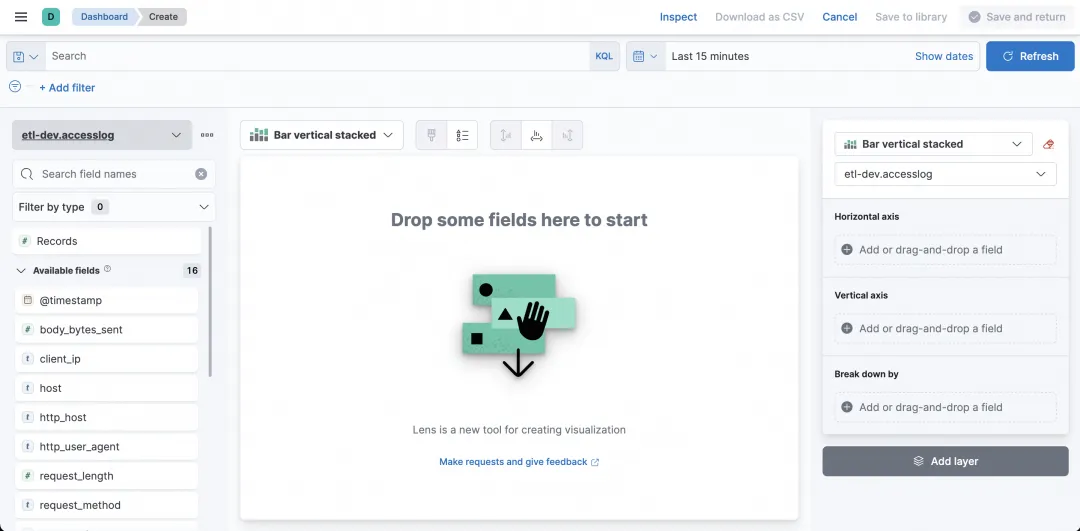
Visual charts
So in addition to querying, can Kibana be used for visualization? sure! Select Dashboard.

After entering, click Create Dashboard to create a chart.
By setting the fields and statistical methods of the horizontal axis and vertical axis, you can easily create the desired graph.
For example, the simplest histogram is a histogram that counts the number of requested visits, with time on the horizontal axis and the number of records on the vertical axis.
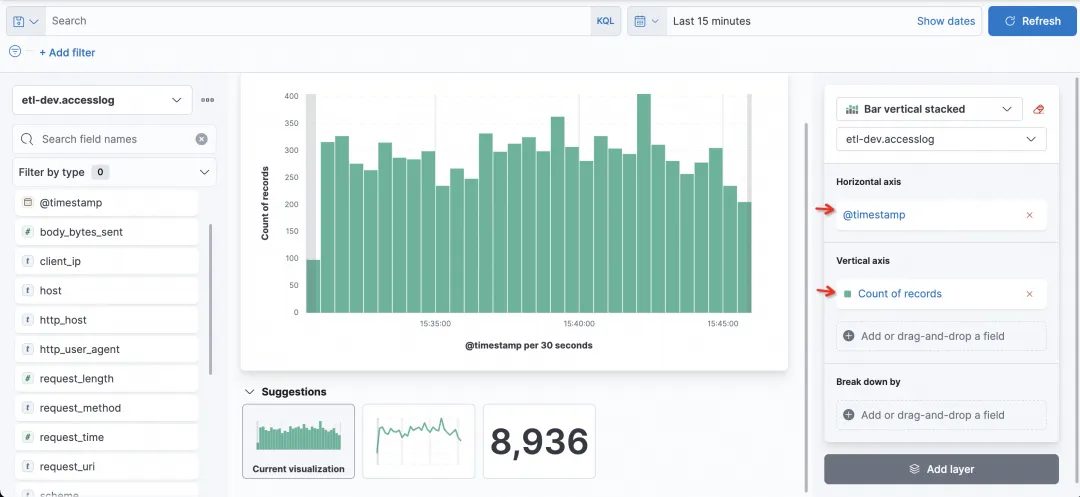
Now I want to see the status of each column. I can select the Break down by field as status.

FAQ
1) Why can’t I see the Logstore on SLS in Kibana?
The Logstore on SLS is queried through Kibana's Index Pattern, and the Logstore on SLS needs to be created by manually creating an Index Pattern.
2) When creating Index Pattern on Kibana, why is there no prompt when no input is made?
This is normal. After entering the correct ${project}.${logstore} on the left (where ${project} and ${logstore} need to be replaced with real values), the following will be displayed:
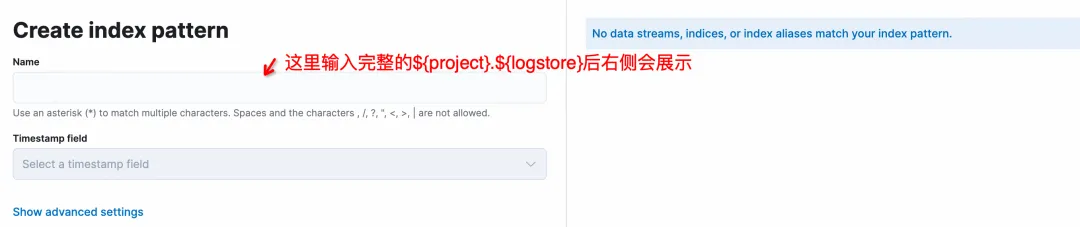
3) Does Kibana support * wildcards when creating Index Pattern?
Wildcarding is not supported and ${project}.${logstore} needs to be filled in completely, such as etl-dev.accesslog to match.
4) Why is there no prompt on the right side when creating the Index Pattern of Logstore on Kibana?
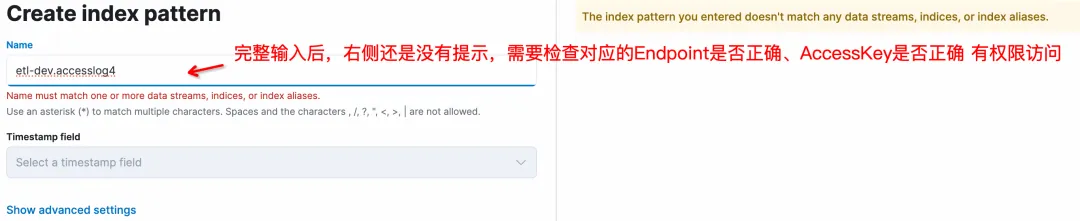
There are several possibilities:
- The ES compatible address of SLS is wrong. When configured in kproxy, the rule is https://${project name}.${slsEnpoint name}/es/. Pay attention to the suffix /es/. 2. The corresponding accessKeyId and accessKeySerect do not have permission to access SLS Logstore (read permission).
- 5) I have multiple SLS Projects that I want to access on Kibana. Can this be done?
Yes, the key lies in the configuration of kproxy. SLS_PROJECT, SLS_ENDPOINT, SLS_ACCESS_KEY_ID, SLS_ACCESS_KEY_SECRET are the variable names related to the first Project. Starting from the second Project, the relevant variable names need to be added with numeric suffixes, such as SLS_PROJECT2, SLS_ENDPOINT2, SLS_ACCESS_KEY_ID2, SLS_ACCESS_KEY_SECRET2. If the AccessKey of a subsequent Project is the same as the first Project, the configuration of the AccessKey corresponding to the Project can be omitted.
For example, assuming that another Project is to be checked by Kibaba, then as the second kproxy:
- SLS_ENDPOINT2=https://etl-dev2.cn-huhehaote.log.aliyuncs.com/es/
- SLS_PROJECT2=etl-dev2
- SLS_ACCESS_KEY_ID2=etl-dev2对应的accessKeyId  #如果和SLS_ACCESS_KEY_ID2一样可以不加
- SLS_ACCESS_KEY_SECRET2=etl-dev2对应的accessKeyKey #如果和SLS_ACCESS_KEY_ID2一样可以不加
summary
This article demonstrates how to use Kibana to connect to the SLS ES compatible interface for query and analysis. Kibana's query and visualization capabilities can be connected and used normally. Suitable for the following two situations:
- If your previous usage habit is Kibana and the logs already exist on Alibaba Cloud SLS, you can use this solution to connect.
- If you are currently using the standard ELK solution but are tired of the maintenance work or tuning when using ES, you may wish to try the Alibaba Cloud SLS solution (c++ bottom layer, serverless, low cost, ES compatible).
Looking forward to your use.
Reference documentation:
-
SLS compatible ES introduction
-
Use Kibana to connect to the ES compatible interface https://help.aliyun.com/zh/sls/user-guide/use-kibana-to-access-the-elasticsearch-compatible-api-of-log-service?spm=a2c4g. 11186623.0.0.27bc54e3bgGvsa#cdb8c7a157t0v