
In the digital age, data is one of the most valuable assets of an enterprise. However, as the amount of data grows, so does the complexity of database management. A database failure can cause business disruption and cause huge financial and reputational losses to the company. In this blog, we will share how KaiwuDB designs fault diagnosis tools and specific example demonstrations
01 Design ideas
Follow core principles
- User-friendly: Even users with different skill levels can easily use our tools;
- Comprehensive monitoring: Comprehensive monitoring of all aspects of the database system, including performance indicators, system resources and query efficiency;
- Intelligent Diagnostics: Utilizes advanced algorithms to identify the root cause of problems;
- Automated repairs: Provides one-click repair suggestions and, where possible, automatically applies these repairs;
- Extensibility: Allows users to extend and customize tool functionality to their specific needs.
Support key indicator collection
To ensure comprehensive diagnosis, the tool will collect a series of key indicators, including but not limited to:
- System configuration: database version, operating system, CPU architecture and number, memory capacity, disk type and capacity, mount point, file system type;
- Deployment situation: whether it is bare metal or container deployment, the deployment mode and number of nodes of the database instance; data organization: the structure of the data directory, local and cluster configuration, system tables and parameters;
- Database statistics: number of business databases, number of tables under each database and table structure;
- Column characteristics: statistical characteristics of numerical columns and enumeration columns, length and special character detection of string columns;
- Log files: relationship log, timing log, error log, audit log;
- PID information: the number of handles opened by the database process, the number of MMAPs opened, stat and other information;
- Performance data: SQL execution plan, system monitoring data (CPU, memory, I/O), index usage and efficiency, data access patterns, locks (transaction conflicts and wait events), system events, etc.
Support different operating modes
The tool will provide two operating modes to meet the needs of different scenarios:
- One-time collection: quickly capture the current system status and performance data, suitable for immediate problem diagnosis;
- Scheduled collection: Collect data periodically according to a preset plan for long-term performance monitoring and trend analysis.
Adapt to various trend analysis
The data collected will be used to perform trend analysis, with capabilities including:
- Performance trends: identify trends in database performance over time and predict potential performance bottlenecks;
- Resource usage: Track system resource usage and help optimize resource allocation;
- Log analysis: Analyze log files to identify abnormal patterns and frequent errors;
- Query optimization: Provide query optimization suggestions by analyzing SQL execution plans;
- Best practices: Provide optimal configuration recommendations through comprehensive analysis of data distribution and hardware resources.
02 Overall architecture
The fault diagnosis tool is divided into two parts: collection and analysis:
- The collection part is connected to the target operating system/database/monitoring server, supports simplified analysis of local rules, and outputs plain text reports;
- The analysis part reads and formats the collected data and uploads it to the analysis server for persistence. It supports detailed analysis and prediction of online rules and outputs detailed reports through the UI.
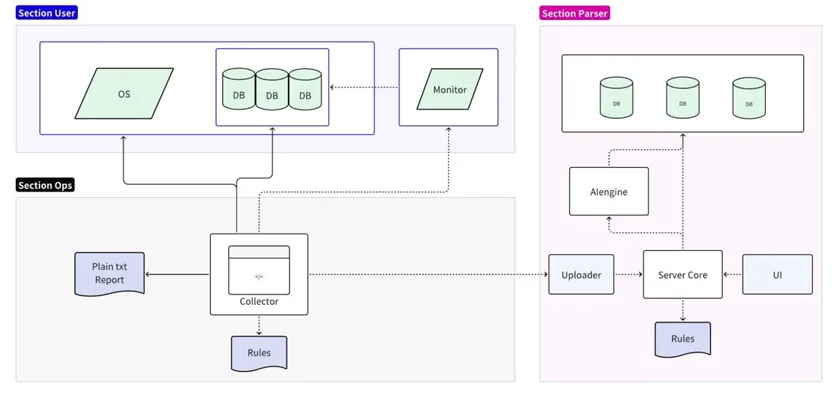
Collector implementation
The collector is a tool used directly by operation and maintenance personnel on site. It obtains various original information on site through the operating system, database and monitoring services. By default, compression and direct export after collection are supported. You can also use local rules to do the most basic analysis, such as finding and printing all Error messages.

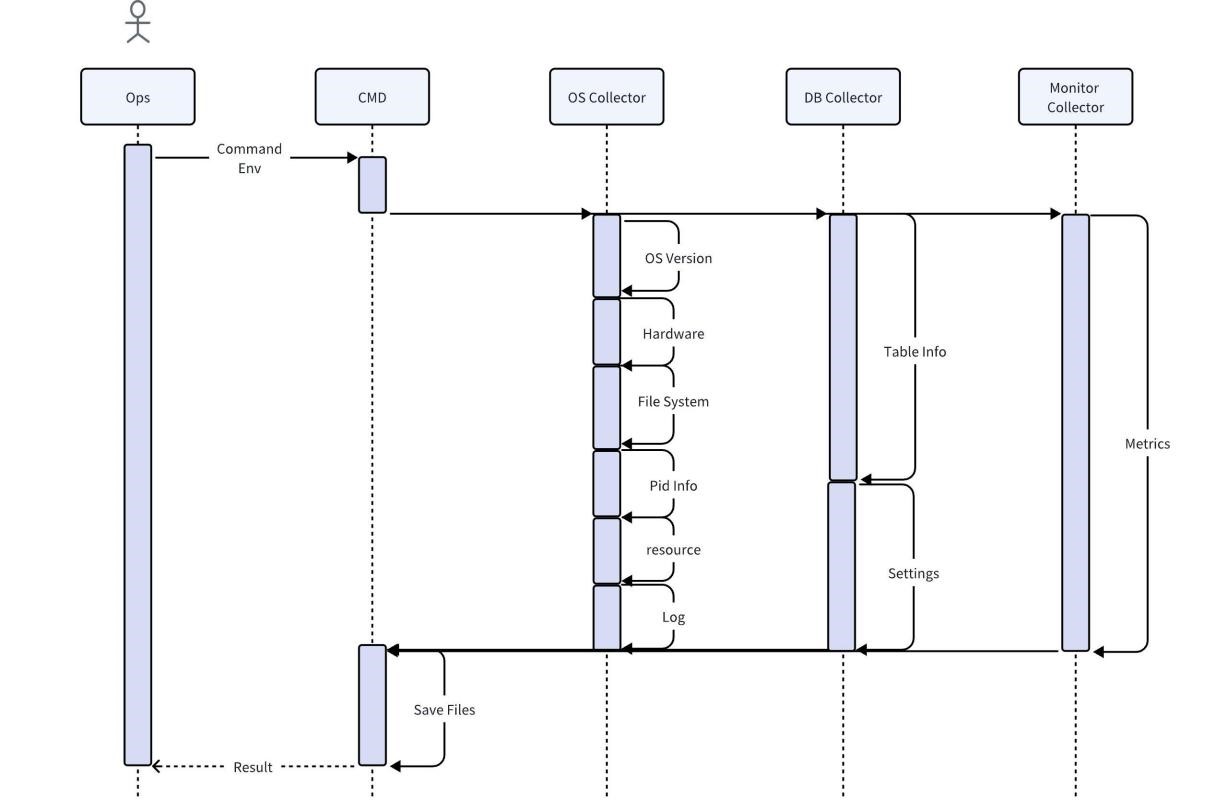
Considering that directly collecting user business data may lead to the risk of exposing user information, during the collection process of the database collector, only the user's data characteristics will be captured and no data will be copied. In order to ensure the completeness and accuracy of other data, the collected data will not be processed in any way before analysis, and the necessary data will be maintained to provide complete information. To save space, the collected data should be compressed. At the same time, the collector must be compatible with most operating systems and require no additional dependencies.
Rule engine implementation
For subsequent data analysis, the rule engine needs to be compatible with the data collector to provide standardized data output and have certain scalability. For example, to analyze the increase in CPU usage when a specific SQL is executed, it is necessary to output the metadata of the SQL query (such as SQL text, execution time, etc.) and performance indicators (such as CPU usage) in the format of the timing engine in order to analyze performance bottlenecks.
In order to provide sufficient scalability and be able to cover an ever-expanding set of rules, including functional issues such as error code checking, the rules engine reads rules from external files and then applies these rules to analyze the data. The following are some code examples:
Python
import pandas as pd
import json

# 加载规则
def load\_rules(rule\_file):
    with open(rule_file, 'r') as file:
        return json.load(file)

# 自定义规则函数,这个函数将检查特定SQL执行时CPU使用率是否有显著增加
def sql\_cpu\_bottleneck(row, threshold):
    # 比较当前行的CPU使用率是否超过阈值
    return row\['sql\_query'\] == 'SELECT * FROM table\_name' and row\['cpu_usage'\] > threshold

# 应用规则
def apply\_rules(data, rules\_config, custom_rules):
    for rule in rules_config:
        data\[rule\['name'\]\] = data.eval(rule\['expression'\])

    for rule\_name, custom\_rule in custom_rules.items():
        data\[rule\_name\] = data.apply(custom\_rule, axis=1)

    return data

# 读取CSV数据
df = pd.read\_csv('sql\_performance_data.csv')

# 加载规则
rules\_config = load\_rules('rules.json')

# 定义自定义规则
custom_rules = {
    'sql\_cpu\_bottleneck': lambda row: sql\_cpu\_bottleneck(row, threshold=80)
}

# 应用规则并得到结果
df = apply\_rules(df, rules\_config, custom_rules)

# 输出带有规则检查结果的数据
df.to\_csv('evaluated\_sql_performance.csv', index=False)
Rule files should be continuously expanded with version iterations and support hot updates. The following is an example of a rules configuration file in JSON format. Rules are defined as JSON objects, each containing a name and an expression understood by the Pandas DataFrame.
JSON
\[
    {
        "name": "high\_execution\_time",
        "expression": "execution_time > 5"
    },
    {
        "name": "general\_high\_cpu_usage",
        "expression": "cpu_usage > 80"
    },
    {
        "name": "slow_query",
        "expression": "query_time > 5"
    },
    {
        "name": "error\_code\_check",
        "expression": "error_code not in \[0, 200, 404\]"
    }
    // 其他规则可以在此添加
\]
Prediction realized
Diagnostic tools can be connected to prediction engines to detect potential risks in advance. The following example uses the scikit-learn decision tree classifier to train a model and uses the model to make predictions:
Python
from sklearn.tree import DecisionTreeClassifier
from sklearn.model\_selection import train\_test_split
from sklearn.metrics import accuracy_score

# 读取CSV数据
df = pd.read\_csv('performance\_data.csv')

# 假设我们已经有了一个标记了性能问题的列 'performance_issue'
# 这个列可以通过规则引擎或历史数据分析得到

# 特征和标签
X = df\[\['cpu\_usage', 'disk\_io', 'query_time'\]\]
y = df\['performance_issue'\]

# 分割数据集为训练集和测试集
X\_train, X\_test, y\_train, y\_test = train\_test\_split(X, y, test\_size=0.2, random\_state=42)

# 创建决策树模型
model = DecisionTreeClassifier()

# 训练模型
model.fit(X\_train, y\_train)

# 预测测试集
y\_pred = model.predict(X\_test)

# 打印准确率
print(f'Accuracy: {accuracy\_score(y\_test, y_pred)}')

# 保存模型,以便以后使用
import joblib
joblib.dump(model, 'performance\_predictor\_model.joblib')

# 若要使用模型进行实时预测
def predict\_performance(cpu\_usage, disk\_io, query\_time):
    model = joblib.load('performance\_predictor\_model.joblib')
    prediction = model.predict(\[\[cpu\_usage, disk\_io, query_time\]\])
    return 'Issue' if prediction\[0\] == 1 else 'No issue'

# 示例:使用模型预测一个新的数据点
print(predict_performance(85, 90, 3))
03 Sample Demonstration
Hypothetical scenario: You are an IT expert at an Internet of Things company and find that the query response time of the time series database for processing device status data is very slow in certain periods. How can you deal with this?
data collection
The database diagnostic tool you use starts to collect the following data:
1. Query log: A query is found that appears frequently and the execution time is much longer than other queries.
Plaintext
SELECT avg(temperature) FROM device_readings
WHERE device_id = ? AND time > now() - interval '1 hour'
GROUP BY time_bucket('5 minutes', time);Plaintext
2. Execution plan: The execution plan of this query shows that this SQL will scan the entire table and then filter the device_id.
3. Index usage: The device_id on the device_readings table does not have a TAG index.
4. Resource usage: CPU and I/O peak when executing this query.
5. Locking and waiting events: No abnormal locking events were found.
Analysis and pattern recognition
Diagnostic tools analyze queries and execution plans to identify the following patterns:
- Frequent full table scans lead to increased I/O and CPU loads;
- Without appropriate indexes, queries cannot locate the data efficiently.
Problem diagnosis
The tool uses built-in rules that match the following diagnosis: Query inefficiency is caused by a lack of appropriate indexes.
Suggestion generation
Based on this pattern, the diagnostic tool generates the following recommendation: Create a TAG index on the device_id field of the device_readings table.
Implement recommendations
The database administrator executes the following SQL statement to create the index:
SQL
ALTER TABLE device\_readings ADD TAG device\_id;
Validation results
After the index was created, the database diagnostic tool collected the data again and discovered:
- 该特定查询的执行时间显著下降;
- CPU and I/O loads drop to normal levels during query execution;
- The product catalog page loading time of the website has returned to normal.
Algorithm description
In this example, the diagnostic tool uses the following algorithm and logic:
- Pattern recognition: detect query frequency and execution time;
- Correlation analysis: Correlate long execution time queries with execution plans and index usage;
- Decision tree or rule engine: If a full table scan is found and the corresponding field does not have an index, it is recommended to create an index;
- Performance change monitoring: After creating the index, monitor the performance improvement to determine the effectiveness of the recommendations.