
Author|Invisible (Xing Ying), senior database kernel engineer at NetEase
Editing and finishing|SelectDB technical team
Introduction: As important business lines of NetEase, Lingxi Office and Yunxin have respectively built the Lingxi Eagle monitoring platform and Yunxin data platform to address the challenges of large-scale log/time series data processing and analysis. This article will focus on the application of Apache Doris in NetEase logs and time series scenarios, and how to use Apache Doris to replace Elasticsearch and InfluxDB, thereby achieving lower server resources and higher query performance experience. Compared with Elasticsearch, Apache Doris query speed is at least Improved by 11 times, saving storage resources by up to 70%.
With the rapid development of information technology, the amount of enterprise data has exploded. For a large Internet company like NetEase, a large amount of logs and time series data are generated every day, whether it is internal office systems or externally provided services. These data have become an important cornerstone for troubleshooting, problem diagnosis, security monitoring, risk warning, user behavior analysis and experience optimization. Fully tapping the value of these data will help improve product reliability, performance, safety and user satisfaction.
As important business lines of NetEase, Lingxi Office and Yunxin have built the Lingxi Eagle monitoring platform and Yunxin data platform respectively to cope with the challenges brought by large-scale log/time series data processing and analysis. As the business continues to expand, log/time series data has also grown exponentially, which has brought about problems such as increased storage costs, prolonged query times, and deterioration of system stability. The early platform was unsustainable, which prompted NetEase to look for better solutions.
This article will focus on the implementation of Apache Doris in NetEase log and time series scenarios, introduce the architecture upgrade practice of Apache Doris in NetEase Lingxi Office and NetEase Cloud Letter business, and share the experience of table creation, import, query, etc. based on actual scenarios. Tuning plan.
Early architecture and pain points
01 Lingxi-Eagle monitoring platform
NetEase Lingxi Office is a new generation of email collaborative office platform. Integrate modules such as email, calendar, cloud documents, instant messaging, and customer management. The Eagle monitoring platform is a full-link APM system that can provide multi-dimensional and different-granularity performance analysis for NetEase Lingxi Office.
The Eagle monitoring platform mainly stores and analyzes business log data such as Lingxi Office, Enterprise Email, Youdao Cloud Notes, and Lingxi Documents. The log data is first collected and processed through Logstash, and then stored in Elasticsearch, which performs real-time log retrieval and analysis. It also provides log search and full-link log query services for Lingxi Office.

As time goes by and log data grows, some problems gradually come to light in the process of using Elasticsearch:
- High query latency: In daily queries, the average response latency of Elasticsearch is high, which affects the user experience. This is mainly restricted by factors such as the size of the data, the rationality of the index design, and hardware resources.
- High storage costs: In the context of cost reduction and efficiency improvement, businesses have an increasingly urgent need to reduce storage costs. However, since Elasticsearch has multiple data stores such as forward row, inverted row, and column storage, the degree of data redundancy is high, which brings certain challenges to cost reduction and efficiency improvement.
02 Yunxin-data platform
NetEase Yunxin is a converged communications and cloud-native PaaS service expert built on NetEase's 26 years of technology. It provides converged communications and cloud-native core products and solutions, including IM instant messaging, video cloud, SMS, Qingzhou microservices, and middleware PaaS. wait.
The Yunxin data platform mainly analyzes time series data generated by IM, RTC, SMS and other services. The early data architecture was mainly built based on the time series database InfluxDB. The data source was first reported through the Kafka message queue. After field parsing and cleaning, it was stored in the time series database InfluxDB to provide online and offline queries. The offline side supports offline T+1 data analysis, and the real-time side needs to provide real-time generation of indicator monitoring reports and bills.
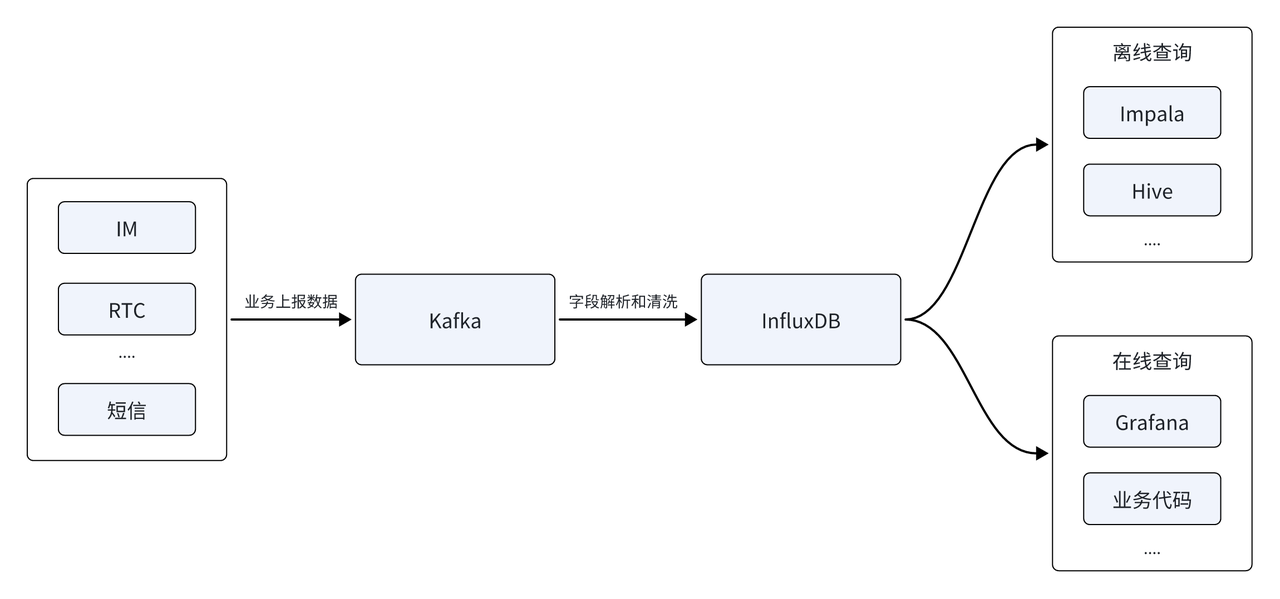
With the rapid coverage of customer scale, the number of reported data sources continues to increase, and InfluxDB also faces a series of new challenges:
- Memory overflow OOM: As the number of data sources increases, offline analysis needs to be performed based on multiple data sources, and the difficulty of analysis increases. Limited by the query capabilities of InfluxDB, the current architecture may cause an out-of-memory (OOM) when faced with complex queries from multiple data sources, which poses a huge challenge to business availability and system stability.
- High storage costs: The development of business has also brought about the continuous growth of cluster data volume, and a large proportion of data in the cluster is cold data. Hot and cold data are stored in the same way, resulting in high storage costs. This is incompatible with cost reduction and increase conflict with effective corporate goals.
Core engine selection
For this reason, NetEase began to look for new database solutions, aiming to solve the challenges faced by the above two major businesses in log timing scenarios. At the same time, NetEase hopes to use only one database to adapt to the business system and technical architecture of the two major application scenarios, meeting the upgrade needs of extreme ease of use and low investment. In this regard, Apache Doris meets our selection requirements, specifically in the following aspects:
- Storage cost optimization : Apache Doris has made many optimizations in the storage structure to reduce redundant storage. It has a higher compression ratio and supports hot and cold tiered storage based on S3 and NOS (Netease Object Storage), which can effectively reduce storage costs and improve data storage efficiency.
- High throughput and high performance : Apache Doris supports columnar storage high-performance disk writing, sequential compaction and Stream Load efficient streaming import, and can support tens of GB of data writing per second. This not only ensures large-scale writing of log data, but also provides low-latency query visibility.
- Real-time log retrieval : Apache Doris not only supports full-text retrieval of log texts, but also enables real-time query response. Doris supports adding an inverted index internally, which can satisfy full-text retrieval of string types and equivalent and range retrieval of ordinary numerical/date types. At the same time, it can further optimize the query performance of the inverted index and make it more suitable for log data analysis. Scenario requirements.
- Support large-scale tenant isolation : Doris can host thousands of databases and tens of thousands of data tables, and can enable one tenant to use one database independently, meeting the needs of multi-tenant data isolation and ensuring data privacy and security.
In addition, in the past year, Apache Doris has continued to delve into the log scenario and launched a series of core capabilities, such as efficient inverted index, flexible Variant data type, etc., to provide better processing and analysis of log/time series data. Efficient and flexible solutions . Based on the above advantages, NetEase finally decided to introduce Apache Doris as the core engine of the new architecture.
Unified log storage and analysis platform based on Apache Doris
01 Lingxi-Eagle monitoring platform

首先,在灵犀办公 - Eagle 监控平台中,网易成功将 Elasticsearch 全面升级为 Apache Doris,从而构建了统一的日志存储和分析平台。这一架构升级不仅显著提升了平台的性能与稳定性,更为其提供了强大且高效的日志检索服务。具体收益体现在:
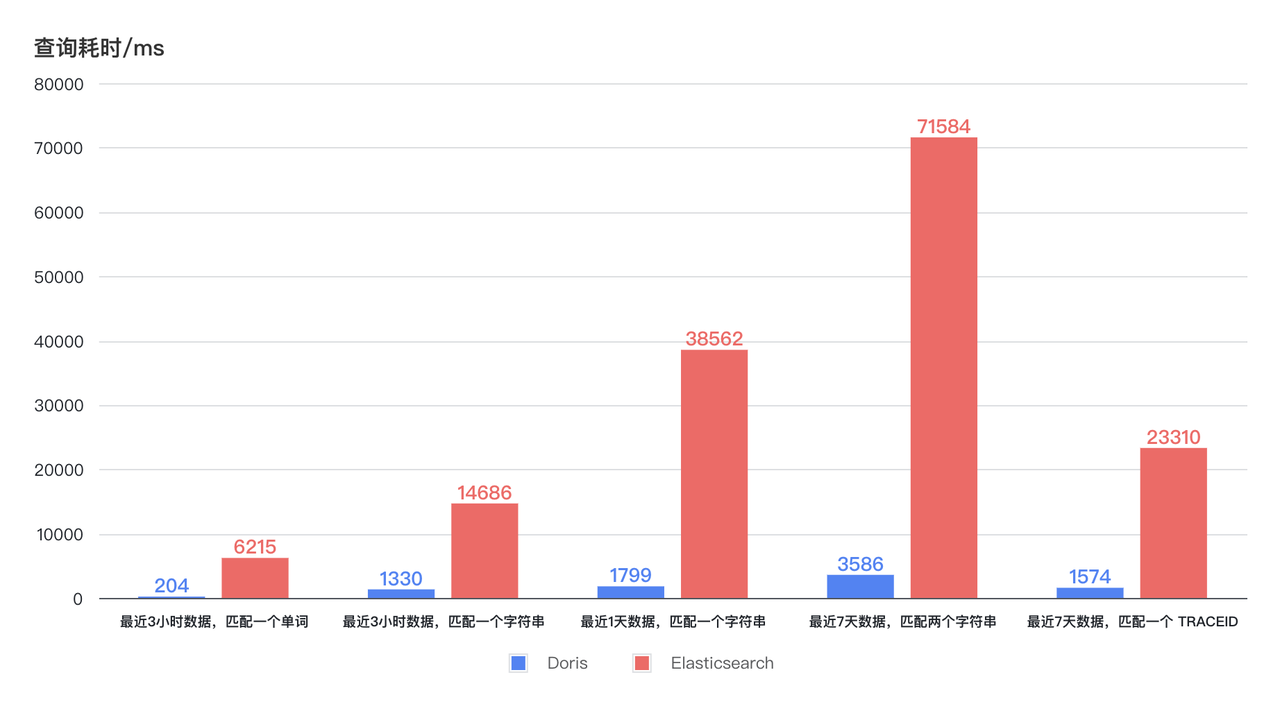
- Storage resources are saved by 70%: Thanks to the high compression ratio of Doris column storage and ZSTD, Elasticsearch requires 100T of storage space to store the same log data, but only 30T of storage space is required to store it in Doris, saving 70% of storage resources . Due to the significant saving in storage space, SSD can be used to store hot data instead of HDD at the same cost, which will also bring greater improvement in query performance.
- Query speeds up 11 times: The new architecture brings dozens of times improvement in query efficiency with lower CPU resource consumption. As can be seen from the diagram below, the Doris query time for log retrieval in the last 3 hours, 1 day, and 7 days remains stable and less than 4 seconds, and the fastest response can be within 1 second. The query time of Elasticsearch shows large fluctuations, with the longest time taking up to 75s, and even the shortest time taking 6-7s. With lower resource usage, Doris's query efficiency is at least 11 times that of Elasticsearch .
02 Yunxin-data platform
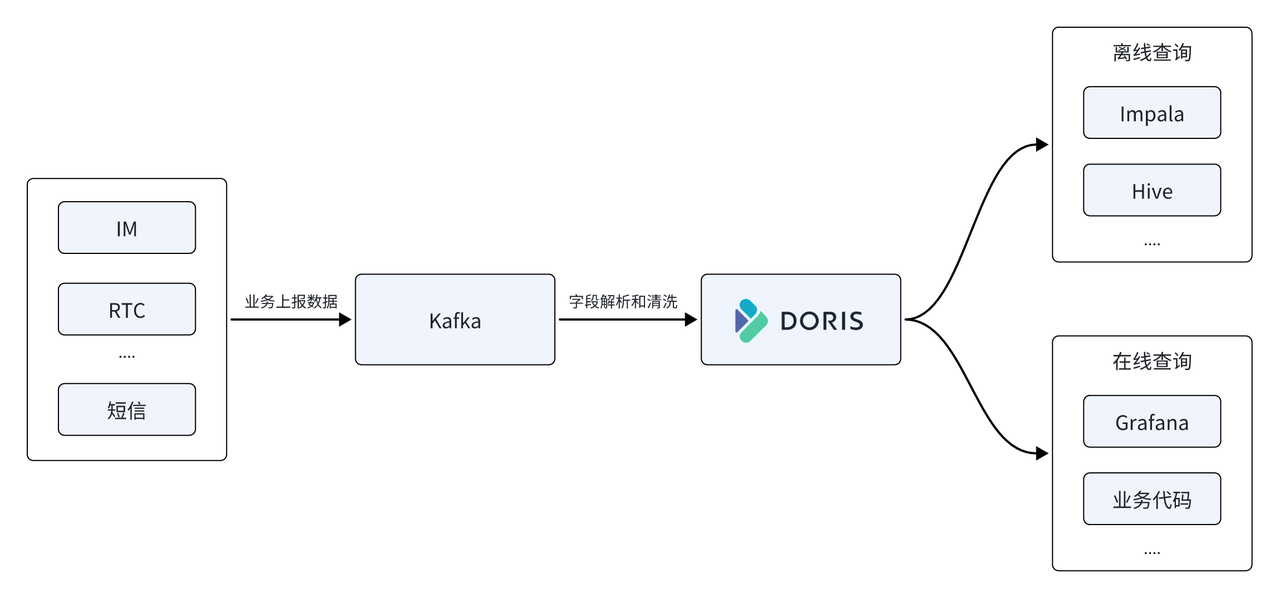
In the Yunxin data platform, NetEase also uses Apache Doris to replace the time series database InfluxDB in the early architecture, using it as the core storage and computing engine of the data platform, and Apache Doris provides unified offline and real-time query services.
- Supports high-throughput writing: average online write traffic of 500M/s, peak 1GB/s, InfluxDB uses 22 servers, and the CPU resource usage is about 50%, while Doris only uses 11 machines, and the CPU usage is about 50% , the overall resource consumption is only 1/2 of the previous one .
- Storage resources saved 67%: 11 Doris physical machines were used to replace 22 InfluxDBs. To store the same data scale, InfluxDB requires 150T storage space, while storing it in Doris only requires 50T storage space, saving 67% in storage resources .
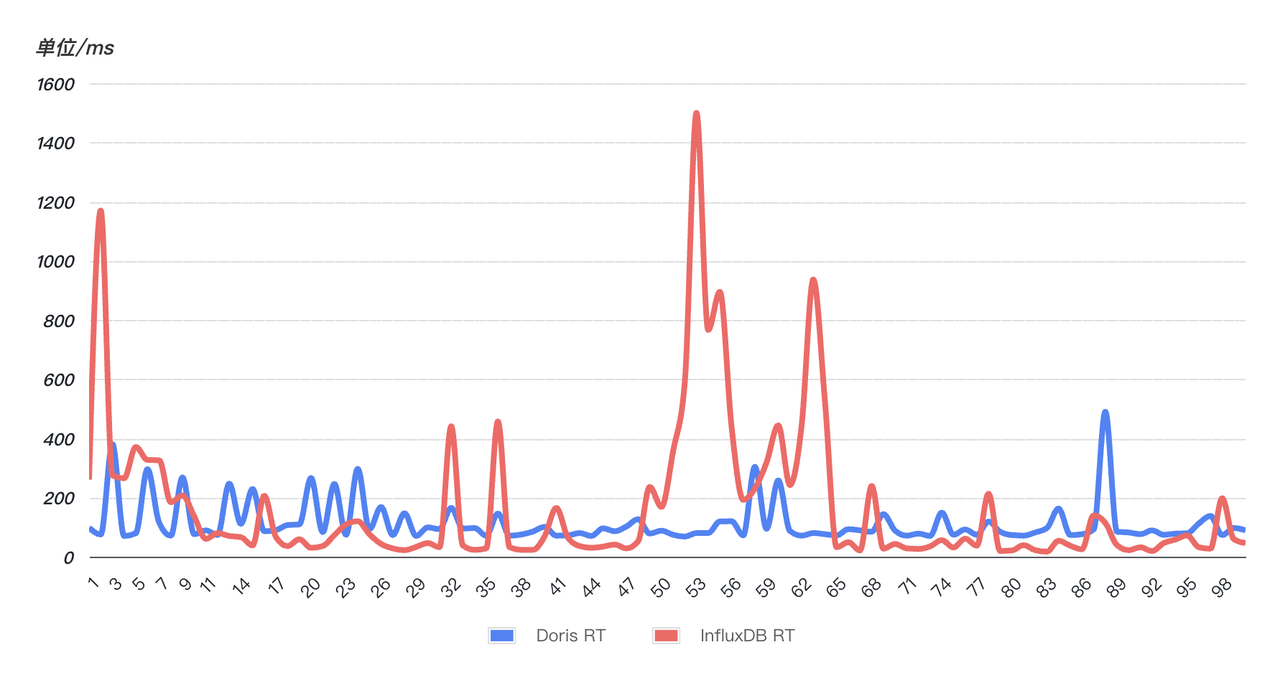
- Query response is fast and more stable: In order to verify the query response speed, an online SQL was randomly selected (matching a string in the last 10 minutes) and the SQL was queried 99 times continuously. As can be seen from the figure below, the query performance of Doris (blue) is more stable than that of InfluxDB (red). 99 queries are relatively stable and have no obvious fluctuations . However, InfluxD has experienced multiple abnormal fluctuations, and the query time has skyrocketed, and the query stability has been affected. Serious impact.
Practice and Tuning
In the process of business implementation, NetEase also encountered some problems and challenges. I would like to take this opportunity to compile and share these valuable optimization experiences, hoping to provide guidance and help for everyone's use.
01 Table creation optimization
Database Schema design is critical to performance, and this is no exception when dealing with log and time series data. Apache Doris provides some specialized optimization options for these two scenarios, so it is critical to enable these optimization options during table creation. Here are the specific optimization options we use in practice:
- 当使用 DATETIME 类型的时间字段作为主键 Key 时,查询最新 n 条日志的速度会得到显著提升。
- Use RANGE partitioning based on time fields and enable dynamic Partiiton to automatically manage partitions on a daily basis, improving the flexibility of data query and management.
- As for the bucketing strategy, you can use RANDOM for random bucketing, and the number of buckets is roughly set to 3 times the total number of cluster disks.
- For fields that are frequently queried, it is recommended to build indexes to improve query efficiency; and for fields that require full-text retrieval, appropriate word segmenter parameters parser should be specified to ensure the accuracy and efficiency of retrieval.
- For log and time series scenarios, a specially optimized time series compaction strategy is used.
- Using ZSTD compression can achieve better compression effects and save storage space.
CREATE TABLE log
(
    ts DATETIME,
    host VARCHAR(20),
    msg TEXT,
    status INT,
    size INT,
    INDEX idx_size (size) USING INVERTED,
    INDEX idx_status (status) USING INVERTED,
    INDEX idx_host (host) USING INVERTED,
    INDEX idx_msg (msg) USING INVERTED PROPERTIES("parser" = "unicode")
)
ENGINE = OLAP
DUPLICATE KEY(ts)
PARTITION BY RANGE(ts) ()
DISTRIBUTED BY RANDOM BUCKETS 250
PROPERTIES (
    "compression"="zstd",
    "compaction_policy" = "time_series",
    "dynamic_partition.enable" = "true",
    "dynamic_partition.create_history_partition" = "true",
    "dynamic_partition.time_unit" = "DAY",
    "dynamic_partition.start" = "-7",
    "dynamic_partition.end" = "3",
    "dynamic_partition.prefix" = "p",
    "dynamic_partition.buckets" = "250"
);
02 Cluster configuration optimization
FE configuration
# 开启单副本导入提升导入性能
enable_single_replica_load = true

# 更加均衡的tablet分配和balance测量
enable_round_robin_create_tablet = true
tablet_rebalancer_type = partition

# 频繁导入相关的内存优化
max_running_txn_num_per_db = 10000
streaming_label_keep_max_second = 300
label_clean_interval_second = 300
BE configuration
write_buffer_size=1073741824
max_tablet_version_num = 20000
max_cumu_compaction_threads = 10(cpu的一半)
enable_write_index_searcher_cache = false
disable_storage_page_cache = true
enable_single_replica_load = true
streaming_load_json_max_mb=250
03 Stream Load import tuning
During peak business periods, Yunxin-data platform faces over 1 million write TPS and 1GB/s write traffic, which undoubtedly places extremely high demands on system performance. However, since there are many small concurrent tables on the business side, and the query side has extremely high real-time requirements for data, it is impossible to accumulate batch processing into a large enough Batch in a short time. After jointly conducting a series of optimizations with business parties, Stream Load is still unable to quickly consume data in Kafka, resulting in an increasingly serious data backlog in Kafka.
经过深入分析,发现在业务高峰期,业务侧的数据导入程序已遭受性能瓶颈,主要体现在 CPU 和内存资源的过度占用。然而,Doris 侧的性能状况尚未出现显著的瓶颈,但 Stream Load 的响应时间却有明显的上升趋势。
由于业务程序是同步调用 Stream Load 的,这意味着 Stream Load 的响应速度直接影响着整体的数据处理效率。因此,如果能够有效降低单个 Stream Load 的响应时间,那么整个系统的吞吐能力将得到显著提升。
After communicating with students in the Apache Doris community, I learned that Doris has launched two important import performance optimizations for log and timing scenarios:
- Single copy import: write to one copy first, and other copies pull data from the first copy. This method can avoid the overhead caused by repeated sorting and index building of multiple copies.
- Single-Tablet import: Compared with the writing method of scattering data to multiple Tablets in normal mode, a strategy of writing only to a single Tablet at a time can be adopted. This optimization reduces the number of small files and IO overhead generated during writing, thereby improving the overall import efficiency. This feature can be enabled by setting
load_to_single_tabletthe parameter to during import .true
在使用上述方式优化后,导入性能得到显著的提升:
- The speed of consuming Kafka is increased by more than 2 times
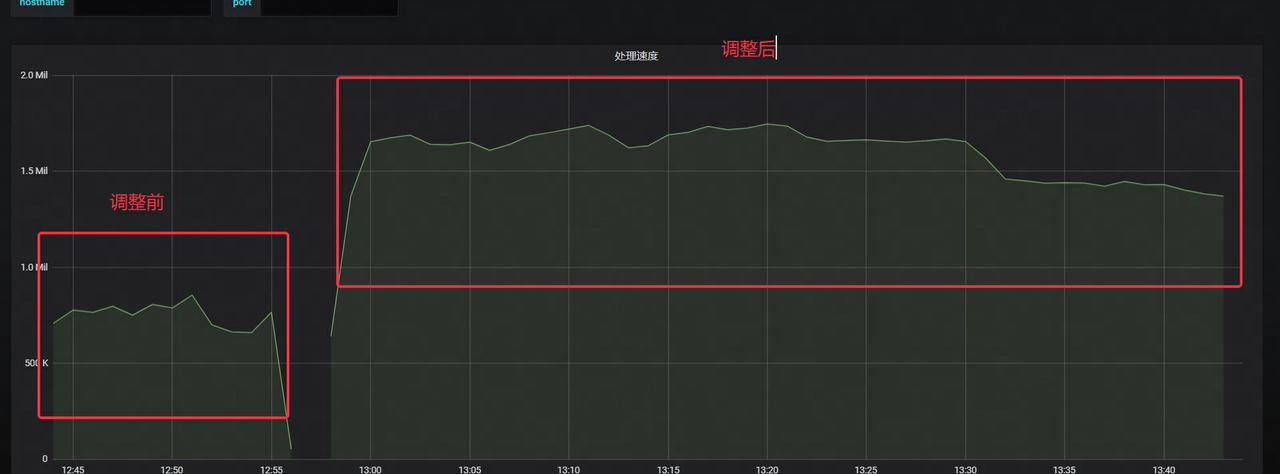
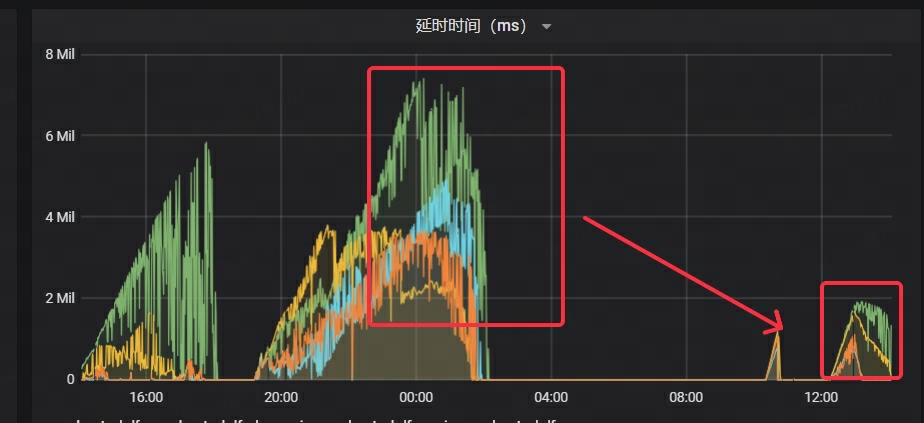
- Kafka 的延迟时间显著下降,仅为原先耗时的 1/4
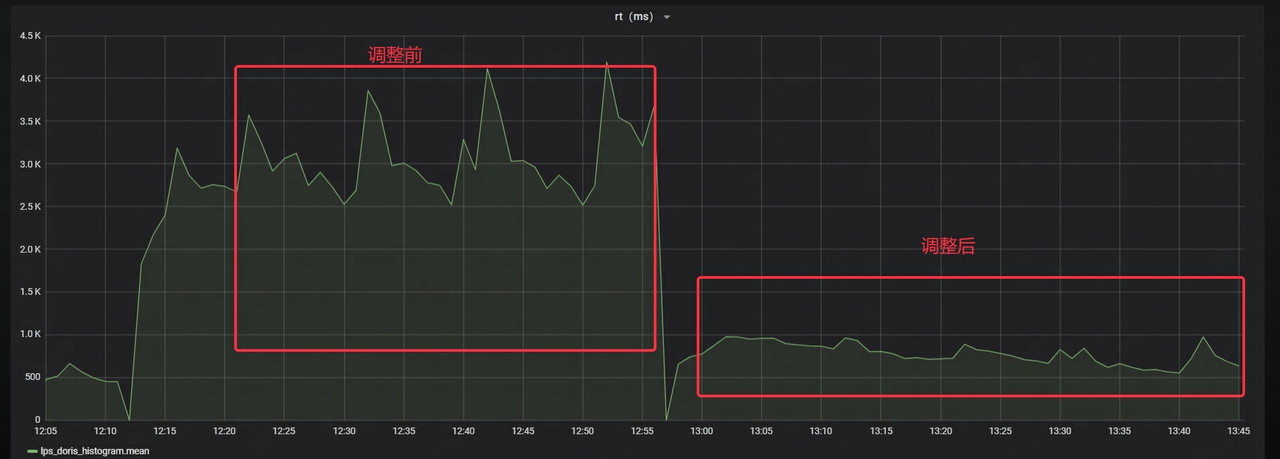
- The RT of Stream Load is reduced by about 70%
NetEase also carried out heavy stress testing and grayscale trial operation before the official launch. After continuous optimization work, it finally ensured that the system can run stably online in large-scale scenarios, providing strong support for the business.
1. Stream Load timeout:
At the beginning of the stress test, there was a problem of frequent timeout and error reporting of data import, and when the process and cluster status were normal, the monitoring could not collect BE's Metrics data normally.
Obtain the stack of Doris BE through Pstack, and use PT-PMT to analyze the stack. It was found that the main reason was that when the client initiated a request, neither the HTTP Chunked encoding nor the Content-Length was set, which caused Doris to mistakenly believe that the data transmission had not yet ended, and thus remained in a waiting state. After adding the Chunked encoding setting on the client, data import returned to normal.
2. The amount of data imported in a single time by Stream Load exceeds the threshold:
The problem is solved by increasing streaming_load_json_max_mbthe parameter to 250M (default 100M).
3. Insufficient copies and writing error: alive replica num 0 < quorum replica num 1
It show backendsis found that one BE has an abnormal status and is displayed as OFFLINE. Check the corresponding be_customconfiguration file and find it exists broken_storage_path. Further inspection of BE's log revealed that the error message indicated "too many open files", which means that the number of file handles opened by the BE process has exceeded the maximum set by the system, causing the IO operation to fail.
When the Doris system detects this anomaly, it marks the disk as unusable. Since the table is configured with a single-copy strategy, when there is a problem with the disk where the only copy is located, data cannot be continued to be written because the number of copies is insufficient.
Therefore, the maximum open limit of process FD was adjusted to 1 million, be_custom.confthe configuration file was deleted, the BE node was restarted, and the service finally resumed normal operation.
4. FE memory jitter
During the business grayscale test, the problem occurred that it could not connect to FE. By checking the monitoring data, it was found that the JVM 32G memory has been exhausted, and the bdb file directory in the FE meta directory has abnormally expanded to 50G.
Since the business has been performing highly concurrent Stream Load data import operations, and FE will record relevant Load information during the import process, the memory information generated by each import is approximately 200K. The cleaning time of these memory information streaming_label_keep_max_secondis controlled by parameters. The default value is 12 hours. After adjusting it to 5 minutes, the FE memory will not be exhausted. However, after running for a period of time, it is found that the memory jitters according to the 1 hour cycle, and the peak memory usage The rate reaches 80%. After analyzing the code, we found that the thread that cleans labels label_clean_interval_secondruns every other time. The default is 1 hour. After adjusting it to 5 minutes, the FE memory is very stable.
04 Query tuning
When the Lingxi-Eagle monitoring platform was performing query testing, it was suspected that it read results that did not meet the matching conditions. This phenomenon obviously did not comply with the expected retrieval logic. As shown in the first record below:
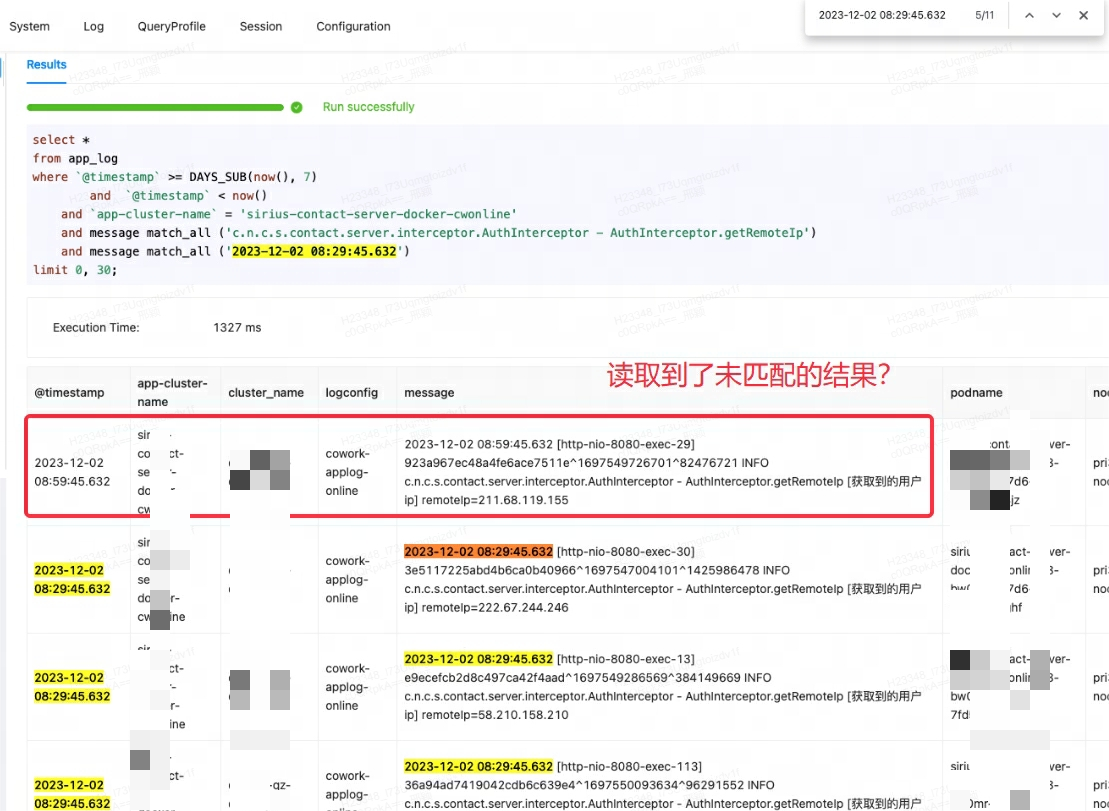
At first, I mistakenly thought it was a Doris bug, so I tried to search for similar issues and workarounds. However, after consulting community members and carefully reviewing official documents, it was discovered that the root of the problem was match_alla misunderstanding of the usage scenario.
match_allThe working principle of is that matching can be performed as long as word segmentation exists, and word segmentation is based on spaces or punctuation . In this case, match_allthe '29' in is matched with the '29' in the subsequent content of the first record, thus outputting unexpected results.
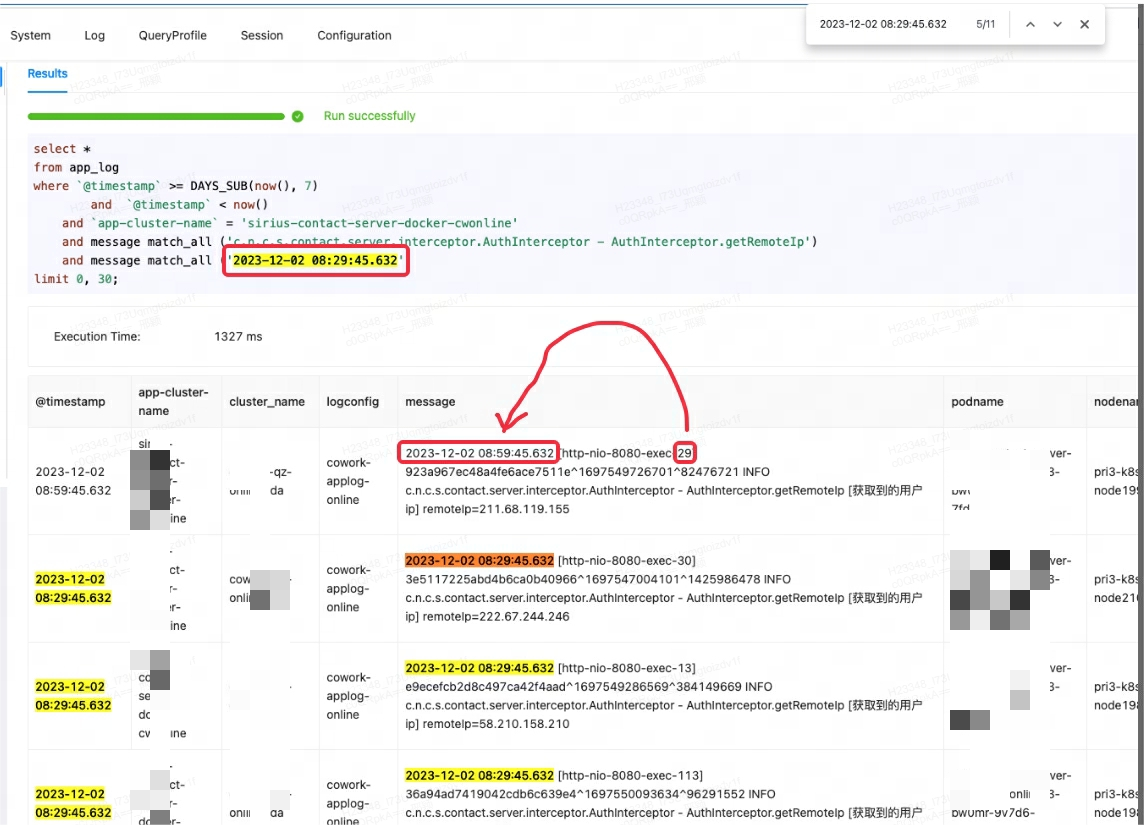
For this Case, the correct way is to use MATCH_PHRASEfor matching, MATCH_PHRASEwhich can meet the order requirements in the text.
-- 1.4 logmsg中同时包含keyword1和keyword2的行,并且按照keyword1在前,keyword2在后的顺序
SELECT * FROM table_name WHERE logmsg MATCH_PHRASE 'keyword1 keyword2';
When using MATCH_PHRASEmatching, you need to specify it when building the index support_phrase, otherwise the system will perform a full table scan and perform hard matching, resulting in poor query efficiency.
INDEX idx_name4(column_name4) USING INVERTED PROPERTIES("parser" = "english|unicode|chinese", "support_phrase" = "true")
For tables that have already written data, if you want to enable it support_phrase, you can DROP INDEXdelete the old index and then ADD INDEXadd a new index. This process is performed incrementally on the existing table without rewriting the data of the entire table, thus ensuring the efficiency of the operation.
Compared with Elasticsearch, Doris's index management method is more flexible and can quickly add or delete indexes according to business needs, providing greater convenience and flexibility.
Conclusion
The introduction of Apache Doris effectively meets NetEase's needs for logs and timing scenarios, and effectively solves the problems of high storage costs and low query efficiency of NetEase Lingxi Office and NetEase Cloud Letter's early log processing and analysis platforms.
在实际应用中,Apache Doris 以更低的服务器资源,承载了线上平均 500MB/s 、峰值超 1GB/s 的写入流量的平稳写入。同时,查询响应也得到了显著的提升,相较于 Elasticsearch ,查询效率至少提升了 11 倍。此外,Doris 具备更高的压缩比,存储资源相较之前可节约 70%。
Finally, special thanks to the SelectDB technical team for their continued support. In the future, NetEase will continue to promote Apache Doris and apply it in-depth in other big data scenarios of NetEase. At the same time, we also look forward to having in-depth exchanges with more business teams who are interested in Doris to jointly promote the development of Apache Doris.
Open source contributions
During the process of business implementation and problem troubleshooting, NetEase students actively practiced the open source spirit and contributed a series of valuable PRs to the Apache Doris community to promote the development and progress of the community:
- Stream Load Bug Fix
- Stream Load code optimization
- Hot and cold stratification to find suitable Rowset optimization
- Hot and cold stratification reduces invalid traversal
- Hot and cold tiered lock interval optimization
- Hot and cold stratified data filtering optimization
- Optimization of hot and cold stratification capacity judgment
- Hot and cold hierarchical sorting optimization
- FE error reporting standardization
- New
array_aggfunction - Aggregation function Bug Fix
- Execution plan bug fix
- TaskGroupManager optimization
- BE Crash Repair
- Document modification:
- https://github.com/apache/doris/pull/26958
- https://github.com/apache/doris/pull/26410
- https://github.com/apache/doris/pull/25082
- https://github.com/apache/doris/pull/25075
- https://github.com/apache/doris/pull/31882
- https://github.com/apache/doris/pull/30654
- https://github.com/apache/doris/pull/30304
- https://github.com/apache/doris/pull/29268