
Author: Xingji, Changjun, Youyi, Liutao
Introduction to the concept of container working memory WorkingSet
In the Kubernetes scenario, container memory real-time usage statistics (Pod Memory) are represented by WorkingSet working memory (abbreviated as WSS).
The indicator concept of WorkingSet is defined by cadvisor for container scenarios.
Working memory WorkingSet is also an indicator for Kubernetes scheduling decisions to determine memory resources, including node eviction.
WorkingSet calculation formula
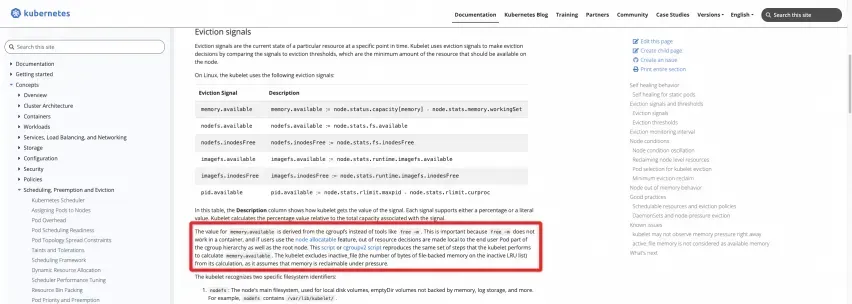
Official definition: refer to K8s official website documentation
https://kubernetes.io/docs/concepts/scheduling-eviction/node-pressure-eviction/#eviction-signals
The following two scripts can be run on the node to directly calculate the results:
CGroupV1
https://kubernetes.io/examples/admin/resource/memory-available.sh
#!/bin/bash
#!/usr/bin/env bash

# This script reproduces what the kubelet does
# to calculate memory.available relative to root cgroup.

# current memory usage
memory_capacity_in_kb=$(cat /proc/meminfo | grep MemTotal | awk '{print $2}')
memory_capacity_in_bytes=$((memory_capacity_in_kb * 1024))
memory_usage_in_bytes=$(cat /sys/fs/cgroup/memory/memory.usage_in_bytes)
memory_total_inactive_file=$(cat /sys/fs/cgroup/memory/memory.stat | grep total_inactive_file | awk '{print $2}')

memory_working_set=${memory_usage_in_bytes}
if [ "$memory_working_set" -lt "$memory_total_inactive_file" ];
then
    memory_working_set=0
else
    memory_working_set=$((memory_usage_in_bytes - memory_total_inactive_file))
fi

memory_available_in_bytes=$((memory_capacity_in_bytes - memory_working_set))
memory_available_in_kb=$((memory_available_in_bytes / 1024))
memory_available_in_mb=$((memory_available_in_kb / 1024))

echo "memory.capacity_in_bytes $memory_capacity_in_bytes"
echo "memory.usage_in_bytes $memory_usage_in_bytes"
echo "memory.total_inactive_file $memory_total_inactive_file"
echo "memory.working_set $memory_working_set"
echo "memory.available_in_bytes $memory_available_in_bytes"
echo "memory.available_in_kb $memory_available_in_kb"
echo "memory.available_in_mb $memory_available_in_mb"
CGroupV2
https://kubernetes.io/examples/admin/resource/memory-available-cgroupv2.sh
#!/bin/bash

# This script reproduces what the kubelet does
# to calculate memory.available relative to kubepods cgroup.

# current memory usage
memory_capacity_in_kb=$(cat /proc/meminfo | grep MemTotal | awk '{print $2}')
memory_capacity_in_bytes=$((memory_capacity_in_kb * 1024))
memory_usage_in_bytes=$(cat /sys/fs/cgroup/kubepods.slice/memory.current)
memory_total_inactive_file=$(cat /sys/fs/cgroup/kubepods.slice/memory.stat | grep inactive_file | awk '{print $2}')

memory_working_set=${memory_usage_in_bytes}
if [ "$memory_working_set" -lt "$memory_total_inactive_file" ];
then
    memory_working_set=0
else
    memory_working_set=$((memory_usage_in_bytes - memory_total_inactive_file))
fi

memory_available_in_bytes=$((memory_capacity_in_bytes - memory_working_set))
memory_available_in_kb=$((memory_available_in_bytes / 1024))
memory_available_in_mb=$((memory_available_in_kb / 1024))

echo "memory.capacity_in_bytes $memory_capacity_in_bytes"
echo "memory.usage_in_bytes $memory_usage_in_bytes"
echo "memory.total_inactive_file $memory_total_inactive_file"
echo "memory.working_set $memory_working_set"
echo "memory.available_in_bytes $memory_available_in_bytes"
echo "memory.available_in_kb $memory_available_in_kb"
echo "memory.available_in_mb $memory_available_in_mb"
Show me the code
As you can see, the working memory of the node's WorkingSet is the memory usage of the root cgroup, minus the cache of the Inactve(file) part. Similarly, the WorkingSet working memory of the container in the Pod is the cgroup memory usage corresponding to the container, minus the cache of the Inactve(file) part.
In the kubelet of the real Kubernetes runtime, the actual code of this part of the indicator logic provided by cadvisor is as follows:
From the cadvisor Code [ 1] , you can clearly see the definition of WorkingSet working memory:
The amount of working set memory, this includes recently accessed memory,dirty memory, and kernel memory. Working set is <= "usage".
And the specific code implementation of cadvisor's calculation of WorkingSet [ 2] :
inactiveFileKeyName := "total_inactive_file"
if cgroups.IsCgroup2UnifiedMode() {
  inactiveFileKeyName = "inactive_file"
}
workingSet := ret.Memory.Usage
if v, ok := s.MemoryStats.Stats[inactiveFileKeyName]; ok {
  if workingSet < v {
    workingSet = 0
  } else {
    workingSet -= v
  }
}
Common user problem cases of container memory issues
In the process of the ACK team providing service support for container scenarios to a large number of users, many customers have more or less encountered container memory problems when deploying their business applications in containers. After experiencing a large number of customer problems, the ACK team and the Alibaba Cloud operating system team have summarized the following common problems faced by users in terms of container memory:
FAQ 1: There is a gap between the memory usage of the host and the aggregated usage of the container by node. The host is about 40% and the container is about 90%.
Most likely, it is because the container's Pod is considered a WorkingSet, which contains caches such as PageCache.
The memory value of the host does not include Cache, PageCache, Dirty Memory, etc., while the working memory does include this part.
The most common scenarios are the containerization of JAVA applications, Log4J of JAVA applications, and its very popular implementation Logback. The default Appender will start using NIO very "simplely" and use mmap to use Dirty Memory. This causes the memory Cache to increase, thereby causing the Pod's working memory WorkingSet to increase.
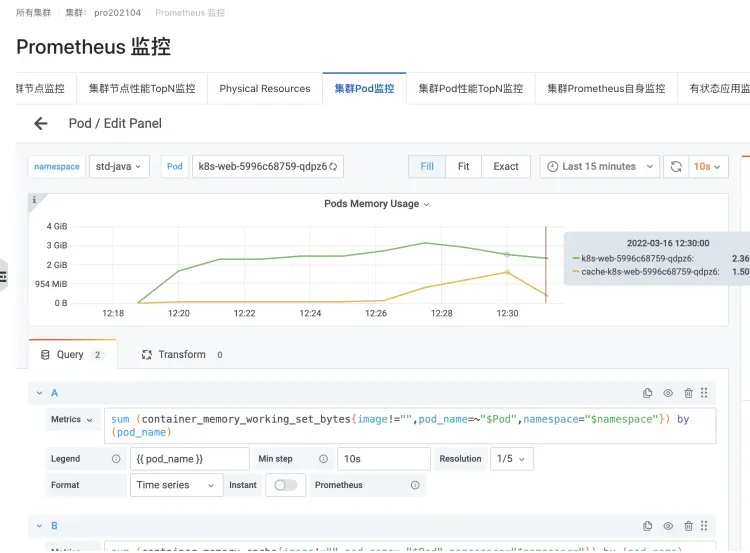
A JAVA application Pod's Logback logging scenario
Instances causing an increase in Cache memory and WorkingSet memory
FAQ 2: When executing the top command in a Pod, the value obtained is smaller than the working memory value (WorkingSet) viewed by kubectl top pod.
Execute the top command in the Pod. Due to issues such as container runtime isolation, the container isolation is actually broken and the top monitoring value of the host is obtained.
Therefore, what you see is the memory value of the host machine, which does not include Cache, PageCache, Dirty Memory, etc., while the working memory includes this part, so it is similar to FAQ 1.
FAQ 3: Pod memory black hole problem
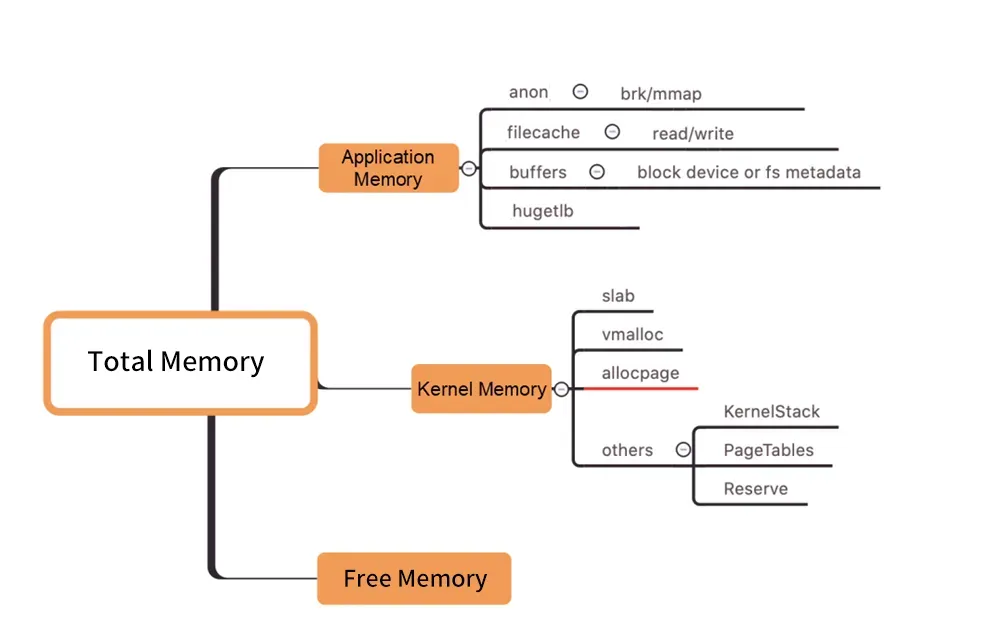
图/Kernel Level Memory Distribution
As shown in the figure above, the Pod WorkingSet working memory does not include Inactive (anno), and the other components of the Pod memory used by users do not meet expectations, which may eventually cause the WorkingSet workload to increase, eventually leading to Node Eviction. .
How to find the real cause of the increase in working memory among the many memory components is as blind as a black hole. ("Memory black hole" refers to this problem).
How to solve the WorkingSet high problem
Usually, memory recycling delays are accompanied by high working set memory usage. So how to solve this type of problem?
Direct expansion
Capacity planning (direct expansion) is a general solution to the problem of high resources.
"Memory black hole" - what to do if it is caused by deep memory costs (such as PageCache)
However, if you want to diagnose memory problems, you need to first dissect, gain insight, analyze, or in human terms, see clearly which piece of memory is held by whom (which process, or which specific resource such as a file). Then perform targeted convergence optimization to finally solve the problem.
Step one: Check the memory
First, how to analyze the operating system kernel-level container monitoring memory indicators? The ACK team cooperated with the operating system team to launch the SysOM (System Observer Monitoring) product function of container monitoring at the kernel layer of the operating system, which is currently unique to Alibaba Cloud. By viewing the Pod Memory Monitor in the SysOM Container System Monitoring-Pod dimension , you can Insight into the detailed memory usage distribution of Pod, as shown below:
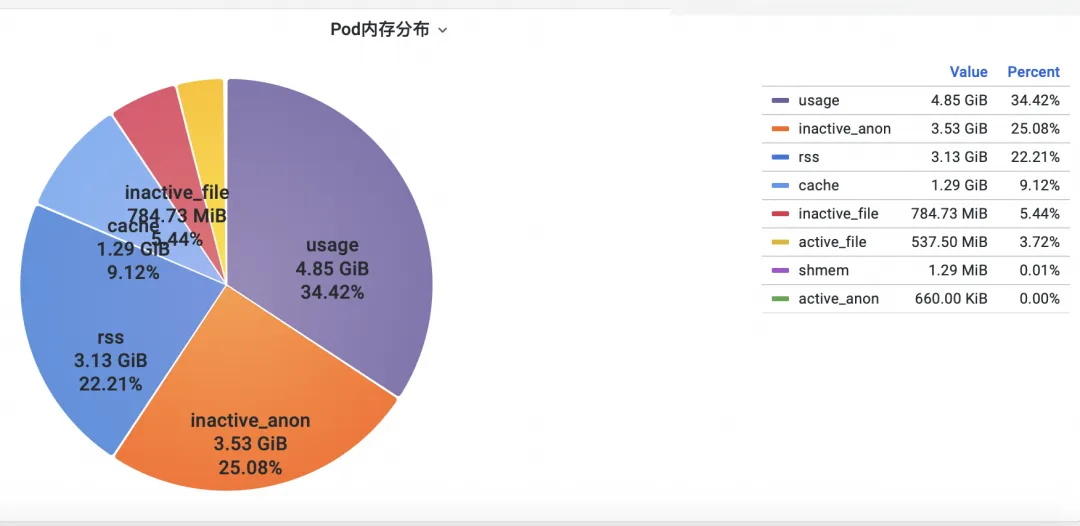
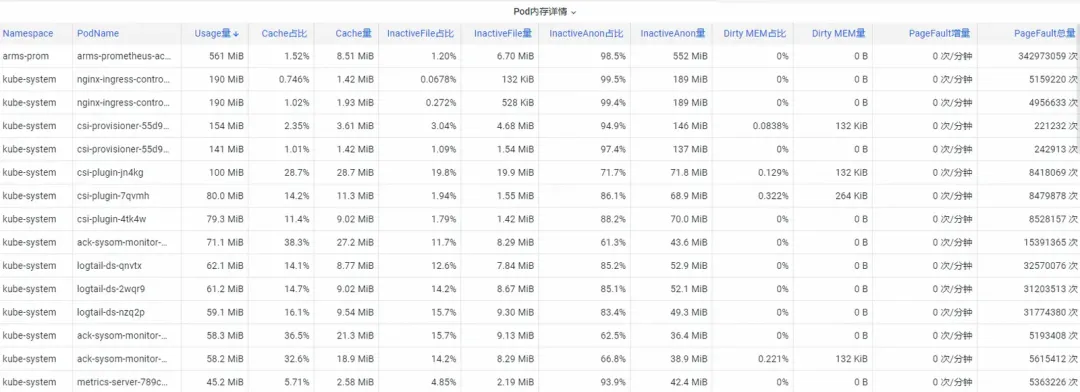
SysOM container system monitoring can view the detailed memory composition of each Pod at a granular level. Through the monitoring and display of different memory components such as Pod Cache (cache memory), InactiveFile (inactive file memory usage), InactiveAnon (inactive anonymous memory usage), Dirty Memory (system dirty memory usage), common Pod memory black hole problems are discovered.
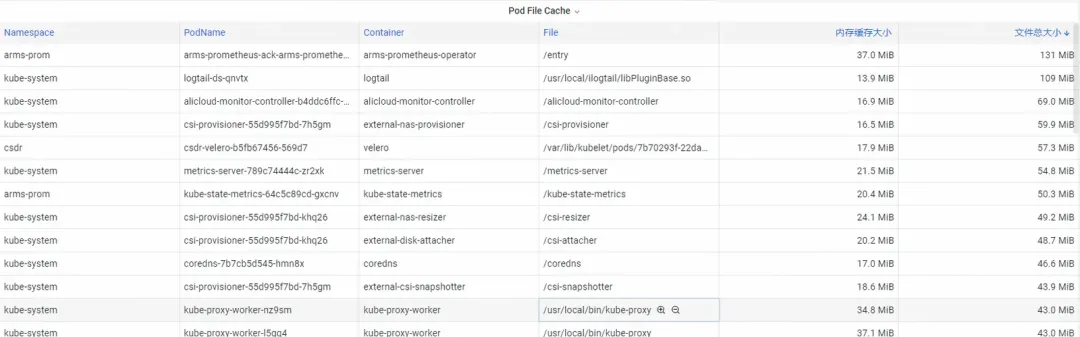
For Pod File Cache, you can monitor the PageCache usage of the currently opened and closed files of the Pod at the same time (deleting the corresponding files can release the corresponding Cache memory).
Step 2: Optimize memory
There are many deep-seated memory consumptions that users cannot easily converge even if they see them clearly. For example, PageCache and other memory that are uniformly reclaimed by the operating system require users to make intrusive changes to the code, such as adding flush() to the Appender of Log4J. to call sync() periodically.
https://stackoverflow.com/questions/11829922/logback-file-appender-doesnt-flush-immediately
This is very unrealistic.
The ACK container service team launched the Koordinator QoS fine-grained scheduling function .
Implemented on Kubernetes to control the memory parameters of the operating system:
When differentiated SLO co-location is enabled in the cluster, the system will prioritize the memory QoS of latency-sensitive LS (Latency-Sensitive) Pods and delay the timing of LS Pods triggering memory recycling on the entire machine.
In the figure below, memory.limit_in_bytes represents the upper limit of memory usage, memory.high represents the memory current limit threshold, memory.wmark_high represents the memory background recycling threshold, and memory.min represents the memory usage locking threshold.
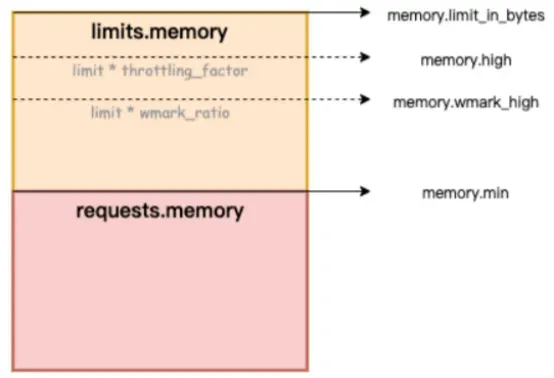
Figure/ack-koordinator provides memory QoS (Quality of Service) guarantee capabilities for containers
How to fix the memory black hole problem? Alibaba Cloud Container Service uses the refined scheduling function and relies on the Koordinator open source project. ack-koordinator provides memory service quality QoS (Quality of Service) guarantee capabilities for containers, improving the fairness of memory resources on the premise of ensuring the fairness of memory resources. The memory performance of the application at runtime. This article introduces the container memory QoS function. For detailed instructions, please refer to Container Memory QoS [ 3] .
Containers mainly have the following two constraints when using memory:
1) Own memory limit: When the container's own memory (including PageCache) approaches the container's upper limit, container-dimensional memory recycling will be triggered. This process will affect the memory application and release performance of applications within the container. If the memory request cannot be satisfied, the container OOM will be triggered.
2) Node memory limit: When the container memory is oversold (Memory Limit>Request) and the entire machine has insufficient memory, it will trigger global memory recycling in the node dimension. This process has a great impact on performance, and in extreme cases, even causes the entire machine to be abnormal. If there is insufficient recycling, the container will be selected for OOM Kill.
To address the above typical container memory issues, ack-koordinator provides the following enhanced features:
1) Container memory background recycling water level: When the Pod memory usage is close to the Limit limit, a part of the memory will be asynchronously recycled in the background to alleviate the performance impact caused by direct memory recycling.
2) Container memory lock recycling/limiting water level: Implement fairer memory recycling between Pods. When the memory resources of the entire machine are insufficient, priority will be given to recycling memory from Pods with memory overuse (Memory Usage>Request) to avoid individual Pods causing overall failure. The quality of machine memory resources has deteriorated.
3) Differentiated guarantee of overall memory recycling: In the BestEffort memory oversold scenario, priority is given to ensuring the memory running quality of Guaranteed/Burstable Pods.
For details on the kernel capabilities enabled by ACK container memory QoS, see Alibaba Cloud Linux's Kernel Functions and Interface Overview [ 4] .
After the container memory black hole problem is discovered through the first step of observation, the ACK fine scheduling function can be combined with the targeted selection of memory-sensitive Pods to enable the container memory QoS function to complete the closed-loop repair.
Reference documentation:
[1] ACK SysOM function description document
[2] Best Practice Documentation
[3] Chinese Dragon Lizard Community
https://mp.weixin.qq.com/s/b5QNHmD_U0DcmUGwVm8Apw
[4] International station English
https://www.alibabacloud.com/blog/sysom-container-monitoring-from-the-kernels-perspective_600792
Related Links:
[1] cadvisor Code
[2] Specific code implementation of WorkingSet calculation by cadvisor
[3] Container memory QoS
https://help.aliyun.com/zh/ack/ack-managed-and-ack-dedicated/user-guide/memory-qos-for-containers
[4] Overview of kernel functions and interfaces of Alibaba Cloud Linux
https://help.aliyun.com/zh/ecs/user-guide/overview-23
Microsoft's China AI team collectively packed up and went to the United States, involving hundreds of people. How much revenue can an unknown open source project bring? Huawei officially announced that Yu Chengdong's position was adjusted. Huazhong University of Science and Technology's open source mirror station officially opened external network access. Fraudsters used TeamViewer to transfer 3.98 million! What should remote desktop vendors do? The first front-end visualization library and founder of Baidu's well-known open source project ECharts - a former employee of a well-known open source company that "went to the sea" broke the news: After being challenged by his subordinates, the technical leader became furious and rude, and fired the pregnant female employee. OpenAI considered allowing AI to generate pornographic content. Microsoft reported to The Rust Foundation donated 1 million US dollars. Please tell me, what is the role of time.sleep(6) here?