Sonarqube Web management interface is simple and elegant design, but also very intuitive, but due to the many functions, this is a challenge for fast start and quickly locate the desired function, after a few sections where we briefly.
OwerView (Overview)
The main interface shows an overview of statistical information project of lint
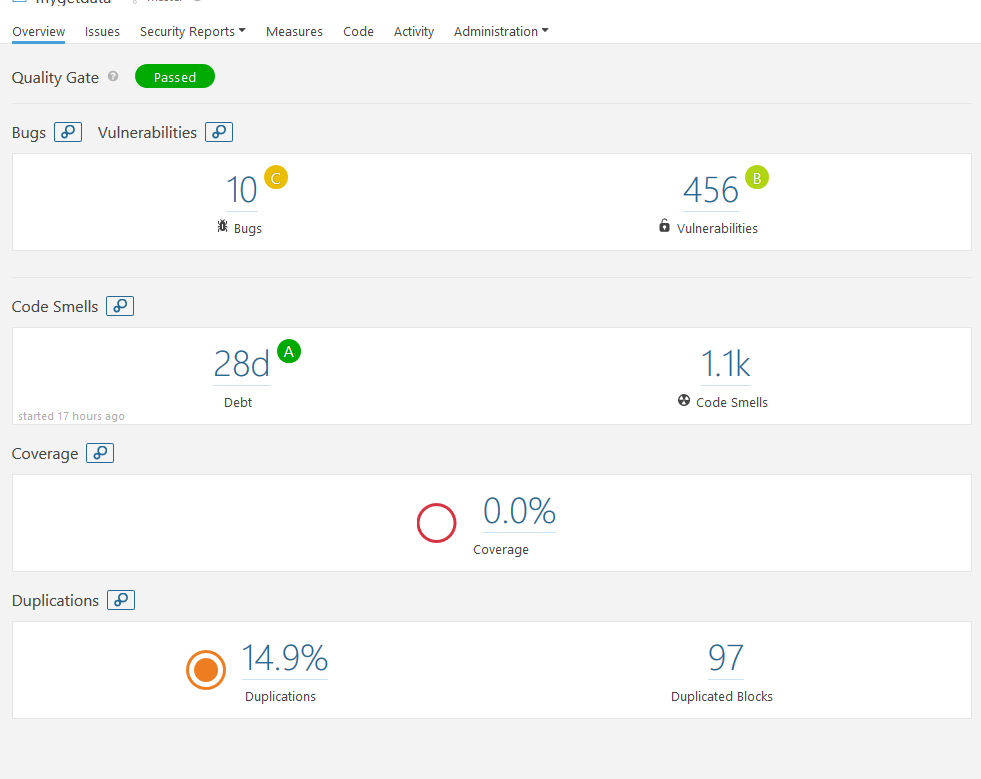
You can see these columns columns are mostly statistics, and with a link, click on the link you can see the details. In fact, next to some of the statistics columns with circled letters, these letters, quality from A to E followed by decline, the color gradually change from green to red. project managers an overview of the health status of a subject based on these ratings and colors.
Where the unit test coverage is 0%, because the unit test coverage report requires additional integration, we will describe how integrated unit test coverage report in later chapters.

You can see the column heading back there is a similar bubble icon, click on the icon to enter the chart display interface as follows:
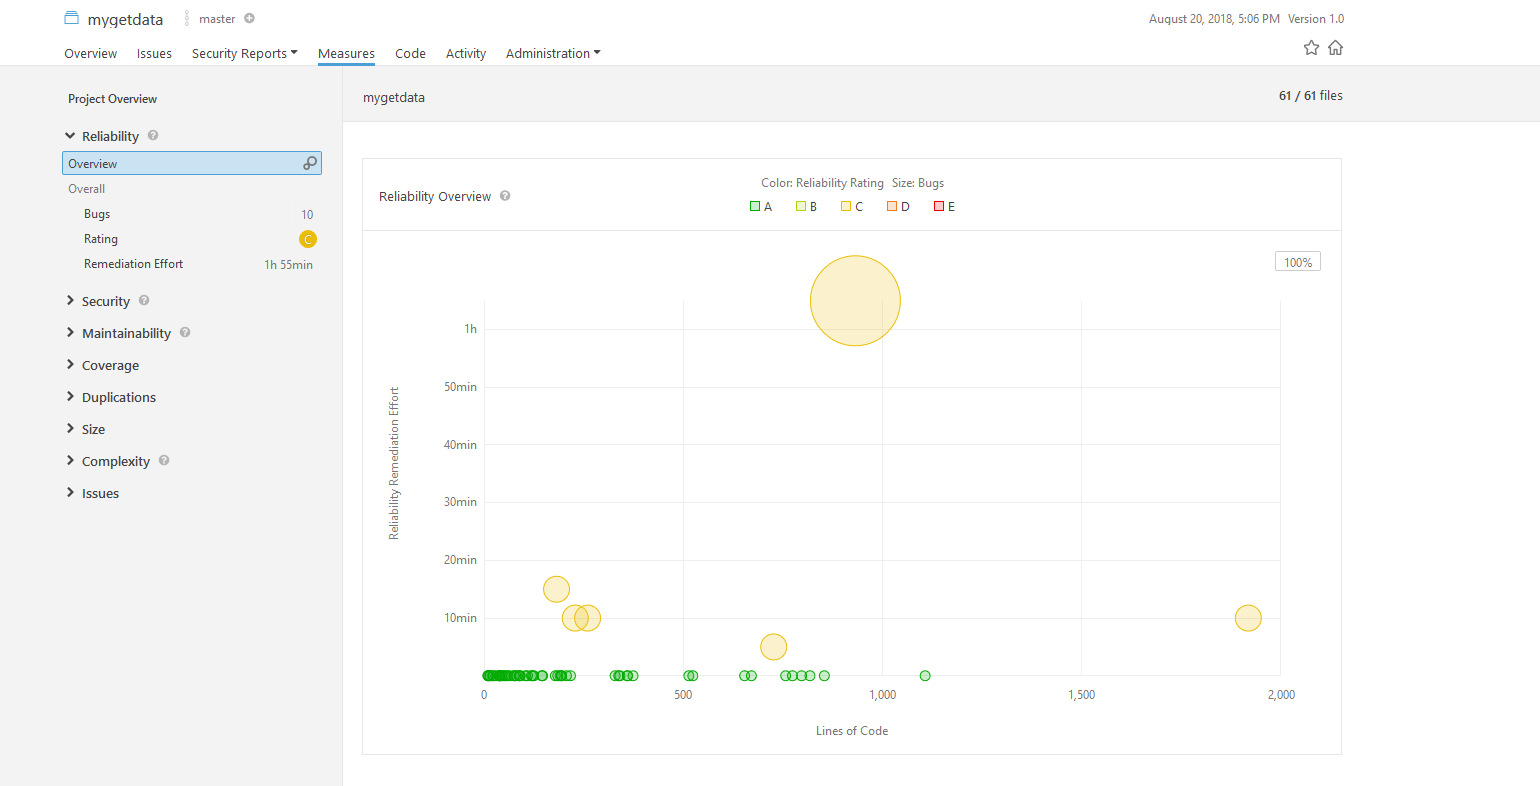
Beginning to see this chart may feel confused and do not know what, in fact, very easy to see. On behalf of a circle the size of a class how many bug, and we move the mouse to the largest circle on the map, the mouse pointer changes to a hand like, which occur when a suspension of the panel shown below
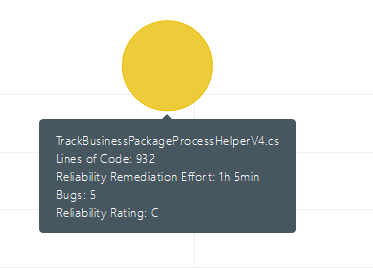
Through this panel we can bug the class name, the number of bug, see ratings and other information appear. The color indicates the severity of the bug. Through this chart panel, the administrator can easily see the bug and distribution, in order to make decisions .
Code tag
The interface with the same level of navigation tabs Overview labels as well Issues, Measure, Code, Activity, etc. Among Issues to solve the main panel of the bug, we will use a single one is concerned, here tell us about the codecontents of the tag.
We click on the code label, which reads as follows
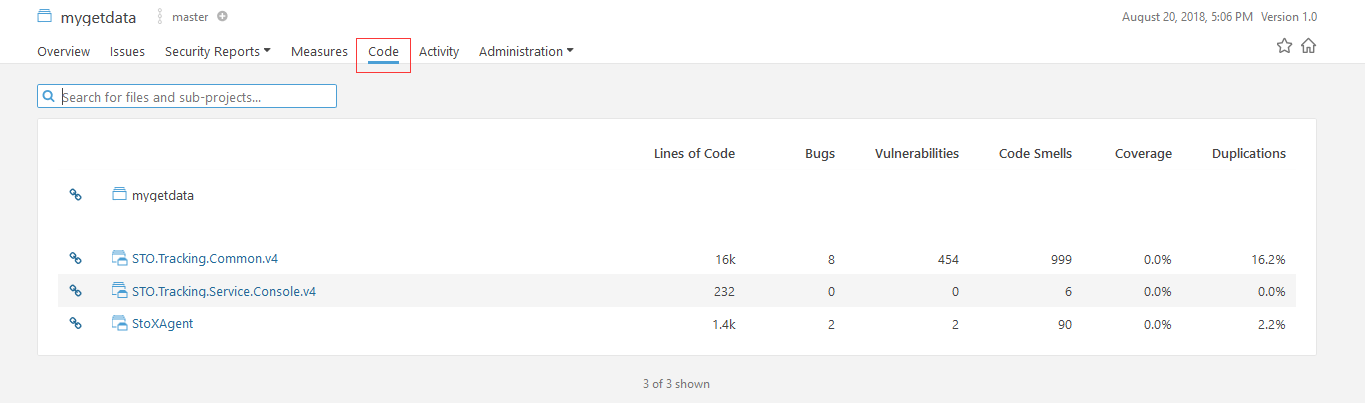
It can be seen here is the source code by item name to the division (where each project and a project csproj correspondence), so we can easily navigate to your own code. And we can also search field, enter the name of the class quickly navigate to a particular class.
We click on the class name into a certain category, you can see its code, as shown below
 )
)
We can clearly see the number of lines of code in this file, the number of issues and coverage by the information bar at the top right.
Flip down we can see the following contents icon
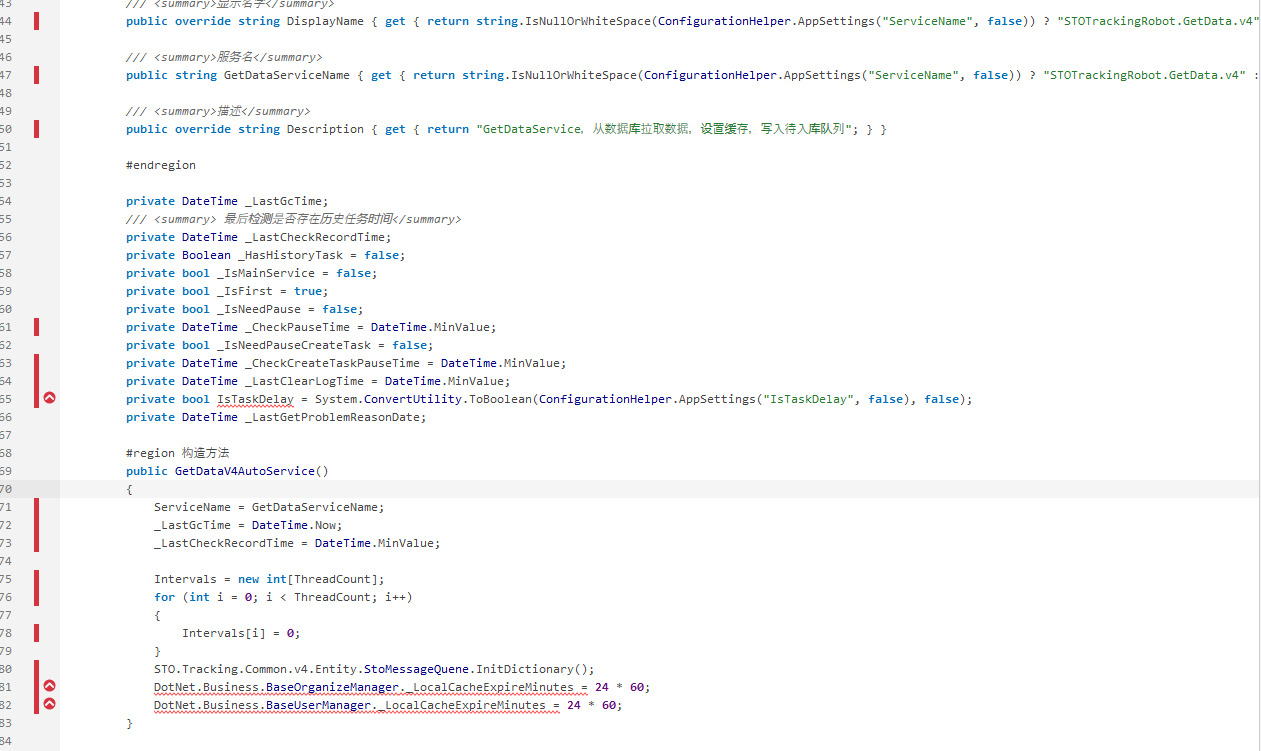
The red vertical bar represents the unit tests are not covered, because we have not integrated unit testing, so here temporarily to ignore.
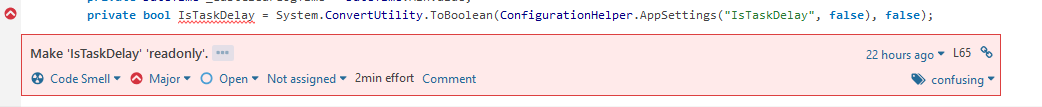
Logo red circle with a red bar on the right side of the issue was required treatment. We click on a red circle appears floating window displays described problems and proposed changes, and the like.