Abstract: 이 글은 주로 커널에서 특정 처리를 통해 작업이 중단되지 않도록 하는 방법에 대해 설명합니다.이론적으로 사용자가 실행한 SQL이 사용하는 메모리(dynamic_used_memory)는 큰 범위에서 max_dynamic_memory의 메모리를 초과하지 않습니다.
이 문서는 Huawei 클라우드 커뮤니티 " Gaussdb(DWS) 메모리 오류 문제 해결 방법 ", 저자: fightman에서 공유됩니다.
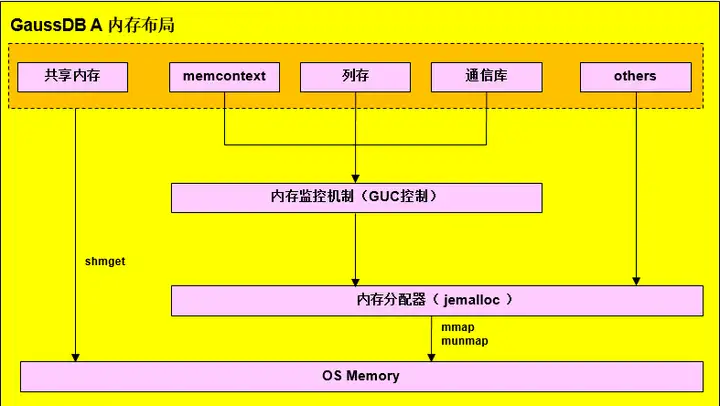
Gaussdb 메모리 레이아웃
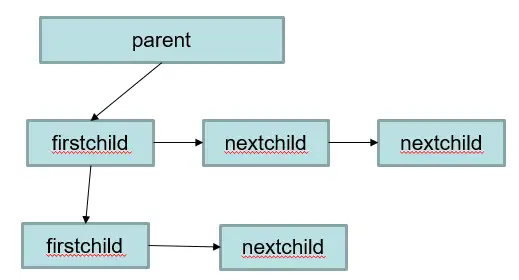
메모리 컨텍스트 memoryContext 메모리 구조
1. 메모리 문제 위치 찾기 방법
분석 시나리오 1: 오류: 메모리를 일시적으로 사용할 수 없습니다가 데이터베이스 로그에 나타납니다.
오류 메시지에서 메모리가 부족한 노드를 확인할 수 있습니다(예: dn_6003_6004: 메모리를 일시적으로 사용할 수 없습니다. 이는 dn_6003의 메모리가 부족함을 의미합니다).
1. 로그 분석에서
dn에 해당하는 로그를 관찰합니다. "데이터베이스 메모리 제한에 도달"했는지 여부는 데이터베이스의 논리적 메모리 관리 메커니즘 보호로 인해 발생했으며 데이터베이스 보기를 추가로 분석해야 함을 의미합니다. "OS 메모리 제한에 도달"하는 경우 운영 체제의 메모리 할당이 실패하면 운영 체제 매개변수 구성 및 메모리 하드웨어 조건을 확인해야 합니다.
1) 데이터베이스 메모리 한계 도달 예
----debug_query_id=76279718689098154, memory allocation failed due to reaching the database memory limitation. Current thread is consuming about 10 MB, allocating 240064 bytes.
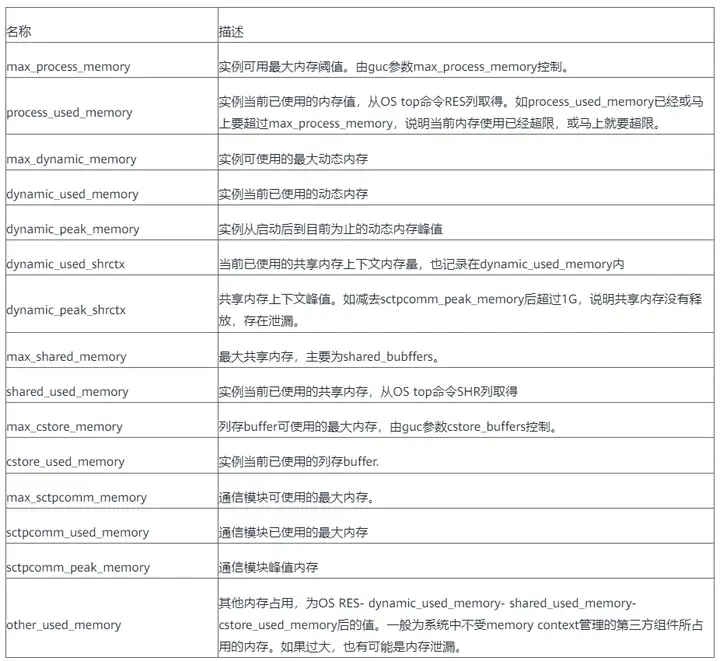
----debug_query_id=76279718689098154, Memory information of whole process in MB:max_dynamic_memory: 18770, dynamic_used_memory: 18770, dynamic_peak_memory: 18770, dynamic_used_shrctx: 1804, dynamic_peak_shrctx: 1826, max_sctpcomm_memory: 4000, sctpcomm_used_memory: 1786, sctpcomm_peak_memory: 1786, comm_global_memctx: 0, gpu_max_dynamic_memory: 0, gpu_dynamic_used_memory: 0, gpu_dynamic_peak_memory: 0, large_storage_memory: 0, process_used_memory: 22105, cstore_used_memory: 1022, shared_used_memory: 2605, other_used_memory: 0, os_totalmem: 257906, os_freemem: 16762.이때 작업 76279718689098154는 240064바이트의 메모리를 신청하려고 하고 dynamic_used_memory 메모리 값은 18770MB이며 둘의 합이 max_dynamic_memory(18770MB)보다 커서 데이터베이스 제한을 초과하여 메모리 신청이 실패합니다.
811 이후 버전은 top3 memoryContext 메모리 사용량도 인쇄합니다. 예는 다음과 같습니다.
----debug_query_id=72339069014641088, sessId: 1670914731.140604465997568.coordinator1, sessType: postgres, contextName: ExprContext, level: 5, parent: FunctionScan_140604465997568, totalSize: 950010640, freeSize: 0, usedSize: 950010640
----debug_query_id=72339069014641053, pid=140604465997568, application_name=gsql, query=select * from pv_total_memory_detail, state=retrying, query_start=2022-12-13 14:59:22.059805+08, enqueue=no waiting queue, connection_info={"driver_name":"gsql","driver_version":"(GaussDB 8.2.0 build bc4cec20) compiled at 2022-12-13 14:45:14 commit 3629 last mr 5138 debug","driver_path":"/data3/x00574567/self/gaussdb/mppdb_temp_install/bin/gsql","os_user":"x00574567"}
----debug_query_id=72339069014641088, sessId: 1670914731.140604738627328.coordinator1, sessType: postgres, contextName: ExprContext, level: 5, parent: FunctionScan_140604738627328, totalSize: 900010080, freeSize: 0, usedSize: 900010080
----debug_query_id=72339069014641057, pid=140604738627328, application_name=gsql, query=select * from pv_total_memory_detail, state=retrying, query_start=2022-12-13 14:59:22.098775+08, enqueue=no waiting queue, connection_info={"driver_name":"gsql","driver_version":"(GaussDB 8.2.0 build bc4cec20) compiled at 2022-12-13 14:45:14 commit 3629 last mr 5138 debug","driver_path":"/data3/x00574567/self/gaussdb/mppdb_temp_install/bin/gsql","os_user":"x00574567"}
----debug_query_id=72339069014641088, sessId: 1670914731.140603779163904.coordinator1, sessType: postgres, contextName: ExprContext, level: 5, parent: FunctionScan_140603779163904, totalSize: 890009968, freeSize: 0, usedSize: 890009968
----debug_query_id=72339069014641058, pid=140603779163904, application_name=gsql, query=select * from pv_total_memory_detail, state=retrying, query_start=2022-12-13 14:59:22.117463+08, enqueue=no waiting queue, connection_info={"driver_name":"gsql","driver_version":"(GaussDB 8.2.0 build bc4cec20) compiled at 2022-12-13 14:45:14 commit 3629 last mr 5138 debug","driver_path":"/data3/x00574567/self/gaussdb/mppdb_temp_install/bin/gsql","os_user":"x00574567"}
----allBackendSize=34, idleSize=7, runningSize=7, retryingSize=20
중요 필드 설명:
sessId: 스레드 시작 시간 + 스레드 ID(문자열 정보는 timestamp.threadid)
sessType: 스레드 이름
contextName: 메모리 컨텍스트 이름
totalSize: 메모리 사용량 크기, 단위 Byte
freeSize: 현재 memoryContext에서 해제한 총 메모리 양(바이트)
usedSize: 현재 memoryContext에서 사용하는 총 메모리 양(바이트)
application_name: 이 백엔드에 연결된 애플리케이션의 이름
쿼리: 쿼리 문
enqueue: 대기열 상태
allBackendSize: 총 스레드 수, idleSize: 유휴 스레드 수, runningSize: 활성 스레드 수, retryingSize: 재시도된 스레드 수
데이터베이스는 또한 복잡한 작업의 예상 메모리가 사용된 실제 메모리를 초과하는지 확인하기 위해 복잡한 작업을 확인하고, 그렇다면 분석을 위해 다음 정보를 인쇄합니다.
----debug_query_id=76279718689098154, Total estimated Memory is 15196 MB, total current cost Memory is 16454 MB, the difference is 1258 MB.The count of complicated queries is 17 and the count of uncontrolled queries is 1.위의 정보는 모든 복잡한 작업이 15196MB의 메모리를 사용할 것으로 예상되지만 실제 사용량은 16454MB로 1258MB를 초과함을 나타냅니다.
17개의 복잡한 작업이 있으며 그 중 하나는 실제로 예상보다 많은 메모리를 사용합니다.
----debug_query_id=76279718689098154, The abnormal query thread id 140664667547392.It current used memory is 13618 MB and estimated memory is 1102 MB.It also is the query which costs the maximum memory.위의 정보를 보면 비정상 스레드 ID는 140664667547392이고 이 스레드의 예상 메모리 사용량은 1102MB이지만 실제 메모리 사용량은 13618MB임을 알 수 있습니다.
----debug_query_id=76279718689098154, It is not the current session and beentry info : datid<16389>, app_name<cn_5001>, query_id<76279718688746485>, tid<140664667547392>, lwtid<173496>, parent_tid<0>, thread_level<0>, query_string<explainperformance with ws as (select d_year AS ws_sold_year, ws_item_sk, ws_bill_customer_sk ws_customer_sk, sum(ws_quantity) ws_qty, sum(ws_wholesale_cost) ws_wc, sum(ws_sales_price) ws_sp from web_sales left join web_returns on wr_order_number=ws_order_number and ws_item_sk=wr_item_sk join date_dim on ws_sold_date_sk = d_date_sk where wr_order_number is null group by d_year, ws_item_sk, ws_bill_customer_sk ), cs as (select d_year AS cs_sold_year, cs_item_sk, cs_bill_customer_sk cs_customer_sk, sum(cs_quantity) cs_qty, sum(cs_wholesale_cost) cs_wc, sum(cs_sales_price) cs_sp from catalog_sales left join catalog_returns on cr_order_number=cs_order_number and cs_item_sk=cr_item_sk join date_dim on cs_sold_date_sk =d_date_sk where cr_order_number is null group by d_year, cs_item_sk, cs_bill_customer_sk ), ss as (select d_year AS ss_sold_year, ss_item_sk, ss_customer_sk, sum(ss_quantity) ss_qty, sum(ss_wholesale_cost) ss_wc, sum(ss_sales_price) ss_spfrom store_sales left join store_returns on sr_ticket_numbe>.위의 정보는 메모리 사용량이 예상 메모리를 초과하는 작업 정보의 sql 정보를 더 표시하며, 여기서 datid는 데이터베이스의 OID를 나타내고 app_name은 응용 프로그램 이름을 나타내고 query_string은 쿼리 sql을 나타냅니다.
----debug_query_id=76279718689098154, WARNING: the common memory context 'HashContext' is using 1059 MB size larger than 989 MB.----debug_query_id=76279718689098154, WARNING: the common memory context 'VecHashJoin_76279718688746485_6' is using 12359 MB size larger than 10 MB.위의 정보는 memcontext가 한계를 초과했음을 나타냅니다.쿼리 번호 76279718689098154에서 메모리 컨텍스트 사전 설정 값의 최대 값은 989MB이며 실제로 1059MB가 사용됩니다.
2) OS 메모리 제한에 도달
GaussDB의 메모리 사용량이 GUC의 해당 파라미터 제한을 준수하지만 운영 체제의 사용 가능한 메모리가 부족한 경우 1.1과 유사한 로그 메시지가 표시되며 형식은 다음과 같습니다.
----debug_query_id=%lu, FATAL: memory allocation failed due to reaching the OS memory limitation. Current thread is consuming about %d MB, allocating %ld bytes.
----debug_query_id=%lu, Please check the sysctl configuration and GUC variable max_process_memory.
----debug_query_id=%lu, Memory information of whole process in MB:"
                            "max_dynamic_memory: %d, dynamic_used_memory: %d,
dynamic_peak_memory: %d, dynamic_used_shrctx: %d,
dynamic_peak_shrctx: %d, max_sctpcomm_memory: %d,
sctpcomm_used_memory: %d, sctpcomm_peak_memory: %d,
comm_global_memctx: %d, gpu_max_dynamic_memory: %d,
gpu_dynamic_used_memory: %d,
gpu_dynamic_peak_memory: %d, large_storage_memory: %d,
process_used_memory: %d, cstore_used_memory: %d,
shared_used_memory: %d, other_used_memory: %d,
os_totalmem: %d, os_freemem: %d
그중 os_totalmem은 현재 OS의 전체 메모리, 즉 "free" 명령의 전체 정보입니다. os_freemem은 현재 OS에서 사용 가능한 메모리, 즉 "free" 명령의 여유 정보입니다.
첫 번째 로그의 "%ld 바이트 할당"에서 요청하는 메모리가 세 번째 로그의 "os_freemem" 항목보다 크고 다른 이상 없이 데이터베이스를 실행할 수 있으면 예상대로 OS 메모리가 부족함을 나타냅니다. 불충분하다.
2. 각 인스턴스의 메모리 사용량에 대해 pgxc_total_memory_detail 쿼리
메모리 오류가 보고된 후 해당 문장이 사용하던 메모리가 해제되는데 이때 많은 메모리를 점유하고 있던 문장이 오류 보고로 인해 유실될 수 있으며 질의 메모리 뷰를 질의할 수 없다.
with a as (select *from pgxc_total_memory_detail where memorytype='dynamic_used_memory'), b as(select * from pgxc_total_memory_detail wherememorytype='dynamic_peak_memory'), c as (select * from pgxc_total_memory_detailwhere memorytype='max_dynamic_memory'), d as (select * frompgxc_total_memory_detail where memorytype='process_used_memory'), e as (select* from pgxc_total_memory_detail where memorytype='other_used_memory'), f as(select * from pgxc_total_memory_detail where memorytype='max_process_memory')select a.nodename,a.memorymbytes as dynamic_used_memory,b.memorymbytes asdynamic_peak_memory,c.memorymbytes as max_dynamic_memory,d.memorymbytes asprocess_used_memory,e.memorymbytes as other_used_memory,f.memorymbytes asmax_process_memory from a,b,c,d,e,f where a.nodename=b.nodename andb.nodename=c.nodename and c.nodename=d.nodename and d.nodename=e.nodename ande.nodename=f.nodename order by a.nodename;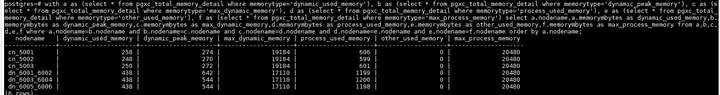
이 뷰를 쿼리할 때 메모리가 부족하여 메모리를 일시적으로 사용할 수 없다고 보고하여 뷰를 사용할 수 없게 될 수 있습니다. 이 경우 disable_memory_protect를 off로 설정해야 합니다.
set disable_memory_protect=off; 이후에는 뷰를 쿼리할 때 오류가 보고되지 않습니다.
위의 뷰를 통해 클러스터 내 어떤 노드가 메모리 사용량이 비정상적인지 파악한 후 해당 노드에 연결하여 pv_session_memory_detail 뷰를 통해 문제가 있는 메모리 컨텍스트를 찾을 수 있습니다.
SELECT * FROM pv_session_memory_detail ORDER BY totalsize desc LIMIT 100;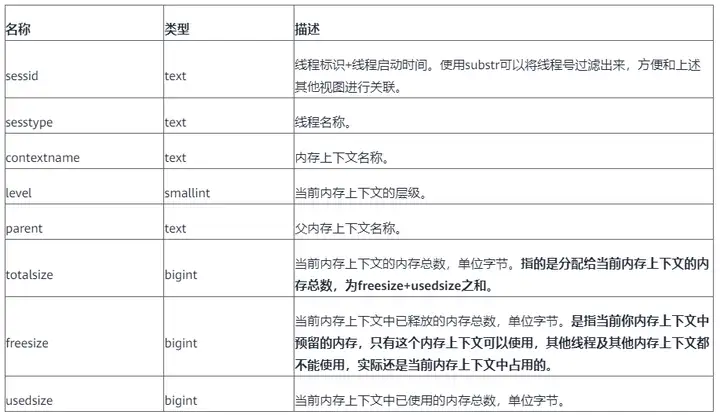
pg_stat_activity 보기와 결합하여 가장 많은 memcontext를 사용하는 명령문을 찾을 수 있습니다.
select sessid, contextname, level,parent, pg_size_pretty(totalsize) as total ,pg_size_pretty(freesize) as freesize, pg_size_pretty(usedsize) as usedsize, datname,query_id, query from pv_session_memory_detail a , pg_stat_activity b where split_part(a.sessid,'.',2) = b.pid order by totalsize desc limit 100;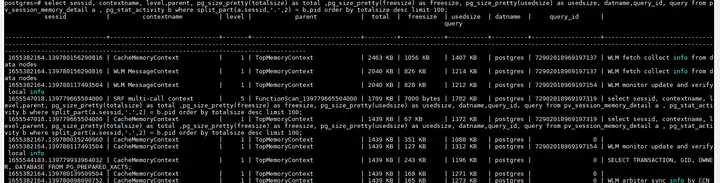
비상 복구
EXECUTE DIRECT ON(cn_5001) 'SELECT pg_terminate_backend(139780156290816)';2. 메모리 사용량이 많은 시나리오 분석
1. 너무 많은 유휴 연결은 메모리 사용으로 이어집니다.
메모리 사용량이 많은 인스턴스를 먼저 확인하고 확인 방법은 위와 같이 pgxc_total_memory_detail을 쿼리한 후 cn 또는 dn에 연결하여 다음 sql을 쿼리합니다.
select b.state, sum(totalsize) as totalsize, sum(freesize) as freesize, sum(usedsize) as usedsize from pv_session_memory_detail a , pg_stat_activity b where split_part(a.sessid,'.',2) = b.pid group by b.state order by totalsize desc limit 100;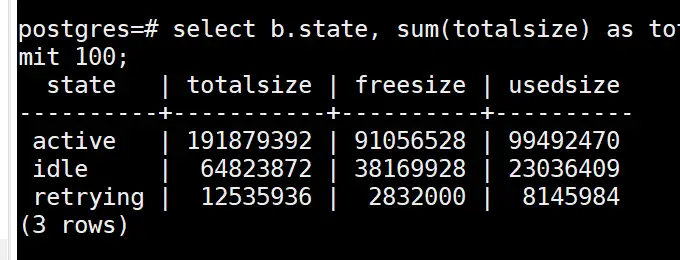
위 그림에서 유휴 상태의 totalsize가 많은 메모리를 차지하는 경우 유휴 상태의 유휴 연결을 정리하여 메모리를 해제할 수 있습니다.
솔루션: 유휴 상태에서 유휴 연결 정리
CLEAN CONNECTION TO ALL FORCE FOR DATABASE xxxx;clean connection은 pg_pooler_status에서 in_used 상태가 f인 유휴 연결만 정리할 수 있지만 in_used 상태가 t인 연결은 정리할 수 없습니다. In_used는 t입니다. 일반적으로 pbe 문이 실행되고 cn 및 dn의 유휴 연결은 출시된.
위의 방법으로 정리할 수 없는 경우 cn과 클라이언트 간의 연결을 정리한 다음 clean connection을 실행하여 cn과 dn 간의 연결을 정리하면 cn에서 유휴 연결을 찾을 수 있습니다. 이 작업은 cn을 중단합니다. 클라이언트와 연결하려면 클라이언트와 실행 가능 여부를 확인해야 합니다.
select 'execute direct on ('||coorname||') ''select pg_terminate_backend('||pid||')'';' from pgxc_stat_activity where usename not in ('Ruby', 'omm') and state='idle';선택 결과를 순차적으로 실행합니다.
2. 문장이 메모리를 너무 많이 점유한다 1단계의 첫 번째 문장이 활성 상태의 문장을 쿼리하여 많은 양의 메모리를 점유한다면 실행 중인 문장이 점유하고 있는 메모리가 너무 많은 메모리에 기인한다는 것을 의미한다.
메모리를 많이 차지하는 명령문을 찾기 위해 아래 명령문을 쿼리하십시오.
select b.state as state, a.sessid as sessid, b.query_id as query_id, substr(b.query,1,100) as query, sum(totalsize) as totalsize, sum(freesize) as freesize, sum(usedsize) as usedsize from pv_session_memory_detail a , pg_stat_activity b where split_part(a.sessid,'.',2) = b.pid and usename not in ('Ruby', 'omm') group by state,sessid,query_id,query order by totalsize desc limit 100;문을 찾은 후 query_id에 따라 해당 cn의 비정상적인 sql을 검색하여 kill
3. dynamic_used_shrctx는 더 많은 메모리를 사용합니다.
dynamic_used_shrctx는 공유 메모리 컨텍스트에서 사용하는 메모리로, 이 메모리도 MemoryContext로 나누어 스레드 간에 공유됩니다. pg_shared_memory_detail 뷰를 통해 보기
select * from pg_shared_memory_detail order by totalsize desc limit 10;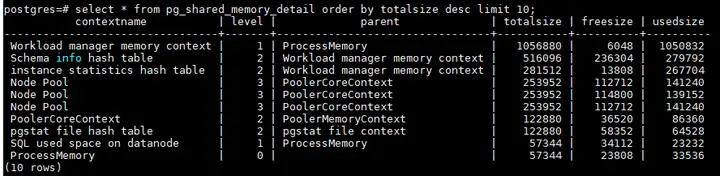
일반적으로 Shared memory context의 할당은 statement와 관련이 있는데 contextname은 thread number나 query_id를 가지게 되며 비정상적인 sql은 query_id나 thread number에 따라 체크하여 kill하게 된다. 커널의 각 모듈이 사용하는 메모리(예: topsql) 메모리 사용이 합리적인지와 릴리스 메커니즘을 확인해야 합니다.
4. 메모리 보기에서 pv_total_memory_detail, dynamic_used_memory > max_dynamic_memory
1) GUC 파라미터 disable_memory_protect가 켜져 있을 때
2) 메모리 할당 시 debug_query_id는 0
3) 커널이 키 코드 세그먼트를 실행할 때
4) 커널 Postmaster 스레드 내 메모리 할당
5) 트랜잭션 롤백 단계에서
위의 상황은 모두 작업이 중단되지 않도록 커널이 취하는 특수 처리이며 이론적으로 사용자가 실행한 SQL이 사용하는 메모리(dynamic_used_memory)는 대규모로 max_dynamic_memory의 메모리를 초과하지 않습니다.
처음으로 Huawei Cloud의 새로운 기술에 대해 알아보고 팔로우하려면 클릭하세요~